Discovery of a cyclotron absorption line in the transient X-ray pulsar XTE J1829-098
Abstract
We report results of a spectral and timing analysis of the X-ray pulsar XTE J1829-098 using data obtained with the NuSTAR observatory during an outburst in August 2018. A strong absorption feature was detected at the energy of keV in the source spectrum. This feature was interpreted as a cyclotron resonance scattering line corresponding to the magnetic field strength of the neutron star surface G. The pulse phase-resolved spectroscopy shows that the cyclotron line is significantly detected at all phases of the pulse and its energy and other parameters are variable over the pulse period. The timing analysis of the source emission revealed strong pulsations with a period of s. The pulsed fraction is changed with the energy, including its local increase in the vicinity of the cyclotron line. Using the archival data of the RXTE observatory the presence of the cyclotron line in the spectrum of XTE J1829-098 was independently confirmed.
keywords:
pulsars: individual (XTE J1829-098) – stars: neutron – X-rays: binaries1 Introduction
XTE J1829-098 was discovered by the RXTE observatory during scans of the Galactic plane in July 2004. It has been identified as a transient X-ray pulsar with the pulse period of s (Markwardt et al., 2004).
Based on the XMM-Newton and Chandra data Halpern & Gotthelf (2007) showed that the spectrum of XTE J1829-098 in soft X-rays ( keV) can be described by an absorbed powerlaw model. It is interesting to note, that XMM-Newton detected XTE J1829-098 serendipitously on March, 2003 (i.e. before its formal discovery) during the Galactic Plane Survey program, whereas Chandra observations were performed three times in 2007. Data of the Chandra observatory allowed Halpern & Gotthelf (2007) to localize the source with an accuracy of 0.6′′ and to determine its infrared counterpart, but the type and class of this star are still unclear. These authors claimed also that the observed X-ray luminosity in the 2-10 keV energy band , where is the distance to the source, is typical for Be X-ray transients or wind-fed systems.
The flux registered from XTE J1829-098 is varied over the range of more than three orders of magnitude, that points to the transient nature of the source. Using a long term light curve of the source from RXTE/PCA monitoring observations, Markwardt et al. (2009) estimated an expected recurrence period of days and an outbursts duration of days.
New outburst from XTE J1829-098 was detected with the MAXI monitor on Aug 5, 2018 (Nakajima et al., 2018) with the flux of mCrab in the 4-10 keV energy band. Immediately after the MAXI detection a TOO observation with the NuSTAR observatory was triggered with the main purpose to reconstruct the broad band energy spectrum of the source and to search for the cyclotron line.
In Section 2 we describe observations, which were used in the paper, and the data reduction procedure. Results of the timing analysis, including pulse period measurements and pulse profile studies, are presented in Section 3. In Section 4 we report a discovery of the cyclotron absorption line in the spectrum of XTE J1829-098, results of the pulse phase-resolved spectroscopy and an independent confirmation of the cyclotron line detection from RXTE data. Results are summarized and briefly discussed in Section 5.
2 Observations and data reduction
Observations of XTE J1829-098 were performed with NuSTAR on Aug 16, 2018 (ObsID 90401332002) with an on-source exposure time of ks and an average count rate of cts s-1 per module.
The NuSTAR observatory consists of two identical X-ray telescope modules, each equipped with independent mirror systems and focal plane detector units, also referred to as FPMA and FPMB (Harrison et al., 2013). It provides X-ray imaging, spectroscopy and timing in the energy range of 3–79 keV with an angular resolution of 18′′ (FWHM) and spectral resolution of 400 eV (FWHM) at 10 keV.

To extract spectra and light curves we used the standard nustardas 1.8.0 software as distributed with the HEASOFT 6.24 package and the CALDB version 20180814. The standard lcmath tool was used to combine the light curves of the NuSTAR modules to improve a statistic for timing analysis. The source data were extracted from a circular region with radius of ′′, centered at the source position. The background data were extracted using a polygonal region away from the source position. It is important to note that the observational data show no signs of a contamination by a stray-light or ghost rays.
Additionally data of the RXTE observatory (Bradt et al., 1993) were used for an independent analysis and confirmation of the NuSTAR detections. The source was observed with RXTE in the pointing mode about two dozen times in three epochs: Aug 2004 (ObsID 90058), Aug 2008 (ObsID 93445) and Apr 2009 (ObsID 94419). We used here only data of the Proportional Counter Array (PCA, Jahoda et al., 2006) stored in the standard2 mode.
The obtained spectra were grouped to have more than 20 counts per bin using the grppha tool. The final data analysis (timing and spectral) was performed with the HEASOFT 6.24 software package. All uncertainties are quoted at the confidence level, if otherwise stated.
3 Spin period and pulse profile
The pulse period of the source was determined by using the epoch-folding technique (the efsearch tool of the HEASOFT package) we measured the pulse period as . The uncertainty was defined by the bootstrapping technique (see Boldin et al., 2013, for details).
Source light curves in different energy bands were folded into 32 phase bins using the best-fit spin period value. Corresponding pulse profiles in 3–10 keV, 10–20 keV, 20–40 keV and 40–79 keV energy bands are shown in Fig. 1. Generally, the pulse profile has a quite smooth and simple shape similar to an asymmetric sin-like one. In the 40–79 keV energy band the photon statistics is quite poor and the pulse profile is dominated mostly by a noise.
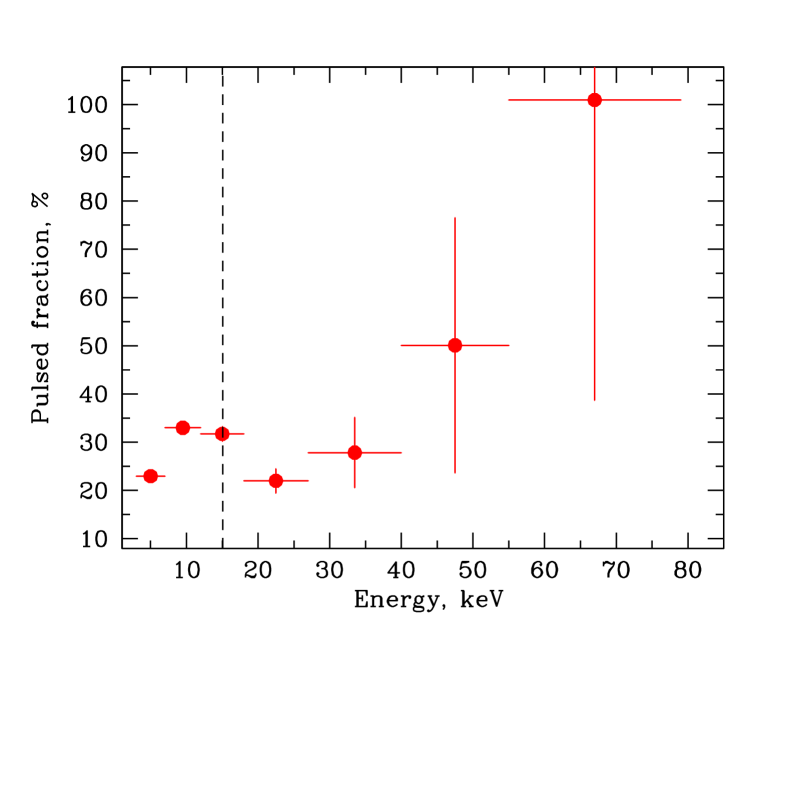
The dependence of the pulsed fraction111The pulsed fraction is defined as , where and are maximum and minimum intensities in the pulse profile, respectively. on the energy is presented in Fig. 2. At low energies its value is about 20% with a gradual increase at higher energies, that is typical for the majority of X-ray pulsars (Lutovinov & Tsygankov, 2009). Besides this general tendency the dependence shows another prominent feature: a local increase of the pulsed fraction up to 30-35% in the energy range of 10-18 keV. Such increases were initially revealed in two brightest transient pulsars V 0332+53 and 4U 0115+63 in the vicinity of the cyclotron line energies and their harmonics (Tsygankov et al., 2006, 2007). Later similar features were also found for a number of other X-ray pulsars (Lutovinov & Tsygankov, 2009). Thus, the peculiar increase of the pulsed fraction can be considered as an indication of a possible presence of the cyclotron line at energies 10-18 keV.
4 Spectral analysis
4.1 Phase-averaged spectroscopy with NuSTAR
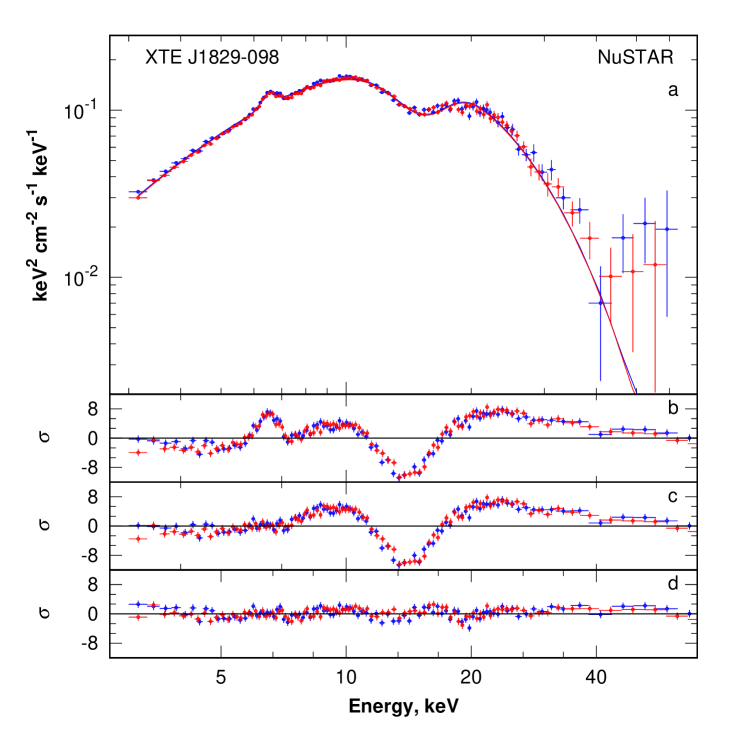
The spectrum of XTE J1829-098 is typical for accreting X-ray pulsars and demonstrates a cutoff at high energies (Fig. 3a). At the first stage it was approximated with several commonly used models: a power law with an exponential cutoff in the form (cutoffpl in the XSPEC package), a power law with a high energy cutoff (powerlaw*highcut in the XSPEC package) and a thermal Comptonization (comptt in the XSPEC package). The source and background spectra from both modules of NuSTAR were used for simultaneous fitting. To take into account the uncertainty in the instrument calibrations cross-calibration constant between them was included in all spectral models.
None of the above mentioned models describe spectrum well: there are positive deviations of the data at energies 6-7 keV and strong negative deviations at energies 13-18 keV (Fig. 3b). In the following analysis we used the cutoffpl model as it describes the spectrum better and has fewer parameters. An addition to the model an iron line at keV in the gaussian form improves the fit, but its quality is still non-acceptable ( for 1418 d.o.f.) due to a deficit of photons around 15 keV (Fig. 3c). To describe this feature an absorption component in the form of the gabs model was added to the model. It led to a significant improvement of the fit quality ( for 1415 d.o.f., Fig. 3d) and adequate description of the source spectrum.
| Parameter | Value |
|---|---|
| , keV | |
| , keV | |
| , keV | |
| , keV | |
| , keV | |
Thus, the spectrum of XTE J1829-098 can be well approximated by the cutoffpl model modified by the emission line, associated with the fluorescent iron line, and the absorption line with the energy of keV. Best-fit parameters of this model are summarized in Table 1.
The absorption feature at 15 keV can be interpreted as a possible cyclotron resonant scattering feature. To approximate cyclotron absorption lines two models from the XSPEC package are usually used: gabs and cyclabs. Both models describe the data adequately well, but the cyclotron line energy derived from the cyclabs model is systematically lower than the energy derived from the gabs one (see, e.g., Tsygankov et al., 2012; Lutovinov et al., 2015). If one would use the cyclabs model for the description of the XTE J1829-098 spectrum than the cyclotron line energy would be keV.
In spectra of several X-ray pulsars higher harmonics of the cyclotron line are also registered. To examine a presence of higher harmonics in the spectrum of XTE J1829-098 we added to the model an absorption component at the energy corresponding to the double cyclotron line energy; the line width was fixed at the value from Table 1. No further improvement of the fit was found and only an upper limit for the optical depth of the first harmonic of the cyclotron line was obtained as 0.05 (90% confidence level).
An averaged X-ray flux in the 3–79 keV energy band during the NuSTAR observation was , that corresponds to the source luminosity of . Taking into account the spectrum shape it corresponds approximately to the flux measured by Halpern & Gotthelf (2007) in the 2-10 keV energy band.
4.2 Pulse phase-resolved spectroscopy
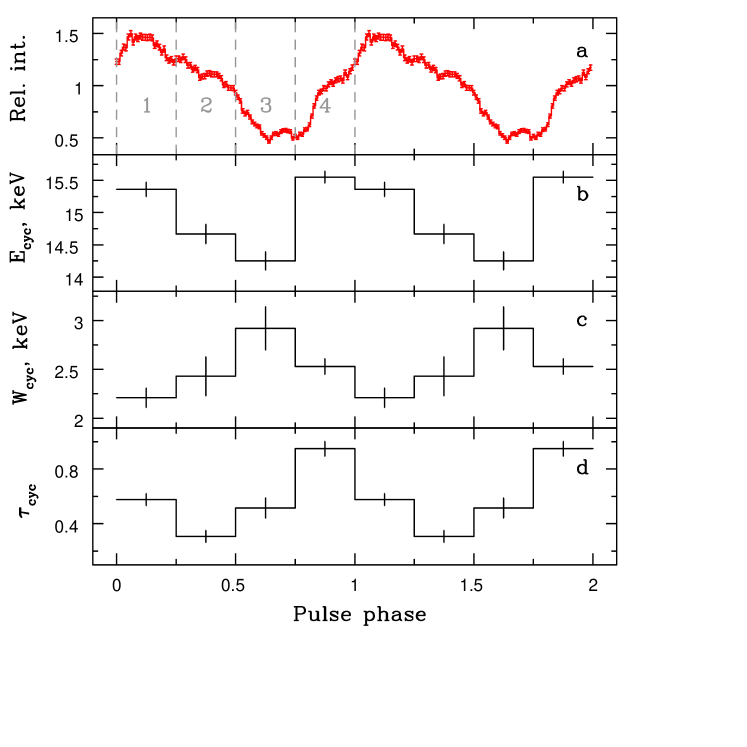
In order to study the evolution of spectral parameters of XTE J1829-098 on the time scale of the pulse period a pulse phase-resolved spectroscopy was carried out. The pulse period was divided into four intervals and corresponding spectra were extracted from the data. To approximate these spectra we applied the same model that was used for the phase-averaged spectroscopy. As for the phase-averaged spectrum the cyclotron absorption line is detected in all phase bins with high significance.
An evolution of the line parameters with the pulse phase is shown in Fig. 4. The cyclotron line energy is significantly (more than 1 keV) varied over the pulse and approximately correlates with the pulse intensity, reaching values 15.3-15.5 keV at the pulse rise and peak and decreasing down to keV at the pulse minimum. The cyclotron line width is varied nearly sinusoidally in opposition to the pulse intensity, whereas the line optical depth peaks at the maximum of the line energy. Such variations of line parameters over the pulse are quite usual, observed in many X-ray pulsars and probably connected with changes in the viewing angle to the regions where the cyclotron line is formed (see, e.g., Lutovinov et al., 2015).
4.3 Spectroscopy of XTE J1829-098 with RXTE
To examine independently results obtained with the NuSTAR observatory and to investigate a possible evolution of the cyclotron line energy with time and the source luminosity we used data from the RXTE observatory, which observed XTE J1829-098 many times in 2004-2009.
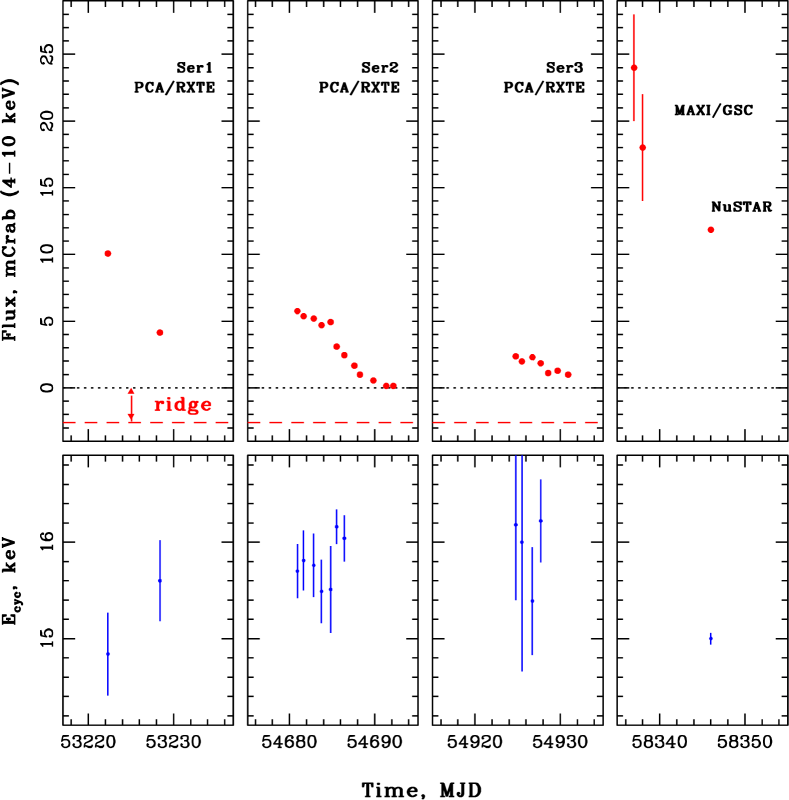
The source flux history in the 4-10 keV energy band measured during four outbursts (three ones were observed with RXTE/PCA and one was observed with MAXI and NuSTAR) is shown on upper panels of Fig. 5. Fluxes, measured by MAXI and NuSTAR, were taken from Nakajima et al. (2018) and the current work, respectively. A correct extraction of the source spectra from the RXTE data and calculation of corresponding fluxes meet some peculiarities due to the source location close to the Galactic plane, that are described in details in the Appendix.
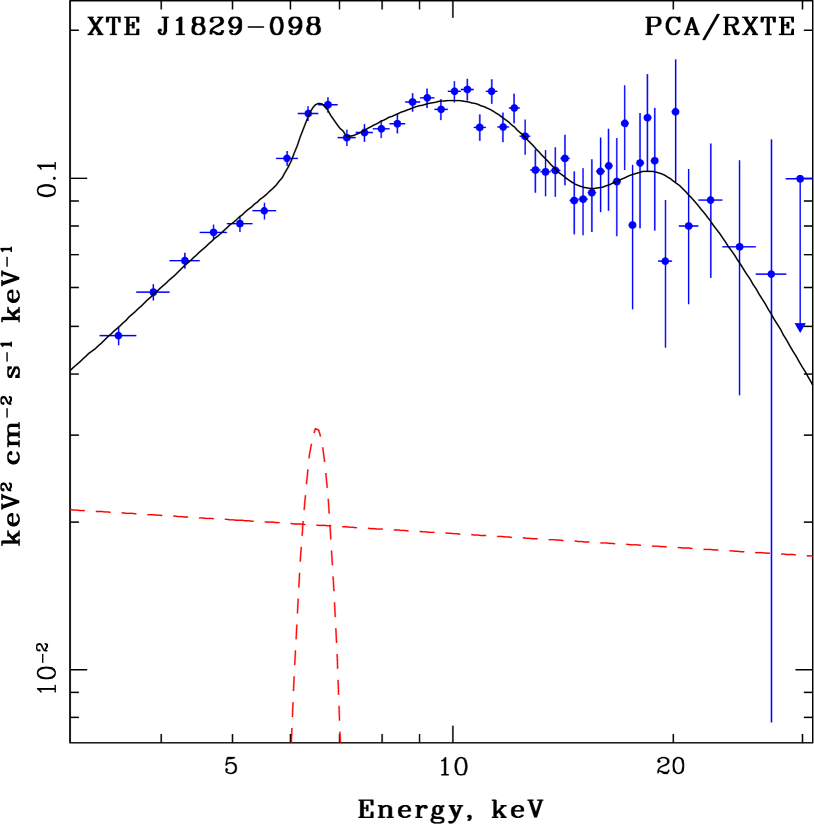
To approximate the XTE J1829-098 spectra obtained with RXTE/PCA we used the same spectral model as for the NuSTAR observation. Our analysis revealed that all spectra are well approximated with this model and an inclusion of the absorption component at energies 15-16 keV is required to improve the fit quality in comparison with the simple cutoffpl model. Thus we can independently confirm the presence of the cyclotron absorption line in the spectrum of XTE J1829-098. Due to the source faintness and short exposures of RXTE observations all three parameters of the cyclotron line cannot be well restricted. Therefore we fixed the line width on the value determined by NuSTAR for the averaged spectrum. Results of measurements of the cyclotron line energy with the RXTE observatory are presented on bottom panels of Fig. 5. The figure demonstrates that the cyclotron line energy is in good agreement for the first RXTE/PCA observation and NuSTAR one, when the source flux has a comparable level, and systematically higher (but statistically insignificant) for fainter outburst phases.
5 Conclusions
In this Letter we report a discovery of the cyclotron absorption line at keV in the spectrum of the transient X-ray pulsar XTE J1829-098. Such features are registered in spectra of many X-ray pulsars (see, e.g., recent review of Walter et al., 2015) and usually used for the direct estimates of the magnetic fields of neutron stars. The measured energy of the cyclotron absorption line corresponds to the magnetic field strength G on the surface of the neutron star, that is typical for X-ray pulsars.
The pulse phase-resolved spectroscopy revealed that parameters of the cyclotron line are variable over the pulse, that probably connected with changes of the viewing angle to the regions where the cyclotron line is formed.
The study of the pulse profile and pulsed fraction dependencies on the energy revealed two distinct features: an overall increase of the pulsed fraction with the energy and its local enhancement at energies 10-18 keV, i.e. near the cyclotron line energy. Similar peculiarities of the pulsed fraction were observed earlier for several other X-ray pulsars.
Finally, using the archival data of the RXTE observatory the presence of the cyclotron line in the spectrum of XTE J1829-098 was independently confirmed. Moreover some hint to possible variations of the line energy with the flux was revealed, but for the final conclusions special monitoring observations with the high sensitivity instruments (like the NuSTAR one) are required.
Acknowledgements
This work was supported by the grant of the Ministry of Science and High Education 14.W03.31.0021. The research has made by using data obtained with NuSTAR, a project led by Caltech, funded by NASA and managed by NASA/JPL, and has utilized the nustardas software package, jointly developed by ASDC and Caltech. AS would like to thank Karl Forster for the assistance in scheduling the observation.
References
- Boldin et al. (2013) Boldin P. A., Tsygankov S. S., Lutovinov A. A., 2013, Astronomy Letters, 39, 375
- Bradt et al. (1993) Bradt H. V., Rothschild R. E., Swank J. H., 1993, A&AS, 97, 355
- Halpern & Gotthelf (2007) Halpern J. P., Gotthelf E. V., 2007, ApJ, 669, 579
- Harrison et al. (2013) Harrison F. A., et al., 2013, ApJ, 770, 103
- Jahoda et al. (2006) Jahoda K., Markwardt C. B., Radeva Y., Rots A. H., Stark M. J., Swank J. H., Strohmayer T. E., Zhang W., 2006, ApJS, 163, 401
- Lutovinov & Tsygankov (2009) Lutovinov A. A., Tsygankov S. S., 2009, Astronomy Letters, 35, 433
- Lutovinov et al. (2015) Lutovinov A. A., Tsygankov S. S., Suleimanov V. F., Mushtukov A. A., Doroshenko V., Nagirner D. I., Poutanen J., 2015, MNRAS, 448, 2175
- Markwardt et al. (2004) Markwardt C. B., Swank J. H., Smith E. A., 2004, The Astronomer’s Telegram, 317
- Markwardt et al. (2009) Markwardt C. B., Halpern J., Swank J. H., 2009, The Astronomer’s Telegram, 2007
- Nakajima et al. (2018) Nakajima M., et al., 2018, The Astronomer’s Telegram, 11927
- Revnivtsev et al. (2006) Revnivtsev M., Sazonov S., Gilfanov M., Churazov E., Sunyaev R., 2006, A&A, 452, 169
- Tsygankov et al. (2006) Tsygankov S. S., Lutovinov A. A., Churazov E. M., Sunyaev R. A., 2006, MNRAS, 371, 19
- Tsygankov et al. (2007) Tsygankov S. S., Lutovinov A. A., Churazov E. M., Sunyaev R. A., 2007, Astronomy Letters, 33, 368
- Tsygankov et al. (2012) Tsygankov S. S., Krivonos R. A., Lutovinov A. A., 2012, MNRAS, 421, 2407
- Walter et al. (2015) Walter R., Lutovinov A. A., Bozzo E., Tsygankov S. S., 2015, A&ARv, 23, 2
Appendix A XTE J1829-098 spectrum reconstruction with RXTE/PCA
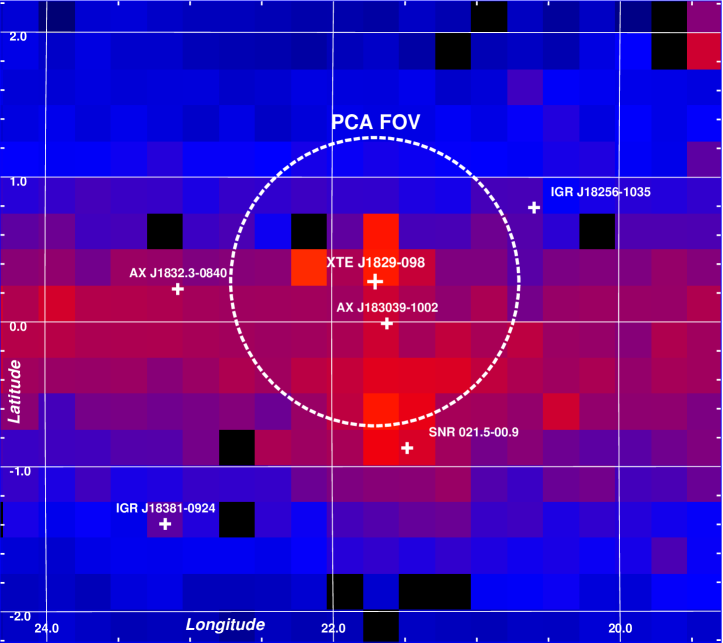
XTE J1829-098 is located in the sky area where the Galactic ridge emission could not be treated as a negligible one for instruments with wide fields of view similar to RXTE/PCA. The map of the sky region around XTE J1829-098 in the total PCA energy band is shown in Fig. 7. This image had been reconstructed using all PCA scanning observations of the Galactic plane. An extended emission along the Galactic plane is clearly seen. Thus, to reconstruct correctly the spectrum of XTE J1829-098 we should take into account not only the instrumental background, but also a component connected with the Galactic ridge emission and the possible contribution of individual sources falling into the PCA FOV (see, e.g., Markwardt et al., 2004). To estimate this ’sky’ background component and its spectrum we used two last observations in the Ser. 2 (see upper panels of Fig. 5), where XTE J1829-098 was on the undetectable level (i.e. pulsations from the source were not detected). This ’sky’ background emission can be adequately fitted by the simple power law model with the spectral index of , the Gaussian emission line around keV and the total flux of mCrab in the 4-10 keV energy band. This is well agreed with results of measurements of the Galactic ridge emission by Revnivtsev et al. (2006). The spectrum of the ’sky’ background emission and its contribution to the total flux, measured from the XTE J1829-098 with RXTE/PCA, are shown by red dashed lines in Fig. 5 and 6.