11email: csanchez@cab.inta-csic.es 22institutetext: Observatorio Astronómico Nacional (IGN), Alfonso XII No 3, 28014 Madrid, Spain 33institutetext: Observatorio Astronómico Nacional (IGN), Ap 112, 28803 Alcalá de Henares, Madrid, Spain 44institutetext: Institut de Radioastronomie Millimetrique, 300 rue de la Piscine, 38406 Saint Martin d’Heres, France 55institutetext: Instituto de Fisica Fundamental (CSIC), C/ Serrano, 123, E-28006, Madrid, Spain
Through the magnifying glass: ALMA acute viewing of the intricate nebular architecture of OH231.8+4.2
We present continuum and molecular line emission ALMA observations of OH 231.84.2, a well studied bipolar nebula around an asymptotic giant branch (AGB) star. The high angular resolution (02-03) and sensitivity of our ALMA maps provide the most detailed and accurate description of the overall nebular structure and kinematics of this object to date. We have identified a number of outflow components previously unknown. Species studied in this work include 12CO, 13CO, CS, SO, SO2, OCS, SiO, SiS, H3O+, Na37Cl, and CH3OH. The molecules Na37Cl and CH3OH are first detections in OH 231.84.2, with CH3OH being also a first detection in an AGB star. Our ALMA maps bring to light the totally unexpected position of the mass-losing AGB star (QX Pup) relative to the large-scale outflow. QX Pup is enshrouded within a compact (60 AU) parcel of dust and gas (clump S) in expansion (5-7 km s-1) that is displaced by 06 to the south of the dense equatorial region (or waist) where the bipolar lobes join. Our SiO maps disclose a compact bipolar outflow that emerges from QX Pup’s vicinity. This outflow is oriented similarly to the large-scale nebula but the expansion velocities are about ten times lower (35 km s-1). We deduce short kinematical ages for the SiO outflow, ranging from 50-80 yr, in regions within 150 AU, to 400-500 yr at the lobe tips (3500 AU). Adjacent to the SiO outflow, we identify a small-scale hourglass-shaped structure (mini-hourglass) that is probably made of compressed ambient material formed as the SiO outflow penetrates the dense, central regions of the nebula. The lobes and the equatorial waist of the mini-hourglass are both radially expanding with a constant velocity gradient ( ). The mini-waist is characterized by extremely low velocities, down to 1 km s-1 at 150 AU, which tentatively suggest the presence of a stable structure. The spatio-kinematics of the large-scale, high-velocity lobes (HV lobes) and the dense equatorial waist (large waist) known from previous works are now precisely determined, indicating that both were shaped nearly simultaneously about 800-900 yr ago. We report the discovery of two large (8″6″), faint bubble-like structures (fish bowls) surrounding the central parts of the nebula . These are relatively old structures although probably slightly (100-200 yr) younger than the large waist and the HV lobes. We discuss the series of events that may have resulted in the complex array of nebular components found in OH 231.84.2 as well as the properties and locus of the central binary system. The presence of 80 yr bipolar ejections indicate that the collimated fast wind engine is still active at the core of this outstanding object.
Key Words.:
Stars: AGB and post-AGB – circumstellar matter – Stars: winds, outflows – Stars: mass-loss – TBC1 Introduction
The very short (103 yr) evolutionary transition from the asymptotic giant branch (AGB) to the planetary nebula (PN) phase is accompanied by significant morphological and dynamical changes that are not fully understood: the roughly round circumstellar envelopes (CSEs) around AGB stars that result from their slow ( 5-15 km s-1), isotropic stellar winds evolve into post-AGB nebulae (or pre-PNe=pPNe) with high-speed (100 km s-1) outflows and a dazzling variety of shapes and intriguing symmetries. The primary agent for breaking the spherical symmetry is unknown but most theories require a central binary system to assist in the production of collimated fast winds (CFW) or jets (see, e.g., the review paper on PN-shaping by Balick and Frank, 2002). Together with pPNe, observationally recognized by prominent aspherical nebulosities surrounding a central post-AGB star, there are a few objects that show pPN-like morphologies and fast outflows but have AGB central stars, indicating that the onset of asymmetry can begin while the central star is still on the AGB.
The best example of this class of objects is OH 231.84.2 (hereafter, OH 231.8): a fast, 0.040.4 pc-sized bipolar outflow around a Mira-type pulsating M 8-10 III star (QX Pup). (V Hya and Gruis are other AGB stars with fast bipolar outflows, see Hirano et al. 2004; Doan et al. 2017.) OH 231.8 has been extensively studied at many wavelengths by several authors, including our team, and is believed to be a PN precursor (e.g., Reipurth, 1987; Morris et al., 1987; Kastner et al., 1992; Sánchez Contreras et al., 1997; Kastner et al., 1998; Alcolea et al., 2001; Bujarrabal et al., 2002; Meakin et al., 2003; Sánchez Contreras et al., 2004). Before ALMA came into play (this work), two major large-scale components had been identified in its massive ( 1 ) and predominantly cold (10-40 K) molecular envelope: () a dense, equatorial structure with an angular diameter of 6′′ expanding at low velocity, 30 km s-1, and () a highly collimated 6′′57′′ bipolar outflow with deprojected expansion velocities that increase linearly with the distance from the center up to 180 and 400 km s-1 at the tips of the north and south lobes, respectively. It has been proposed that most of this nebular material was ejected by the central AGB star during a period of very high mass-loss rate, 1.6 yr-1, that started 4000 yr ago (Alcolea et al., 2001). The bipolar flow, with a total linear momentum of 15 km s-1, has been interpreted in the general framework of pPN and PN shaping, that is, as the result of a sudden interaction between CFWs on the pre-existing, slowly expanding AGB envelope. The linear distance-velocity relation observed in the CO outflow suggests that such an interaction took place 800 yr ago and lasted less than 150 yr.
Ground-based images of OH 231.8 in the near-IR revealed a faint, quasi-spherical halo surrounding the central parts of the nebula (Alcolea et al., 2001). This halo is detected up to radial distances of 20″ and is thought to be a relic of an ancient wind that was ejected at a constant rate of 2 yr-1. The extent of the halo indicates that this mass-loss process started at least 11000 yr ago and ended about 6500 yr later. This was followed by the period of highest mass-loss rate mentioned above during which most of the mass of the molecular outflow of OH 231.8 was ejected.
The detection of a binary companion (A0 V) to the central AGB star QX Pup111The light from the central sources inside OH 231.8’s core is highly obscured by dust along the line-of-sight and is only seen indirectly scattered by the dust in the lobe walls. is a key to understand the formation of this nebula and, in particular, the mechanism for producing the underlying jets; the latter are proposed to be launched by the compact companion, powered by mass accretion from the mass-losing AGB star through an FU Orionis-like outburst (see Sánchez Contreras et al., 2004). These outbursts are short periods of increased disk-to-companion accretion rates, reaching values up to 10-3 yr-1. During the quiescent phases when the outburst activity is switched off, matter from the AGB wind piles up in the disk steadily at a relatively low rate until a rapid (lasting 100 yr) and massive accretion event occurs, resulting in the kind of energetic fast wind seen in OH 231.8. At present, OH 231.8 is most likely in a period of steady accretion at a low rate, given the lack of any strong signature of current accretion (e.g., H emission from the core, but see also § 4.2).
Several SiO =1 and =2 maser transitions have been observed in OH 231.8 (Morris et al., 1987; Sánchez Contreras et al., 1997, 2000, 2002a; Desmurs et al., 2007; Dodson et al., 2018). These masers are known to arise from the pulsating layers of QX Pup (2.4) interior to the dust condensation and wind-acceleration region. The presence of SiO masers in the stellar vicinity indicates that QX Pup is currently undergoing substantial mass-loss. The mass-loss rate of the present-day wind of QX Pup appears to be significantly smaller than it was when the bulk of the nebula was ejected. An upper limit to the mass-loss rate of the present-day wind of QX Pup of 2 yr-1 was estimated by Sánchez Contreras et al. (2002a). This limit is consistent with the mass-loss rate of the warm, inner-envelope layers (few cm) recently derived from a molecular line study of mid- to high- CO transitions (with upper-level energies Eu500-1000 K) observed with Herschel/PACS toward this object, 10-5 yr-1 (Ramos-Medina et al., private communication). Water masers are also present at the base of the bipolar flow of OH 231.8 (within 100 AU from the central star) and expanding along the symmetry axis at moderate velocities of 19 km s-1 (Desmurs et al., 2007; Choi et al., 2012; Leal-Ferreira et al., 2012; Dodson et al., 2018).
OH 231.8 not only exhibits an outstanding nebular structure and kinematics, but it is also the chemically richest envelope amongst O-rich AGB stars and post-AGB objects (e.g., Morris et al., 1987; Sánchez Contreras et al., 1997, 2000). Recent studies based on spectral surveys at millimeter and far-IR wavelengths have led to the discovery of 30 new species (including SO+, H3O+, HNCO, HNCS, NO, etc) and to an unprecedented detailed description of the global physico-chemical structure of this object (Velilla Prieto et al., 2015; Sánchez Contreras et al., 2015, Velilla Prieto et al., in preparation).
Unlike for most pPNe, the distance to OH 231.8 and the inclination of the polar axis of the large-scale nebula are well known from several independent works. The distance to OH 231.8 has been most accurately determined from a trigonometric parallax measurement of the H2O masers, leading to =1.54+0.02(-0.01) kpc (Choi et al., 2012). The inclination of the bipolar lobes with respect to the plane of the sky is 35°-37°, with the south lobe being further away (Kastner et al., 1992; Bowers and Morris, 1984; Shure et al., 1995). Here we have adopted =1500 pc and =35°, which are rounded values commonly used in the literature.
The stellar radius of QX Pup is 2.1 AU, considering its total luminosity and effective stellar temperature, 7000(1.5/[kpc])2 and 2500 K. The luminosity is derived by us by integrating the spectral energy distribution (SED) of OH 231.8 from the optical to the mm-wavelength domain (see Fig. 1) and after correcting by interstellar extinction =0.4665. This value of corresponds to a color excess of E(B-V)0.15 measured toward the 0.25 Gyr old cluster to which OH 231.8 belongs (M46=NGC 2437; e.g., Jura & Morris, 1985; Davidge, 2013) and adopting a standard value of =3.1.
Here we present a continuum and molecular line study based on 02-03-angular resolution ALMA observations in the 294-345 GHz frequency range. These data have revealed a collection of substructures previously unknown, which are the focus of this publication. In Sect. 2 the observations and data reduction steps are described. The observational results derived from the continuum and molecular line maps are presented in § 3 and § 4, respectively. In § 5, we present the data analysis, namely, density and temperature maps of the central regions of the molecular outflow (§ 5.1) and estimates of the abundances of some molecules (§ 5.2). A final discussion and a summary of our main conclusions are offered in § 6 and § 7, respectively.
2 Observations
| Center | Bandwidth | Velocity width |
|---|---|---|
| (GHz) | (MHz) | (m/s) |
| Science goal SG1: 5-point mosaic (2016-07) | ||
| 344.246 | 468.750 | 212.614 |
| 345.732 | 468.750 | 211.700 |
| 342.819 | 468.750 | 426.998 |
| 330.526 | 468.750 | 442.879 |
| 331.438 | 937.500 | 883.320 |
| Science goal SG2: 1-pointing at center (2016-07) | ||
| 293.859 | 468.750 | 498.140 |
| 294.447 | 234.375 | 248.573 |
| 304.070 | 937.500 | 481.412 |
| 307.045 | 468.750 | 953.496 |
| 305.945 | 468.750 | 956.924 |
OH 231.8 was observed with the ALMA 12-m array as part of project 2015.1.00256.S on July 2016. Five different spectral windows (SPWs) within band 7 (294-345 GHz) were observed in each of our two science goals, SG1 and SG2, to map the emission from different molecular transitions as well as the continuum (Table 1). SG1-observations were performed as a five-pointing mosaic covering a 19″54″ area along the main symmetry axis of OH 231.84.2’s molecular outflow, at position angle PA=21°; SG2-observations were done as a single-pointing toward the nebula center, using a nominal position of R.A.(ICRS)=07h:42m:16894 Dec.(ICRS)=14°42′49836. The field of view (FoV) of the SG2-observations has the same size as the ALMA 12-m antennas’ primary beam (i.e., 21″ at 300 GHz at half-intensity). SG1 and SG2 observations were split in three different sessions (or blocks) executed within a window of a few days. The total number of antennas ranged between 34 and 39, depending on the science goal and the session. The minimum and maximum baseline length in our SG1 and SG2 observations were 15.1 and 867.2 m and 16.7 and 1100 m, respectively, leading to a spatial resolution of 02-03. The total time spent on the science target, OH 231.84.2, was 353 and 443 minutes for SG1 and SG2, respectively (a total of about 4 hours). Following the standard calibration procedure, a number of sources (J0522-3627, J0730-1141, J0740-1351 and J0750+1231) were also observed as passband, complex gain, and flux calibrators.
The visibility data for each session (execution block) were calibrated by the automated pipeline of the Common Astronomy Software Applications (CASA) version 4.7.0. This includes the standard corrections from the initial MeasurementSet (based on system temperature and water vapor radiometer measurements, antenna positions, derived calibrations for the bandpass, phase, and amplitude, flagging tables, etc) to the fully calibrated data, which are ready for imaging. For each of our science goals, two continuum images were made using the line-free channels from the upper and lower sideband (USB and LSB) spectral windows, respectively. This has lead to a total of four different continuum images centered at 344 GHz (SG1-USB), 330 GHz (SG1-LSB), 304 GHz (SG2-USB), and 294 GHz(SG2-LSB). The continuum images at these four representative frequencies have been restored using a common clean beam, with half-power beam width HPBW=031025 and oriented along PA=84.5° (Fig. 1), which is the beam with lowest resolution of the four sideband combinations (i.e., SG1-USB).
Line emission cubes were created after subtracting the continuum from the visibility data in the spectral baseband containing the line (USB or LSB). After this, we created spectral cubes for the different transitions using the CASA task tclean using a spectral resolution of =1-3 km s-1, depending on the signal-to-noise ratio (S/N) of the maps. By default, we used Briggs weighting with a robust parameter of 0.5, which results in angular resolution of 031025 and 028022 for SG1 and SG2, respectively. For certain transitions, we have created additional velocity-channel maps with uniform weighing (robust=2) for an improved angular resolution (e.g., down to 022018 in the USB of SG2). The typical rms noise level in the line-free channels of our spectral cubes is 1.6-6 mJy/beam. The pixels have a size of 004 in all our maps. All images are corrected for the primary beam, that is, the dependence of the instruments sensitivity on direction within the field of view, using the CASA task impbcor.
2.1 Flux losses
For the ALMA configurations used in this project, the angular size of the largest smooth structure to which our observations are sensitive (or maximum recoverable scale) is 3″. The largest angular scales in most regions of the highly-structured CO outflow of OH 231.8 are known to be 3″ (Alcolea et al., 2001) and, thus, significant interferometric flux losses in our ALMA maps are not expected.
We confirm negligible interferometric flux losses in the continuum emission maps by comparison with single-dish measurements (see details in § 3). In Appendix A, we confront line integrated profiles from our ALMA maps with single-dish spectra from our mm-wavelength survey of OH 231.8 with the IRAM 30m telescope (Velilla Prieto et al., in preparation) – see Fig. 18. For the majority of the transitions, the ALMA line fluxes are larger than the single-dish values. This is expected for a number of reasons. In the case of molecules with an emission distribution comparable to, or more extended than, that of the continuum (e.g. CS) this is partially due to the relatively small beam of our single-pointed IRAM-30 m spectra (7″ at 340 GHz) compared with the full extent of the emitting region. This together with the typical IRAM-30 m pointing errors, which can easily be of up to 2″-3″ (i.e., about 1/3 of the beam) is probably the main reason for the inferior single-dish line fluxes. Absolute calibration uncertainties (30% in the IRAM-30 m spectra at 0.9 mm) also partially contribute to the differences observed. Finally, in the case of high excitation transitions with compact emission, like =1 lines but also =0 SiO (=7-6) and 29SiO (=8-7) intrinsic line variability, which may result from variable excitation conditions modulated by the stellar near-to-mid IR variability, is also possible as observed, e.g., in IRC+10216 and IRC+10420 (Cernicharo et al., 2014; Quintana-Lacaci et al., 2016).
For the reasons explained above, significant interferometric flux losses in our maps are not expected, except maybe for some of the large-scale 12CO/13CO emission of the fossil AGB envelope that surrounds the low-velocity core. These will be addressed in detail in a future publication as part of a comprehensive study of the ALMA maps of these transitions.
3 Continuum emission by dust
The ALMA continuum emission maps of OH 231.8 at 294, 304, 330 and 344 GHz are shown in Fig.1. The surface brightness distribution of the continuum emission, which is very similar at these four frequencies, appears as an extended, incomplete hourglass-like structure of dimensions 8″4″ (at the rms level) formed by two opposing, dense-walled lobes roughly oriented along PA21° (i.e., the symmetry axis of the large-scale nebula). The lobes join at the nebula center in a pinched (25-wide) equatorial waist. The hourglass is notably asymmetric with respect to the PA21° axis, with the east side of the lobes being much brighter than the west. The nebular asymmetry with respect to the equatorial plane is also appreciable.
| Frequency | Total Flux | Peak-Flux | rms |
|---|---|---|---|
| (GHz) | (Jy) | (mJy/beam) | (mJy/beam) |
| 293.912 | 1.13 | 51.1 | 0.30 |
| 304.125 | 1.22 | 54.9 | 0.25 |
| 330.588 | 1.71 | 65.5 | 0.50 |
| 344.310 | 1.88 | 71.4 | 0.50 |
The continuum emission distribution is not uniform but it shows a number of bright compact condensations or clumps. The peak of the continuum maps is attained at one of these clumps referred to as clump S, which has coordinates R.A.=07h42m16915 and Dec.=14°42′5006 (J2000). As we will show below, clump S marks the position of the central star QX Pup (for epoch 2016.6). These coordinates coincide to within 001 with the absolute position of the SiO =1,2 masers at 43 GHz recently measured by Dodson et al. (2018). Throughout this paper, the position of clump S has been adopted in defining the (0″, 0″) positional offsets in all figures illustrating continuum (and line) image data. We note that clump S does not lie on the equatorial plane of the central waist, but it is clearly displaced along the axis toward the south by 06.
Using high-angular resolution - and -band images of OH 231.84.2, Kastner et al. (1998) report the detection of a point-like source at the midpoint of the nebula waist with the reddest colors, which is tentatively attributed by the authors to the central illuminating star, QX Pup. The latter is presumably deeply buried in a high-density, very optically thick (100 mag) dusty region. Unfortunately, the absolute coordinates of these NIR images are not provided by Kastner et al. (1998) and, therefore, we cannot assess whether or not the reddest region coincide with clump S.
The total continuum flux, obtained by integrating the surface brightness over the emitting region, as well as the continuum peak surface brightness at clump S at the four frequencies observed with ALMA are given in Table 2. The good agreement of the ALMA total fluxes with measurements from single-dish observations in the submm-to-mm wavelength range (Fig. 1, bottom panel) indicate negligible flux losses of the extended emission in our interferometric continuum maps.
Except for clump S, the spectral index of the continuum shows no significant deviations from a power-law across the different regions. This implies a dominant contribution by optically thin 75 K dust with an emissivity index of 1.3, consistent with previous studies (Sánchez Contreras et al. 1998; see SED in Fig. 1). At clump S, which is the brightest condensation, the continuum follows a less steep frequency dependence approximately consistent with blackbody emission.
The compact emission clump S appears to be partially resolved in our maps, although an accurate determination of its angular size is difficult due to the presence (and poor subtraction) of the non-uniform underlying emission. In order to mitigate this effect, we have fitted a single component source model to the continuum data using only the longest baselines (length250 m). This enables us to filter out partially the underlying extended emission from the dust and to better isolate the emission from clump S. To do that, we used the CASA task uvmodelfit. The fit of the 306 GHz-continuum visibility data adopting an elliptical gaussian model for clump S yields beam-deconvolved dimensions of 00540043, with the major axis oriented along PA=53°. By fitting a disk source model, we find somewhat larger dimensions 009007 and similar orientation. Within uncertainties, both results suggest an elongated structure with a typical radius of 40-70 AU. We stress that this value is very uncertain and it could well represent an upper limit to the real size given that clump S is marginally resolved in our maps.
| Molecule | Transition | Rest Frequency | Eu |
|---|---|---|---|
| QNs(u→l) | (GHz) | (K) | |
| CS | 6 0 – 5 0 | 293912.086 | 49.4 |
| 30SiO =1 | 7 1 – 6 1 | 294539.577 | 1804.3 |
| SiO | 7 0 – 6 0 | 303926.812 | 58.3 |
| OCS | 25 – 24 | 303993.262 | 189.7 |
| SO | 7 8 – 6 7 | 304077.844 | 62.1 |
| CH3OH | 2 1 1 -0 – 2 0 2 +0 | 304208.350 | 21.6 |
| 34SO2 | 3 3 1 – 2 2 0 | 304332.030 | 26.8 |
| SiS =1 | 17 1 – 16 1 | 307014.349 | 1203.8 |
| H3O+ | 1 - 2 | 307192.410 | 79.5 |
| CH3OH | 4 1 3 -0 – 4 0 4 +0 | 307165.940 | 38.0 |
| 13CO | 3 – 2 | 330587.965 | 31.7 |
| Na37Cl | 26 0 – 25 0 | 330805.749 | 214.5 |
| SO2 | 11 6 6 – 12 5 7 | 331580.244 | 149.0 |
| CS | 7 0 – 6 0 | 342882.850 | 65.8 |
| 29SiO | 8 0 – 7 0 | 342980.847 | 74.1 |
| 33SO | 8 9 8 – 7 8 7 | 343086.102 | 78.0 |
| 34SO2 | 10 4 6 – 10 3 7 | 344245.346 | 88.4 |
| SO | 8 8 – 7 7 | 344310.612 | 87.5 |
| 34SO2 | 7 4 4 – 7 3 5 | 345519.656 | 63.6 |
| 34SO2 | 5 4 2 – 5 3 3 | 345651.293 | 51.7 |
| 12CO | 3 – 2 | 345795.990 | 33.2 |
The continuum emission flux from clump S is much larger than that expected from the photosphere of QX Pup. In fact, the effective temperature and luminosity of QX Pup (2500 K and 7000 , § 1) imply a main-beam brightness temperature of =2500 K()2=0.25 K=1.8 mJy at 344 GHz (considering the ALMA beam=031025 and mJy-to-K=7.3 conversion factor at this frequency) which is much smaller than the observed flux (Table 2 and Fig. 1). This implies that the continuum flux from clump S is dominated by thermal emission from a source other than the star, most likely, by dust distributed in its vicinity (within 100 AU). The spectral index of the continuum indicates that the dust emission is either i) optically thick or ii) optically thin with emissivity 0 (i.e., produced by large solid particles). We explore these two possibilities.
i) In the case of optically thick dust, the 344 GHz-continuum flux at clump S, which is equivalent to a main-beam brightness temperature of 9.6 K, would imply a dust temperature of 9.6()2 K. Considering the half-intensity radius of clump S estimated above, 40-70 AU, we derive a characteristic dust temperature of 260-85 K. Using this temperature and the observed flux from clump S (Table 2), we obtain a lower limit for the dust mass using the equation:
| (1) |
where and are the Boltzmann constant and the speed of light, as usual, and adopting a dust absorption coefficient of =0.33 cm2/g at 1 mm (Li & Draine, 2001) and the Rayleigh-Jeans approximation. We deduce a very high value for the mass of 0.008-0.0025 (for =85 and 260 K, respectively), which, for a typical gas-to-dust mass ratio in O-rich AGB stars of 100-200 (e.g., Knapp, 1985), implies an unrealistically high amount of material in clump S (even larger than444For a dust optical depth of 3.5, as suggested by the law, the mass correction factor would be 3.6. all the mass contained in the dense equatorial regions of the large-scale nebula, 0.6 , § 1). This result rules out the optically-thick dust scenario to explain in clump S.
ii) In the case of optically-thin thermal emission produced by large ( 100 m-sized) grains, we can obtain a rough estimate of the mean dust temperature and mass in clump S as follows. For big grains, a flat emissivity law (=0) is expected555The grain emissivity law flattens, 0, typically at wavelengths smaller than 4, with being the grain radius. and, in this case, assuming radiative equilibrium (i.e., that the energy absorbed by the grains is totally reemitted at longer wavelengths) and that the only dust heating mechanism is the stellar radiation, the dust temperature can be expressed as:
| (2) |
where, is the stellar luminosity, is the distance of the dust to the central star, and is the Stefan-Boltzmann constant (see e.g., Herman et al., 1986). Using this simplified formula, we derive a dust temperature of 400-300 K at 40-70 AU. Adopting the average value 350 K, and using the formulation described, for example, in Sánchez Contreras et al. (1998), we find that the dust mass in clump S is 2 (2) for a grain radius of =100 (1000) m. As expected, this represents a very small fraction of the total dust content of the nebula, 5-10-2 , which resides predominantly in the large-scale hourglass nebula (Sánchez Contreras et al., 1998; Kastner and Weintraub, 1995).
4 Molecular line emission: nebular structure and kinematics
The list of (identified) molecular transitions that have been detected toward OH 231.8 within the spectral windows observed with ALMA as part of project 2015.1.00256.S is given in Table 3. The vibrationally excited (=1) lines of SiS and 30SiO as well as the Na37Cl and CH3OH molecules are first time detections in this object. The detection of CH3OH is particularly important since this is the first AGB star in which this species has been discovered. We confirm the presence of weak p-H3O+ (=1 - 2) emission, which was previously reported by Sánchez Contreras et al. (2015).
In addition to adding detailed information on the morphology and dynamics of the two major components of the molecular envelope of OH 231.8 already known from previous works (namely, the fast bipolar outflow and the slowly expanding equatorial waist of the large-scale nebula – § 1), our ALMA observations unveil a series of new nebular components. In the following subsections, we describe the different (small-to-large scale) nebular structures traced by ALMA, starting from the most compact ones (the inner-envelope layers within a few 1015 cm from the mass-losing star) and ending with the most extended zones (reaching out to few cm). The different envelope components of OH 231.8 are selectively (and, in some cases, exclusively) traced by certain molecules or transitions included in these observations, which facilitates disentangling the intricate nebular architecture of OH 231.8.
| Name | molecular | projected | range | Sections | Figures | ||||
| tracer111111Transitions are listed in Table 3. | size (″) | (km s-1) | |||||||
| clump S | Na37Cl, SiS =1, 30SiO =1 | 008008††{\dagger}††{\dagger}Barely resolved. | [25:45] | § 4.1 | Fig. 3 | ||||
| SiO outflow | SiO, 29SiO | 1″4″, PA17°‡‡{\ddagger}‡‡{\ddagger}Uncertain. | [18:53] | § 4.2 | Figs. 4, 5 | ||||
| mini-hourglass |
|
” | [20‡‡{\ddagger}‡‡{\ddagger}Uncertain.:50] | § 4.3 | Figs. 6, 7, 8 | ||||
| large hourglass222222Includes the equatorial waist and base of the large-scale lobes. |
|
4″8″, PA21° | [13:80] | § 4.4, § 4.4.1 | Figs. 9, 10, 11 | ||||
| HV lobes | 12CO,13CO, CS##\###\#Detected in selected regions of the HV-lobes – not discussed (shown) in this paper., SO##\###\#Detected in selected regions of the HV-lobes – not discussed (shown) in this paper., SO2##\###\#Detected in selected regions of the HV-lobes – not discussed (shown) in this paper., SiO##\###\#Detected in selected regions of the HV-lobes – not discussed (shown) in this paper. |
|
|
§ 4.4, § 4.4.2 | Figs.12, 13 | ||||
| fish bowls | 12CO, 13CO |
|
|
§ 4.5 | Fig.14 |
We have focussed on the new major features exposed by these ALMA observations. A brief report on the ALMA view of the principal envelope components of OH 231.8 already known is also given but we defer to a future publication a more detailed description and comprehensive study.
To facilitate visualizing the complex array of nebular structures in OH 231.8 we offer a schematic view in Fig. 2. We also summarize the main identificative properties of the components in Table 4 together with references to sections and Figures where the individual structures are described in great detail.
4.1 The close surroundings of QX Pup: clump S
We have detected compact SiS (=1, =17-16), 30SiO (=1, =7-6), and Na37Cl (=0, =26-25) emission arising entirely from clump S (Fig. 3). Vibrationally excited SiS and SiO lines such as those observed here (with Eu1200-1800 K) are known to be produced in the warm inner (1015cm) layers of the winds of evolved mass-losing stars, where dust grain formation is probably not yet complete and where the stellar wind may have not reached its terminal expansion velocity (see Höfner & Olofsson, 2018, for a recent review paper on AGB CSEs). This supports the hypothesis that clump S harbours QX Pup. The region where the SiS =1, 30SiO =1, and Na37Cl =0 line emission is produced is barely resolved in our 02-03-resolution ALMA maps. We have fitted an elliptical gaussian to the integrated intensity maps of the SiS =1 transition, which is the line with the highest signal-to-noise ratio, leading to a deconvolved angular diameter of the emitting source of 008. At a distance of =1500 pc, this implies that the emission is confined to a small emitting volume of radius 60 AU (24) comparable to that of the continuum-emitting core at the center, i.e., clump S (§ 3).
The spectral profiles of these transitions, integrating the line surface brightness over the compact emitting area at clump S, are centered at 35 km s-1 and have full widths at half maximum in the range FWHM8-12 km s-1 (Fig. 3, middle panel). These narrow profiles are consistent with low expansion velocities of 5-7 km s-1, adopting a Gaussian-like profile and assuming isotropic mass-loss in these inner-wind regions. (In case of a non-spherical mass distribution, for example if there is an equatorial density enhancement resulting in a torus or disk-like dominant emission component, the expansion velocity could be larger after taking into account line-of-sight projection effects).
The size and expansion velocity measured imply that the SiS =1, 30SiO =1, and Na37Cl emission lines sample wind layers that have been ejected within the last 50 yr. The lines’ centroid (=35 km s-1) then represent the systemic velocity of the mass-losing star (QX Pup) averaged during the last 50 years.
The profile of the 30SiO (=1, =7-6) transition reported here is remarkably different from that of any of the known SiO maser lines detected in OH 231.8, which are characterized by two or three isolated 2-3 kms-wide, intense (1-10 Jy) emission peaks (e.g., Sánchez Contreras et al., 2002a; Dodson et al., 2018). The different broader profile and the weakness of the 30SiO (=1, =7-6) line, with a peak intensity of only 17 mJy, points to thermal (i.e., non-maser) emission in this case.
4.2 A compact bipolar outflow emerging from clump S
In addition to disclosing the locus of QX Pup (inside clump S), our ALMA data have also uncovered the existence of a compact (1″4″) bipolar outflow that is emerging from the stellar vicinity. This outflow is exclusively traced in our data by the SiO molecule, which is a well-known shock tracer.
Our SiO (=7-6) and 29SiO (=8-7) velocity-channel maps (Figs. 4 and 5) show very similar brightness distributions, both transitions displaying a notable bipolar morphology with two flame-shaped lobes at either side of clump S. The SiO lobes are oriented along PA16°-18°, that is, similarly but not totally equal to the large-scale CO outflow. The emission is centered at 35 km s-1, with most of the blue-shifted (down to =18 km s-1) and red-shifted (up to =53 km s-1) emission coming from the north and south SiO lobe, respectively. This is consistent with a dominant expansive kinematics centered at clump S.
The flame-shaped SiO lobes have a relative surface brightness dip at their respective centers suggestive of a dense-walled structure (this is best seen in the north lobe in the 29-30 km s-1-channel maps of 29SiO (=8-7), Fig. 5). Our SiO (=7-6) maps show a pinched-waist emission distribution that is also hinted, but is less apparent, in the maps of the 29SiO (=8-7) line. From the maps of both transitions, SiO and 29SiO, we derive a similar size for the pinched-waist, which has a deconvolved half-intensity diameter of 018270 AU (as measured in the =35 km s-1-channel map).
Unlike the large-scale CO outflow, the SiO emission distribution is rather (but not perfectly) symmetric about the nebular axis and the equator. An S-shape distribution is hinted, with both the east side of the north lobe and the west side of the south lobe being moderately brighter than its mirror image about the symmetry axis of the nebula. Along the nebula axis, the SiO outflow reaches out to distances of 182700 AU from the center, with the north lobe being slightly brighter at the tips. The dimensions of the outflow deduced from the maps of the weaker, optically thinner 29SiO (=8-7) transition are moderately smaller along the nebula axis as a result of the lower signal-to-noise ratio of these maps.
The surface brightness distribution of SiO and 29SiO peaks at two diametrically opposed compact regions located at offsets y011 along the nebula axis (hereafter, referred to as SiO knots). This is most clearly seen in the position-velocity (PV) diagrams along the major axis of the bipolar outflow (Fig. 4 and 5, bottom panels). The distribution of the SiO emission increases abruptly from the center (offset 0″, 35 km s-1) to the bright SiO knots, where the full width at zero-level intensity (FWZI) of the emission reaches a maximum value of 23 km s-1.
This feature in the axial-PV diagram (i.e., abrupt velocity rise from the center to a compact region with the largest velocity-spread) is a well-known signature of bow-shocks. The latter are produced, for example, when a collimated fast wind or bullet collides with dense ambient material (e.g., Hartigan et al., 1987; Lee and Sahai, 2003; Balick et al., 2013) and have been observed before in other pPNe, for example, in the molecular outflow of IRAS 22026+5306 (Sahai et al., 2006), in the ionized central regions of M 1-92 (Dennis et al., 2008), and in the compact, shock-excited axial blobs or knots of Hen 3-1475 (e.g., Riera et al., 2006, and references therein). Analytical bow-shock models (Hartigan et al., 1987) as well as numerical computations (e.g., Dennis et al., 2008) show that the FWZI of the emission profile produced by a radiating bow-shock equals the shock velocity, ; this would imply that 23 km s-1 for both the north and south bright SiO knots of OH 231.8. Using the simple analytic formula derived by Hartigan et al. (1987), which relates the centroid of the bow-shock profile (29.5 and 41 km s-1 at y=+011 and y=011, respectively) with the shock-velocity, we deduce that the bow-shocks are viewed at an angle 30° with respect to the plane of the sky, again similar but not the same as the large-scale outflow.
The axial PV diagram of SiO and 29SiO is somewhat structured and it is not possible to derive a unique velocity gradient from the center to the tips of the SiO lobes. The large velocities observed in the very inner regions of the outflow, near the SiO knots, are consistent with a large axial velocity gradient ranging between 85 and 50 km s-1 arcsec-1 (black dashed lines in Figs. 4 and 5). This gradient implies short kinematical ages of [84-142] years, that is, 50-80 yr adopting =30° (or 60-100 yr, adopting the commonly used value of the inclination for the large-scale CO outflow, =35°).
The lower velocities at the intermediate-to-outer regions of the flame-shaped SiO lobes imply larger kinematic ages of 690 yr (about 400-500 yr, for =30-35°) and larger at the lobe tips. In these regions, however, the interpretation of the gradient is not straightforward since it probably involves outflow deceleration from swept-up ambient material.
4.3 The periphery of the SiO outflow
The close environments of the SiO outflow are remarkably disrupted. For example, this is clearly noticed in the 13CO (3-2) and CS (6-5) velocity-channel maps, and their respective axial PV diagrams, in regions within 2″ from the center (Figs. 6 and 20). These data show a surface brightness dip or minimum in the regions and LSR velocities where the SiO outflow is prominent. This suggests that the SiO outflow (perhaps jointly with an underlying powering wind not directly seen in these data) is carving out the ambient material as it propagates outwards.
Since the expansion center of the SiO outflow (near clump S) is located about 06 to the south of the waist’s center, the north SiO lobe is mainly colliding with, and piercing through, the slowly expanding equatorial waist (see =[29:38] km s-1-channel maps in Fig. 6) whereas the south SiO lobe is colliding with the, presumably less dense, ambient material residing mainly in the base of the south large-scale lobe (and also partially in the south part of the waist).
In agreement with this wind-collision scenario, we identify a small-scale hourglass-shaped structure adjacent to the SiO outflow in the ALMA maps of most molecules. This structure, dubbed as the mini-hourglass (or mini-hg), is nested inside the dense central regions of the large-scale nebula and is clearly recognized, for example, in the axial PV diagrams shown in Figs. 6-7. The mini-hg, and the two polar cavities inside, are also directly visible in the velocity-channel maps of most transitions near the systemic velocity, =35 km s-1 (Fig. 7, top-panel). We believe the walls of this hourglass-shaped structure are mainly made of compressed material formed as the SiO outflow propagates throughout the dense, central regions of the nebula.
The south lobe of the mini-hourglass, or south mini-lobe, can be traced (and is relatively well isolated from other nebular components) along the nebula axis down to y1″ spanning the range of velocities =30-52 km s-1. The south mini-lobe follows a velocity gradient similar to that of the outer regions of the south flame-shaped SiO lobe (dotted line in the axial PV diagrams of Fig. 6 and 20). This suggests a similar age for both the extended flame-shaped SiO lobes and the mini-lobes (690 yr) or a similar dynamics. The north mini-lobe is not so neatly delineated in our maps. Yet, we clearly identify its central cavity (in the range =29-38 km s-1) surrounded by very bright emission from the dense ambient material into which the SiO outflow is plowing. The velocity gradient observed in the north mini-lobe is lower than in the south, as is also the case for the flamed-shaped lobes sampled by SiO and 29SiO emission. This is consistent with a larger resistance to the SiO outflow propagation toward the north (offered by the ambient material in the dense large waist) than toward the south, where the SiO outflow plunges into a presumably less dense ambient medium.
The equatorial waist of the compact mini-hourglass (referred to as the mini-waist) is partially resolved in our ALMA maps and is best isolated in the OCS (25-24) emission maps (Fig.7), where we measure a full extent (at a 2 level) of 03507, with the long axis oriented along PA21+90°. This is consistent with a torus or disk-like structure with an outer radius of about 500 AU whose symmetry axis is viewed at an inclination angle of 30°, that is, orthogonal to the SiO outflow (§ 4.2).
The axial PV diagrams in Fig. 7 show that south/north emission from the mini-waist (within 018) is blue-/red-shifted, that is, the velocity gradient has opposite sign to that observed along the mini-lobes, which is indicative of equatorial expansion. The expansion velocity of the mini-waist is notably low and is not constant across the waist: it increases linearly from the inner to the outer regions (with values as low as —-35—1 km s-1 at the center and reaching —-35—5 km s-1 at the edges). The gradient observed, 20-30 km s-1 arcsec-1, leads to a kinematical age for the equatorial mini-waist of [360-240]/ years. Assuming that the lobes and the waist of the mini-hourglass of OH 231.8 have the same kinematic age, as expected if both structures resulted from the same physical process (e.g., a sudden mass-loss ejection or mass-acceleration event), then we derive a value of the inclination of 30°-35° and a kinematical age of about 500 yr for these components.
– The CH3OH-outflow. We have detected two transitions from methanol at 304.2 and 307.2 GHz (see Table 3 and Fig. 8). Their brightness distributions exhibit a clear bipolar morphology. The dimensions of the region where most of the CH3OH emission is produced are similar to that of the compact SiO outflow. Weaker CH3OH-emission components are also detected at larger distances from the center, up to 3-4″ along the nebula axis. The methanol emission profile is sharply peaked near 2, 29, 44 and 71 km s-1, with extremely weak (undetected) emission at intermediate velocities.
The axial PV diagrams of the CH3OH and 13CO (=3-2) lines are plotted together in the bottom panels of Fig. 8. In these diagrams, it is easy to see that the CH3OH emission closely follows the spatio-kinematics of the mini-hourglass, neighboring the SiO outflow. The CH3OH emission is rather patchy, with the brightest emission arising in the front side of the north mini-lobe (at 29 km s-1) and close to its tip.
4.4 The large-scale nebula
4.4.1 The hourglass-shaped structure
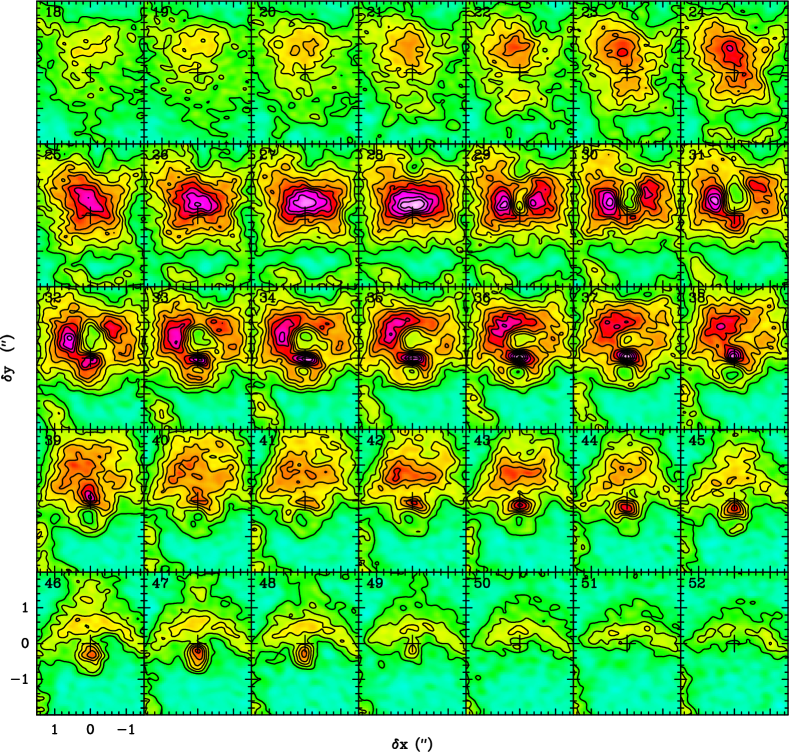
The 8″4″-sized hourglass nebula traced by the dust thermal continuum emission maps (§ 3 and Fig. 1) is the dominant emission component of most of the species mapped in this work. In Fig. 9 we present the velocity-channel maps of CS (7-6), one of the dense gas tracers observed by us with ALMA, where this component is clearly seen in the =[10:+80]km s-1 range. (See also the 13CO (=3-2) and CS (6-5) maps already introduced showing the 4″4″ central regions of the hourglass, Fig. 6 and Fig. 20).
The large-scale hourglass nebula (or large hg) encompasses the equatorial waist and the base of the bipolar lobes known from previous works777The large-scale hourglass nebula roughly corresponds to clumps I2-to-I4 as originally defined and labeled by Alcolea et al., 2001.. The unprecedented angular resolution of our ALMA maps shows that the bipolar lobes, at their base, are essentially large cavities (of 3″ in width) surrounded by 05-wide walls with a nearly parabolic morphology. Our maps reveal a highly structured and non-uniform surface brightness distribution in the lobe walls and in the equatorial waist. As in the continuum maps, the east side of the large hg is much brighter than the west side.
The spatio-kinematic distribution of the large hg confirms an overall radial expansion with a linear velocity gradient along the nebula long axis (PA=21°) of 6.0-6.5 km s-1 arcsec-1 (Fig. 9); the same gradient is preserved along the more distant, fastest regions of the large-scale lobes (§ 4.4.2). This value of the gradient is consistent (within uncertainties) with that reported from previous studies (§ 1).
Although the large equatorial waist is well resolved spatially and spectrally in our ALMA data, an accurate description of its morphology, dimensions, and kinematics is difficult. This is because the nebular equator is remarkably disrupted by the interaction with the SiO outflow, which has plowed into it from the south, and also because the waist is the region from where the highly-structured bipolar lobes emerge, and therefore the emission from different nebular structures and substructures, with complex kinematics, overlap. With these limitations in mind, the large-scale equatorial waist can be roughly described as an expanding cylindrical structure orthogonal to the bipolar lobes.
The centroid of the waist is located at offset (005, 06). The 13CO (=3-2) PV cut along PA=21+90° (the equator) passing through the waist center is shown Fig. 10. The 13CO (=3-2) line and the rest of transitions that sample the waist consistently point to a systemic velocity of 32-33 km s-1, i.e., slightly different from that of clump S (35 km s-1). The outer radius of the waist is 18 at a 2-level in the 13CO (=3-2) maps (and slightly smaller, 14, in the maps of other less abundant molecules, e.g. CS). The waist extends about 06 about its equator, but this is uncertain because there is not a sharp boundary separating the waist from the base of the lobes (probably, both are part of a unique hourglass-shaped structure). We identify a small cavity, of radius 02-025, at the center of the waist. From here, the emission increases quite sharply with the radius, reaching a peak at about 06-07 and fading gradually at larger distances.
Toward the center of the waist, the radial velocity increases from —-—3 km s-1 at the inner edge (immediately beyond the cavity) to about —-—25 km s-1 at the outermost regions (Fig. 10). The waist layers at 065 where the 13CO (=3-2) emission peaks, are characterized by a radial velocity of —-—6-7 km s-1. Adopting a cylindrical shape for the waist with its revolution axis inclined with respect to the sky-plane by =35°, this implies a deprojected velocity gradient of about 108.2 km s-1 arcsec-1, leading to a kinematical age of 715 yr/870 yr, similar to that of the large-scale outflow.
Selective tracers of the waist. The emission from certain molecular lines, namely, OCS (=25-24), H3O+ (=1 - 2), and SO2 (116,6-125,7), is largely restricted to the 2″1″ central parts of the large hg (Fig. 11). Emission from OCS is observed over a relatively narrow velocity range (=[18:42] km s-1) tracing selectively the equatorial of the large hg and, also, of the compact mini-hg nested inside (see also Figs. 7 and 21). This is probably because the relatively high-excitation requirements of this transition (Eu190 K) are not attained at large distances along the fast lobes, which are predominantly cold (§ 5.1). The SO2 emission maps resemble those of OCS, which is probably explained by the similar upper-level energy of both transitions (Table 3). The surface brightness distribution of H3O+ is slightly more extended, rounded, and uniform than that of OCS and SO2. This is consistent with this ion being mainly a product of the photodissociation chain of H2O and CO by the interstellar UV radiation in the outer layers of the envelope (Sánchez Contreras et al., 2015). As OCS, the H3O+ and SO2 transitions have also some contribution to the emission produced in the mini-waist.
4.4.2 The high-velocity bipolar lobes
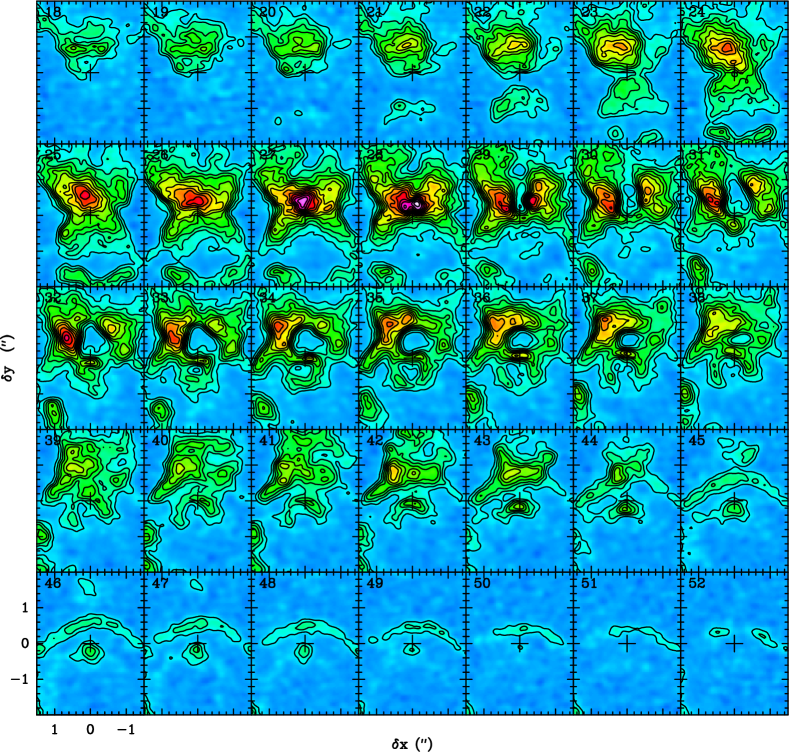
The high-velocity (HV) bipolar lobes are, after the large hg, the second major component of the molecular outflow of OH 231.8 (§ 1). In our ALMA maps, the 12CO (3-2) emission from the north and south lobe reaches out to radial distances of 17″ and 30″, respectively, along the PA21° axis (Fig. 12). The lobes are also traced by a number of molecules other than 12CO (Table 4). These species, with emission lines substantially fainter than 12CO (=3-2), trace only certain parts of the lobes (normally, the CO-brightest regions).
The HV bipolar lobes are highly structured, and a number of nested, often incomplete, substructures appear to be present; some of these are counterparts of major features identified in the optical and near-IR images of OH 231.8 (skirt, spine, fingers, filaments, etc – see Bujarrabal et al., 2002; Meakin et al., 2003; Balick et al., 2017). All these substructures are characterized by a dominant expansive kinematics described by a radial velocity gradient, 6.0-6.5 km s-1 arcsec-1, that is sustained from the base (i.e., low-latitude regions of the large hg) to the tips of the lobes where the highest los-velocities are observed, (—-—125 and 200 km s-1 for the north and south lobes, respectively – Fig. 13). The kinematic age of the HV-bipolar lobes implied by this velocity gradient is 1150, that is, 800 yr for =35°.
4.5 NEW macro-structures unveiled by ALMA: the fish bowls
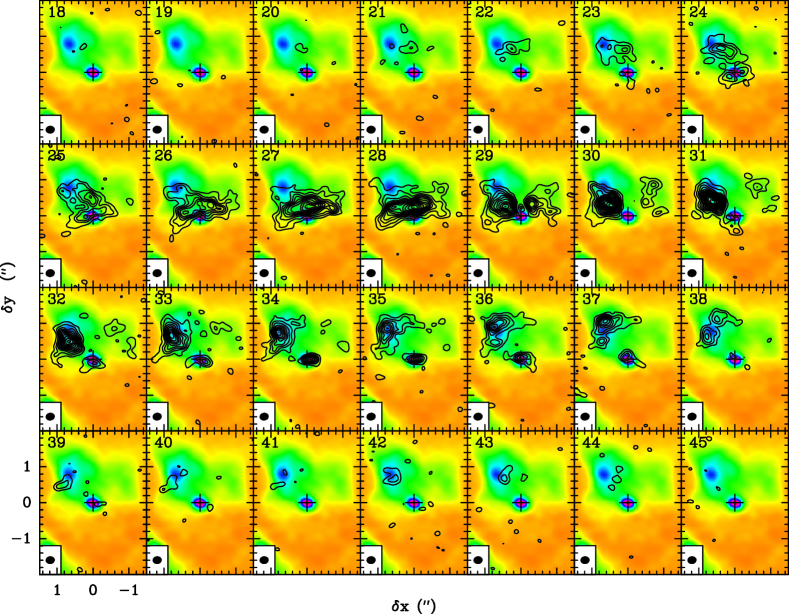
The unprecedented sensitivity of the ALMA maps reported here has enabled us to detect for the first time the molecular counterpart of the two faint, rounded structures seen in the /NIR images toward the central regions of OH 231.84.2 (Fig. 12). Curiously, no previous published studies of these dusty structures exist to date (to our knowledge). These components are best identified in the 12CO (=3-2) velocity-channel maps shown in Fig. 14 where they appear as elliptical, ring-like emission features around the bright central regions of the nebula. We refer to these structures as the fish bowls.
The northern fish bowl () can be relatively well isolated from other (lobe and waist) line-emitting regions in the velocity range =[13:+59] km s-1. It comes into sight as a compact elongated emission feature at offset (06, 075) in the =13 km s-1 channel. As increases, this feature progressively grows and develops an elliptical ring-like morphology that reaches a maximum size of 8″6″ (with the long axis oriented along PA125°) in channels near the centroid of the -emission profile, 23-26 km s-1. As continues increasing, the ring-shaped emitting region steadily shrinks and dims, turning into a faint compact emission clump, located at offset (02, 36), in channel 59 km s-1. The ring-like feature appears clearly incomplete in several central channels, in particular, a vast part of the northern rim emission is missing at 41 km s-1.
The southern fish bowl () comes out as a faint and compact elongated emission region at =+77 km s-1 (at offset 08, 14) that progressively becomes larger, brighter, and acquires a ring-like morphology as the velocity decreases. This feature reaches maximum dimensions of 8″6″ (with the long axis oriented along PA100°) in channels around =47 km s-1. As the velocity continues decreasing, the size of the ring-like emission feature reduces. The -emission can be discerned down to =17 km s-1, but only from the west side. At lower LSR velocities, the line-wing emission from the (expected to be faint and compact, if any) cannot be isolated or disentangled from the intense emission produced in the south lobe near its base. As its northern analog, the appears incomplete or broken, particularly, its the southern rim.
The simplest configuration that is consistent with the observed spatio-kinematic distribution of the 12CO (=3-2) emission from the fish bowls is a pair of hollow, thin-walled ellipsoids radially expanding. The projection of the outer surface of these ellipsoids in the plane of the sky is represented by the ellipses overplotted on the 12CO (=3-2) integrated intensity maps (Figure 14, bottom panels).
A three-dimensional view of a generic ellipsoid, with semi-major axes , , and , is given in Fig. 15 (left) as well as a cut of it through the -plane, which contains the los (Fig. 15, middle). As we will see below, the sizes of and can be constrained from the observations, however, is uncertain since this axis can be tilted with respect to the los by a given (unknown) inclination angle (Fig. 15, right).
For radial expansion, the velocity-channel maps (Figure 14) offer a sliced view of the emitting volume intersected by different planes perpendicular to the los. Therefore, the channels near the systemic velocity (23-26 and 47 km s-1 for the and , respectively) represent the cross-sectional cut of the ellipsoids through their expansion center. This is indeed consistent with the fact that the largest ring-like emitting areas are observed near and enable us to estimate 41 (for both fish bowls). The -axis is oriented along PA=35°+90° and PA=10°+90° for the and , respectively. esto es suponiendo que el eje b–¿ este contenido en el del cielo. Sabemos que esto es asi de hecho porque la conecta los appr. and receding extremes esta orientada el eje menor de la elipse grande. si el eje b tuviese angulo resp. al plano del cielo, medido hacia la lineas no coincidirian! as well as an upper limit 3″.
The channels at the most extreme radial velocities (——35 and 30 km s-1 for the and , respectively) sample the gas that is moving directly toward or away from us. The gas in these regions, referred to as approaching/blue (B) and receding/red (R) extremes, are expected to be near the vertex (or endpoint) of the ellipsoids along the -axis, which is consistent with the compact emission observed in these velocity-channels (small ellipses in Figure 14). The sky-plane projection of the -axis then runs through the imaginary line that joins the receding and approaching extremes (). Because has the same orientation as the minor () axis of the big ellipse (for both fish bowls), the -axis must lie in the plane of the sky (or very close to it).
We measure a linear velocity gradient between the approaching and receding extremes, which are separated by 3″ in both cases. In the , the radial velocity difference between R and B, 70 km s-1, results in a velocity gradient along along the PA=35° axis of 23 km s-1 arcsec-1, where is the line-of-sight inclination of the line of the . In the , the full width of the emission profile is slightly smaller, 60 km s-1, which leads to 20 km s-1 arcsec-1 along PA=10°. In the case of the , the value of the gradient is rather uncertain since both FWZI and are poorly determined due to contamination of the CO blue-wing by intense emission from other regions of the nebula that overlap along the los.
As already mentioned, it is not possible to obtain an accurate estimate of and because is unknown (we note that, in general, , as can be seen in Fig. 15-middle). An upper limit to 3″ is given by the size of the minor axis of the big ellipses, which represents the sky-projection of the outer surface of the ellipsoids. However, and are strongly degenerate: although a lower limit to 3″ is deduced from the distance between R and B, values of almost as large as desired are possible if approaches 0° (i.e., pole on view). Possible combinations of and consistent with our observables (i.e., the sky-projected dimensions of the ellipsoids and 3″ in the CO maps) are shown in Fig. 15 (right). As we discuss in § 6.3, assuming that the fish bowls are nearly orthogonal to the large-scale outflow (40°), the size of would be similar to (solid lines in Fig. 15-right) and, thus, the fish bowls would simply approach oblate spheroids.
5 Analysis
5.1 Density and temperature distribution
We have used the ALMA maps of the CS (7-6) and CS (6-5) transitions to derive the physical conditions within the 4″12″ central regions of OH 231.84.2’s molecular outflow, where the prevailing structure is the so-called large-hourglass component (§ 4.4.1). This is also where most of the emission from CS arises and where the ALMA maps of the two lines overlap and, thus, their surface brightness distributions can be compared.
We have used the classical population (or rotational) diagram analysis technique to derive the CS column density () and the rotational temperature () distribution in these regions and at different velocity channels. This method is described in detail and discussed extensively by, e.g., Goldsmith and Langer (1999) and it has been successfully used in the analysis of the mm-wavelength line survey of OH 231.8 (Sánchez Contreras et al., 2015; Velilla Prieto et al., 2015) and the molecular emission from the envelopes of many other evolved stars (normally studied by means of single-dish observations; e.g., Justtanont et al., 2000; Wesson et al., 2010; Quintana-Lacaci et al., 2016; Velilla Prieto et al., 2017). In the rotational diagram analysis technique, the natural logarithm of the column density per statistical weight (Nu/gu) is plotted against the energy of the upper level above the ground state (Eu) for a number of (at least two) transitions of the same molecule. Assuming that the lines are optically thin and thermalized, that is, that all levels are under local thermodynamic equilibrium (LTE) conditions at a given unique temperature, Nu/gu and Eu are related by the following formula:
| (3) |
where is the Boltzmann constant, Wul is the source brightness temperature integrated over the channel velocity-width, and Sul are the frequency and line strength of the transition, respectively, is the appropriate component of the permanent dipole moment of the molecule, Z() its partition function, and and refer to the upper and lower levels involved in the transitions. According to Eq. 3, for a given molecule a straight-line fit to the points in the population diagram provides /Z() from the -axis intercept and from the slope of the fit.
The surface brightness distribution of the CS (7-6) and CS (6-5) emission lines integrated over the velocity width of each channel (W76 and W65) are transformed to and velocity-channel maps, respectively, using the conversion factors in Eq. 3 and after matching the dimensions and beam size of both maps to a common value of 031025 (corresponding to the largest HPBW of the two, the CS (7-6) maps). The required spectroscopic parameters and partition function have been obtained from the MADEX catalog (Cernicharo, 2012). Then, a straight-line has been fitted pixel by pixel to the and velocity-channel maps in order to create the corresponding cubes of and (Fig. 16).
Our velocity-channel maps of confirm the overall low temperatures of the molecular envelope of OH 231.8 inferred from previous works (§ 1). We find values of 10-30 K in the lobe walls and moderately larger temperatures, 40-60 K, in most regions of the equatorial waist. There is a trend for the innermost waist regions to show the largest temperatures, with maximum values of 70-150 K (around =[26:41] km s-1 in Fig. 16-top).
The CS column density in the lobe walls and outermost regions of the waist are in the range 3-2 cm-2, increasing toward the central parts up to 5 cm-2 (Fig. 16-bottom). Considering both the column density and temperature profiles derived from the CS emission maps, we deduce moderate optical depths (at the center of our =3km s-1-wide channels) for both transitions, with opacity values of 0.05-0.8 across most regions of the nebula; optical depths close to 1 are only expected at the dense and warm clump near the center that emits at 26-29 km s-1.
The column densities and rotational temperatures derived from our ALMA data are in good agreement with the source-averaged values obtained from a similar rotational diagram analysis using multiple transitions of CS covering a much broader range of levels (up to Eu400 K) observed with the IRAM-30 m and Herschel single-dish telescopes (Velilla Prieto et al., private communication). The rotational diagram analysis technique has been used not only for CS but for a large number of molecules present in OH 231.8 and is known to describe remarkably well the envelope-averaged level populations, which closely follow a straight line in that ln(Nu/gu)-vs-Eu representation for the majority of the species (Velilla Prieto et al., 2015; Sánchez Contreras et al., 2015). For some molecules (including CS and a few others) the rotational diagram analysis of single-dish data reveals two major temperature components, one cold (15-50 K) and one warm (100-200 K), which is consistent with the temperature distribution found in this work.
Using the CS column density maps, we have generated a total (H2) number density cube taking into account the linear scale of the pixel at a distance of =1500 pc, the overall velocity gradient of the outflow, and making the simplifying assumption that the CS-to-H2 fractional abundance is constant throughout the outflow, for which we adopt a source-averaged value of X(CS)=5 (Sánchez Contreras et al., 1997, Velilla Prieto et al. in preparation). As shown in Fig. 17, we find rather high densities inside the lobe walls ([2-4] cm-3) and even higher (up to 106 cm-3) in regions of the waist closer to the nebula center.
Given the critical densities of the CS transitions used in this work, [2-5] cm-3 (for a 10-100 K temperature range, Shirley, 2015), some deviations from the LTE level population may exist, particularly in the inner and outer edges of the lobe walls. In these regions, the rotational temperature derived from our analysis may then represent a lower limit to the gas kinetic temperature. The discrepancy between and , however, must be small because the majority of the molecules detected in OH 231.84.2, including CO (with much smaller values of ), consistently point to very similar rotational temperatures of 20-40 K in the lobes (Sánchez Contreras et al., 2015; Velilla Prieto et al., 2015; Alcolea et al., 2001; Claude et al., 2000; Sánchez Contreras et al., 1997; Omont et al., 1993; Morris et al., 1987). Moreover, under non-LTE conditions, the CS column densities derived from the rotational diagram analysis (assuming LTE conditions) would be slightly underestimated, which would then imply that true H2 densities in the lobes are larger than our estimates, alleviating the expected LTE departures. We note that LTE deviations are confirmed to be small or modest in most regions of OH 231.84.2’s molecular outflow for other species, including dense gas tracers, based on detailed molecular excitation calculations (Velilla Prieto et al., 2015; Sánchez Contreras et al., 2015).
5.2 Molecular abundance of new species
5.2.1 Refractory molecules in clump S
We report the first detection of Na37Cl toward the mass-losing star QX Pup. The first identification of Na35Cl (= NaCl) in O-rich evolved stars was made by Milam et al. (2007) toward the red supergiant VY CMa and the AGB star IK Tau. Previously, NaCl had been detected in the circumstellar envelopes of two C-rich stars, the AGB star IRC+10216 (Cernicharo and Guelin, 1987) and the pPN CRL 2688 (Highberger et al., 2003). The compact distribution of the Na37Cl (=0, =26-25) emission in OH 231.84.2, which is found to be confined within the a central region (clump S) of half-intensity radius of 60 AU (§ 4.1), is expected. This is because Na37Cl, as well as other refractory molecules such as SiS and SiO, are thought to be formed close to the photosphere and then to condense onto dust grains as the envelope material flows from the central star (Glassgold, 1996). A similar inner-envelope distribution, within 50, is found for NaCl in VY CMa and IK Tau (Milam et al., 2007; Decin et al., 2016).
We have obtained an order of magnitude estimate of the column density and fractional abundance of Na37Cl in the inner layers of QX Pup’s wind (clump S) under some simplifying assumptions. We have used the CLASS888http://www.iram.fr/IRAMFR/GILDAS. task MODSOURCE to model the observed Na37Cl (=0, =26-25) emission profile assuming LTE and taking as input model parameters the column density, kinetic temperature, source size and the line width. The source angular diameter and the line width are constrained by the observations to 008 and FWHM8 km s-1, respectively (§ 4.1). We have considered a relatively broad range of probable values for the excitation temperature between 100 and 1000 K in the inner layers where the emission is produced (e.g., Milam et al., 2007, and references therein). Adopting these temperatures, the column densities of Na37Cl needed to reproduce the observed Na37Cl (=0, =26-25) profile are between 2 and 5 cm-2, comparable to the column densities of NaCl found in VY CMa and IK Tau (Milam et al., 2007). While our crude estimate has large errorbars, this agreement suggests that our order-of-magnitude value is roughly correct, since the 35Cl/37Cl isotope ratio is known to be low, about two, in intermediate-mass AGB stars (e.g., Maas et al., 2016; Highberger et al., 2003, and references therein).
The Na37Cl fractional abundance (relative to H2) in clump S can be estimated if the current mass-loss rate () and expansion velocity () of QX Pup’s wind is known. Adopting constant values of 10-5 yr-1 and =7 km s-1 for the present-day wind (see § 1), the column density in a spherical shell with inner and outer radius of 6 AU and 60 AU is 2 cm-2. For , we have adopted the characteristic radius of the SiO masing region in OH 231.84.2, which corresponds to the dense 109-1010 cm-3 layers of the extended atmosphere of QX Pup at 2-3 (Sánchez Contreras et al., 2002a) where molecules such as SiO, SiS, and NaCl are expected to form abundantly. Considering the approximate value of obtained above, we deduce a Na37Cl fractional abundance of about [1-3]. Given the low 35Cl/37Cl2 ratio expected, we estimate X(NaCl)[2-6], which, in spite of the large errorbars (easily of a factor 3), is again in very good agreement with the fractional abundance of salt measured in VY CMa and IK Tau (Milam et al., 2007).
Applying the same modeling procedure and assumptions, we estimate the abundance of SiS and SiO in clump S using the SiS =1 and 30SiO =1 thermal line profiles observed (§ 4.1). In this case, the range of probable excitation temperatures explored is 500-1500 K, given the higher-excitation requirements of these vibrationally excited transitions (Eu1200-1800 K) compared to the Na37Cl =0 line (Eu=214 K). We deduce SiS and 30SiO column densities of [4-6] cm-2 and [1-3] cm-2, respectively, resulting in fractional abundances of X(SiS)[2-3] and X(30SiO)[0.5-1.5]. For a 28Si/30Si isotopic ratio of 20-30 (roughly consistent with the solar value, 29), as measured for some O-rich AGB stars (e.g. IK Tau, Velilla Prieto et al., 2015, and references therein) including OH 231.8 (Velilla Prieto et al., in preparation), we deduce a fractional abundance of SiO in clump S of X(SiO)[1-5]. Our estimates of X(SiS) and X(SiO,30SiO) are in good agreement with measurements and theoretical expectations in the inner-envelope regions of M-type AGB stars (e.g., Schöier et al., 2007; González Delgado et al., 2003; Decin et al., 2010; Gobrecht et al., 2016). Finally, even considering the large uncertainties of our estimates, our results indicate that SiO is clearly more abundant (by 2 orders of magnitude) in clump S than at large distances from the star in the fast bipolar lobes, where a fractional abundance of 10-8 is calculated from previous molecular studies using SiO =0 transitions (Sánchez Contreras et al., 1997; Morris et al., 1987). Our value of the SiO abundance in clump S as well as the inferred depletion factor at large distances is also in good agreement with recent measurements of X(SiO) in the inner wind of Cet (Mira) by Wong et al. (2016). Using long-baseline ALMA observations, these authors find that the SiO abundance drops significantly from 1 to 1-1 at a radius of about 1 cm 5 .
5.2.2 Methanol
The detection of CH3OH in evolved stars has remained elusive until very recently. Indeed, OH 231.8 is the first CSE of an AGB star in which gas-phase methanol has been identified, after the recent discovery of this molecule with ALMA in the post-AGB object HD 101584 (Olofsson et al., 2017). Only one year before, methanol was detected in the yellow hypergiant IRC+10420 (Quintana-Lacaci et al., 2016), although this is a different class of object descending from a much more massive star (50 ) than QX Pup and HD 101584.
In the post-AGB object HD 101584, methanol was found to come exclusively from two extreme velocity spots (at about =140 km s-1) on either side of the object where a HV outflow interacts with the surrounding medium. In a similar way, the methanol emission in OH 231.8 arises solely from the bipolar outflow, predominantly from the periphery of the compact bipolar outflow traced by SiO and, to a lower extent, from more distant regions along the large-scale lobes (at offsets y=1″ and y=3″, Fig. 8). The main difference with respect to HD 101584 is that the outflow expansion velocities (projected along the line-of-sight) where CH3OH is detected are significantly lower in OH 231.8 (6 and 35 km s-1 at y=1″ and 3″, respectively, see § 4.2).
As we did for refractory species (§ 5.2.1), we have obtained an order-of-magnitude estimate of the column density and fractional abundance of CH3OH in the regions of the compact bipolar outflow of OH 231.8 where this molecule is detected. The structure and physical conditions in the emitting volume are crudely constrained from the observations and, therefore, we need to make some simplifying assumptions. As seen in Fig. 8, most of the CH3OH emission (within 26-47 km s-1) comes from two 1″1″-sized regions centered at about y1″ from QX Pup. Accordingly, we adopt a size for the whole emitting area (projected in the sky-plane) of 2 arcsec2 and a representative half-intensity line width of 20-25 km s-1 as input values of our simple LTE (CLASS/MODSOURCE) model. We have considered a rather broad range of probable excitation temperatures of 50-200 K, which includes (but also goes beyond) the excitation temperature span in these CH3OH-emitting y1″ regions (as deduced in § 5.1 – see Fig. 16). For the previous model parameters, we find that the two CH3OH lines observed (at 304 and 307 GHz) imply column densities of about [1-8] cm-2. The model reproduces the relative intensities of both transitions (of comparable strength in our ALMA data) and is consistent with these and most CH3OH transitions being below (but, in some cases, close to) the detection limit of our 79-350 GHz spectral survey of OH 231.8 with the IRAM-30 m antenna (Velilla Prieto et al., in preparation).
To compute the total (H2) column density across the CH3OH-emitting region, which is needed to estimate the fractional abundance of methanol, we make the assumption that this is roughly represented by two spherical homogeneous clumps of diameter 1″ (2 cm). These regions are characterized by densities of [3-4] cm-3 (§ 16 – see Fig. 17, channels 29 and 44 km s-1) and, therefore, the column density is approximately [6-8] cm-2. This implies a fractional abundance of methanol of the order of X(CH3OH)10-8-10-7. This value, while it is expected to have large errorbars, is intermediate to the methanol fractional abundance found in the post-AGB object HD 101584 (3, Olofsson et al., 2017) and in the yellow hypergiant IRC+10420 (7, Quintana-Lacaci et al., 2016).
As in the post-AGB object HD101584, the detection of gas-phase methanol in OH 231.8 in regions that have been (or are currently being) shocked, suggest that this molecule has been extracted from the icy mantles of dust gains after the passage of shocks. As shown by Guillet et al. (2009), dust destruction in slow shocks (50 km s-1) is expected to be significant (at the level of a few percent)999Grain destruction can be produced in various forms, vaporizing grain-grain collisions being a dominant form for slow shocks. and can return to the gas phase in a similar proportion molecular species that reside in their mantles (like CH3OH) but also molecules situated in deeper layers (like SiO).
6 Discussion
6.1 The position of QX Pup relative to the large waist
One of the most puzzling discoveries from our ALMA data is the spatial offset between some of the nebular components identified in this work. In particular, the mass-losing star (QX Pup), which is enshrouded by dust and gas inside clump S, is clearly offset from the waist of the large hourglass by y06 (900 AU) along the axis toward the south lobe. The systemic velocity of these two components is also different: 35 and 32-33 km s-1 for clump S and the large waist, respectively. Here, we examine two scenarios that could possibly cause the offset and difference, although regrettably neither is fully satisfactory.
) In principle, this offset could reflect the motion of the star along its orbit 800-870 yr ago, when it ejected the bulk of the CO outflow (§ 4.4.1 and 4.4.2). This effect has indeed been observed in the young PN M 2-9, where two coaxial, slightly off-centered CO-rings, with systemic velocities differing by 0.6 km s-1, were formed during two brief mass-loss episodes that occurred at different points along the orbit of the primary post-AGB star (Castro-Carrizo et al., 2012, 2017).
In the case of OH 231.8, the offset observed would imply a transversal (or sky-plane projected) velocity of 5 km s-1 and, thus, an orbital velocity of =/=8.7 km s-1 at the time of the massive ejection (adopting 35°). Under the orbital-motion scenario, one would then expect to measure a difference in the systemic velocities of the large waist and clump S of ==7 km s-1, which is significantly larger than the difference found, of only 2-3 km s-1. This small -difference would be consistent with the orbital-motion hypothesis if the los-inclination of the binary orbit is 63°. While not impossible, such an inclination is improbable given that bipolar outflows in pPNe are nearly orthogonal to the binary orbital plane according to most current jet-launching theories.
A secondary criticism to the orbital-motion hypothesis is that it would require the bulk of the mass to have been ejected when the stars were near quadrature (within about 5°) to explain the very small offset of QX Pup along the equatorial direction relative to the center of the large waist (x005, § 4.4.1). We stress that this is assuming (for simplicity) a circular orbit.
) Alternatively, QX Pup could be a runaway star that has been flung from the core after the strong asymmetrical mass ejection that led to the north and south lobes of the large-scale CO outflow. As shown by Alcolea et al. (2001), the linear momentum carried by the north lobe is larger than that carried by the south lobe by about 2.3 km s-1 (with an uncertainty factor of 2-3). Assuming that the ejection was inherently asymmetric, the jet-launching star could have recoiled in the opposite direction (i.e., toward the south) by conservation of momentum between the star and the ejecta. This scenario would explain why the offset between QX Pup and the large waist is observed predominantly along the lobes’ axis. In this case, the expected -difference between QX Pup and the large waist, =53.5 km s-1, is closer to the observed value.
We discuss now, some important challenges of the recoil (or jet-propulsed star) scenario. First, the fast bipolar winds of OH 231.8 (and most pPNe) are believed to be launched by the compact companion in the binary system after trapping part of the slow wind of the mass-losing star (§ 1). This would imply that, under this scenario, the companion would have received most of the momentum excess, being violently pushed away from its original position. To make this hypothesis consistent with the observed position of QX Pup, the compact companion should have dragged QX Pup along in its journey. Although this is not impossible, it would require a close-binary system with a primary companion significantly more massive than QX Pup for the latter to have remained gravitationally bound to the primary.
Second, if both stars have recoiled, the total momentum of jet-propulsed system would be huge, at least 13 km s-1, given the value of 5 km s-1 observed and adopting a total mass of the system +2.6 . This is in the most favourable case that QX Pup was at the tip of the AGB at the time of the ejection, i.e., it had a mass close to its final value in this stage (0.6 , given that its mass in the main-sequence was about 3 , Jura & Morris, 1985; Bloecker, 1995). The mass of the A0 main-sequence companion is 2 . This simple calculation, indicates that the momentum carried by the jet-propulsed system is much larger than the momentum excess of the north lobe, which represents a major objection to this scenario.
Perhaps the combination of orbital-motion () and recoil () could explain, at least partially, the mysterious location of QX Pup off-centered from the large waist. Working together, the main problems facing these two scenarios (when they are considered individually) would be alleviated to some extent. Both phenomena are indeed plausible even if it is not easy to establish what is their precise connection with the observed offset and -difference.
We note that even if a small or moderate recoil has happened, the main argument against orbital motion, based on the small -difference between the large waist and QX Pup, is not well founded because the systemic velocity of the binary (and probably other orbital parameters, e.g., and/or ) would have changed after the massive bipolar ejection. In addition to the effect of recoil, which may or may not have happened, the systemic velocity and the binary orbital parameters are likely to have changed as the consequence of the primary-to-secondary mass ratio reversal (from =/0.67 to 3.3) during the evolution of the system from the early to the late stages of the mass-loss period that QX Pup is undergoing. This makes unreliable the comparison of the system radial velocities at different epochs (before and after major mass-ejections) and its interpretation.
6.2 The binary system at the core
One of the important new results from these observations is the disclosure of the locus of the mass-losing star QX Pup inside clump S. In light of this discovery, a key question immediately arises: Is the companion to QX Pup also inside clump S?
Our ALMA data have uncovered a compact bipolar outflow (exclusively traced by SiO) that is emerging from the stellar vicinity. This is an indication that the binary companion is inside or near clump S assuming, as most current PN-shaping theories do, that the bipolar SiO outflow is launched by the companion (powered via disk-mediated accretion) and not from the mass-losing star. Under this hypothesis, the relative positions between the SiO outflow’s expansion centroid and clump S would then indicate the separation between the two stars. Unfortunately, the angular resolution of our current ALMA observations is not sufficient to obtain an accurate estimate of this separation, which we measure to be =5060 AU, but certainly 150 AU.
Below, we extend our reasoning to try to limit the range of possible values of the orbital period () and orbital separation () of the central binary system.
Upper limit to the orbital size. The inner-wind layers of QX Pup (that is clump S) and the inner regions of the compact bipolar SiO outflow represent the most recent (100 yr old) mass-ejections known in OH 231.8 (§ 4.1 and 4.2). Curiously, although the SiO outflow is presumably launched by the companion while clump S represents the inner-wind layers of QX Pup, we do not observe a significant difference between the systemic velocity of these two components. Thus, it is likely that the centroids of the emission lines that sample these 100 yr old mass-ejections denote the systemic velocity of the mass center of the binary system, which should be determined by the orbital motion of the mass-losing or wind-launching stars averaged over at least one complete orbit. This would imply that 100 yr and, thus, [30-35] AU, assuming a circular orbit and adopting =2 and =[0.6-2] .
This small orbital separation is consistent with the recent VLBI observations of the SiO and H2O masers in OH 231.8 by Dodson et al. (2018). These authors find that the SiO masers, formed in the pulsating layers of QX Pup and coincident with the position of clump S (to within 001, § 3), lie at 10-15 milli-arcseconds from the center of expansion of the H2O masers. The latter trace a young (38 yr) bipolar outflow, expanding at low velocity (19 km s-1), which represents the innermost parts of the SiO outflow reported by us (see also § 6.3.3). Assuming that the H2O masers mark the driving jets that produce the macro-scale structure of the nebula and assuming that the jets are launched by the compact companion, the relative separation between the SiO masing site and the H2O masers’ expansion center suggests an orbital separation 25-30 AU (for an average angle of 45° from conjunction).
Lower limit to the orbital size. The presence of SiO masers in OH 231.8, observed at distances of 6 AU from QX Pup (§ 1), imposes a lower limit to the orbital separation, since the masers will not survive the ionization by the hot companion if the latter is too close. This problem was examined statistically by Schwarz et al. (1995) in a sample of dusty symbiotics (with Mira-type stars and WD companions) with underluminous or absent SiO masers. In a similar way, here, we consider the influence of the UV radiation from the A0 V companion in the vicinity of QX Pup. For an orbital separation of =8 AU, the UV photons from the 10,000 K main-sequence companion will reach to a Strömgren radius of about 2 AU, that is, just to the outer bounds of the SiO masing site in OH 231.8. This is for a mean nebular density around the companion of 6 cm-3 (using a density law 109()2 cm-3 in the inner wind layers of QX Pup; see Sánchez Contreras et al., 2002a). The SiO masers are known to be placed within the dust condensation radius in AGB stars, therefore, this region could be much more difficult to penetrate by the UV radiation from the hot companion than estimated from the simple dust-free analysis performed. The conclusion from this crude computation is, thus, that the presence of SiO masers is not incompatible with small orbital separations, even as small as 8 AU.
For an inverse-square density law as adopted, the Strömgren radius around the companion would increase with the distance to QX Pup as . Therefore, for a 25-35 AU-wide orbit, the Strömgren radius will be 9-15 AU.
6.3 Nebular formation: major events
Our ALMA observations have unveiled a series of small- and large-scale structures previously unknown. These structures, together with the dominant nebular macro-structures known from previous works (the HV lobes and the large-scale equatorial waist), relate the history of mass-loss events that have occurred in the last 1000 years and that have resulted in the extraordinary nebular architecture displayed by OH 231.8. Although uncertain, our estimates of the kinematical ages of the different components are useful to reconstruct the sequence of events that resulted in the complex array of nebular structures observed.
6.3.1 The HV lobes and the large waist
A comprehensive study of the HV lobes and the large waist of OH 231.8 as well as a more complete discussion of their origin is deferred to a future publication (paper II). Here, we briefly review some basic or new aspects that are needed to contextualise our discussion on the new nebular structures discovered with ALMA, which are the main focus of this paper.
In agreement (within uncertainties) with the CO (=1-0) and (=2-1) interferometric maps with 1″-3″ resolution analyzed by Alcolea et al. (2001), our ALMA data suggest that the HV lobes were shaped and strongly accelerated about 800 years ago, maybe by the action of CFWs impinging on the dense, pre-existing AGB ambient material.
Recent hydrodynamical simulations by Balick et al. (2017) show that a combination of fast clumps and wide-angle winds launched into a dense, slow AGB wind produces pairs of inflated lobes and thin columnar flows along the axis (reminiscent of the H bubble-like lobes and the central spine of the CO outflow, respectively) as well as a prevailing expansive kinematics with a linear velocity gradient.
The temperature of the shocked gas predicted by these simulations is remarkably high, even in the columnar jet-like component that presumably corresponds to the cold CO lobes. In this region, the simulations leads to post-shock temperatures of 102-103 K but the observations indicate much lower values at present, 40 K (§ 5.1). If the CFW+‘AGB wind’ interaction scenario is correct, the low temperatures of the CO outflow add support to the hypothesis that the duration of the CFWs or clumps ejection was short. Cooling of the post-shocked gas to a few 10 K (along with molecule reformation) is expected to happen in just a few years after the fast winds are “switched off”, given the high densities in the lobes (105 cm-3, § 5.1; for a similar discussion, see Sánchez Contreras et al. 2015, Sánchez Contreras et al. 2002b, and references therein).
An important difference with respect to the data presented in Alcolea et al. (2001) is that, in our ALMA maps, the spatio-kinematic structure of the large-scale equatorial waist is fully resolved and indicates that this component has a kinematical age of 870 yr, i.e., similar to that of the HV lobes and, significantly smaller than the upper limit (4000 yr) deduced for the central core in Alcolea et al. (2001). The sharp boundary at the outer edge of the equatorial waist points to a sudden increase of the mass-loss rate with respect to the surrounding material that occurred 870 yr ago or less. This implies that the bulk of the mass in the central low-velocity core (about 0.6 , Alcolea et al., 2001) was ejected at a rate a factor 3-4 larger than estimated before, possibly at 6 yr-1.
Our ALMA maps show that the large waist does not expand at constant velocity, which would be expected if this component is simply the remnant of the AGB CSE pierced along the poles by fast bipolar ejections. we note that the expansion velocity in the large waist varies from 3 km s-1 at the inner edge, at 225 AU100, to about 25 km s-1 at the outer boundary, at 2700 AU (§ 4.4.1). However, in a dust-driven AGB wind, at these large distances from the central star (well beyond the dust formation and wind acceleration layers) the gas should flow away as a stable wind with a constant terminal expansion velocity, in contrast to what we observe. The velocity gradient in the large waist then suggests a more complex formation history, perhaps involving underlying low-latitude or flattened ejections (e.g., Matt & Balick, 2004), continuous binary mass transfer leading to an equatorially dense circumbinary flow (e.g. via wind Roche-lobe overflow; Mohamed & Podsiadlowski, 2012), etc.
6.3.2 The fish bowls
Perhaps the most enigmatic structures reported in this paper are the two large (8″6″) bubble-like features that surround the central parts of the nebula, which we call the fish bowls (Fig. 14). As explained in § 4.5, the fish bowls are probably thin-walled ellipsoids that are radially expanding at moderate los-velocities (—-—30-35 km s-1) from their respective centroids.
The fish bowls, also simply referred to as ellipsoids, resemble inflating bubbles. Their thin-walled structure, manifested as a notable limb-brightening in the CO maps, suggests that the ellipsoids mainly consist of swept-up ambient circumstellar material. As we will show next, the fish bowls are relatively old structures although probably slightly younger than the large-scale waist and the HV lobes.
As discussed in § 4.5, the kinematic age of the fish bowls cannot be precisely determined because the size and los-inclination of the -axis is unknown. Following the principle of Ockham’s Razor, a model in which =4″ would be preferred (over models with ) since fewer free parameters are needed to model the ellipsoids, which would approach two oblate spheroids. This is also consistent with the overall cylindrical symmetry of most nebular components. Considering the radial velocity gradient between the approaching and receding extremes, a value of 4″ results in a growing time of 730 and 850 yr for the and the , respectively (together with 35°, see Fig. 15-right). This value represents how long ago the ellipsoids started inflating and it could be an upper limit if the expansion has slowed down with time (as is perhaps expected as increasing amounts of material are swept-up).
The age of the fish bowls can be estimated in an independent way by comparing the relative distance between their centers (23) and their different systemic velocities (22.5 km s-1). If the offset and the -difference are both due to the relative motion of the ellipsoids moving away from each other, we derive (23/22.5km s-1)730 years, where is the inclination of the relative-velocity vector between the and the (also referred to as the centroids’ line) to the plane of the sky. Adopting an average value of 35° (under the premise that the ellipsoids are moving away from each other along the same direction as the HV-bipolar lobes), we derive a travel time of 510 yr.
This value is consistent with the upper limit to the growth time of the ellipsoids deduced above. We find that for the the two time-scales above, and , indeed coincide for an inclination angle of 40° and -axis length of 38, leading to 650 yr. For the , a slightly larger value of the inclination, 45-50°, and a smaller value of 35 would be needed to match and to a common value of 750 yr. However, in the case of the , the growth time is particularly uncertain since the FWZI of CO and the —— distance are not well determined due to contamination with CO emission from other nebular components (§ 4.5). For this reason, and since the age difference is marginal, we cannot confidently affirm that the is older than the and, thus, we will regard the two fish bowls as approximately coetaneous.
So, within the large uncertainties of these rough estimates of the age, the spatio-kinematics of the fish bowls and their relative motion suggests that these started expanding and moving away from each other about 650100 yr ago, i.e., presumably some time after the acceleration of the HV lobes and the large-scale hourglass began.
The origin of the ellipsoids is unclear. They could have a similar origin to that of the 500 yr-old extended lobes sampled by H emission, including the small bubble-like structure inner to the south lobe (Sánchez Contreras et al., 2000). The velocity field of the shock-excited H-nebula is the composition of a general radial expansion from the center and a spherical expansion originated inside of the lobes. The spherical expansion of the H-bubbles is proposed to result from the adiabatic cooling of the shocked circumstellar gas after a shock-regime transition from radiative to adiabatic (Sánchez Contreras et al., 2000).
The centroids of the fish bowls are aligned roughly along the major axis of the nebula in the sky-plane, which is unlikely to be coincidental. This could suggest that their formation was triggered by (or somewhat related to) a ”critical” time-period or instant of the evolution or development of the HV lobes. For example, the moment when the CFWs driving the HV bipolar outflow were switched off or when they passed across a certain region of the ambient circumstellar medium with special physical conditions (e.g., through the boundary between a double-shell environment with an abrupt density fall; see the analytic study of the formation of inflating bubbles at the head of the jet as a result of its propagation from a high-density to a low-density ambient medium by Soker 2002).
The relative offsets between the ellipsoids are also puzzling. The centroids of the and are not equidistant to the equator of the large waist, indeed the centroid of the ellipsoids’ expansion centers is located at about (035, 115) – see Figure 14. This offset could indicate that the and the move along a slightly different direction with respect to a common origin. In particular, the would be travelling in a direction that is closer to the plane of the sky than the . Additionally, the two ellipsoids may have not emerged exactly at the same distance above and below the equator and also they may not move away from the center at exactly the same velocity. These differences between the and are not surprising given the notable asymmetry of the large-scale nebula with respect to the equatorial plane. As noted in § 6.1, the orbital and/or recoil motion of the mass-losing star could have had an additional effect in the observed positions and of the ellipsoids, maybe partially explaining their global offset to the west and slightly above the equator of the large waist. The composition of different velocity vectors when the ellipsoids were formed and when the different envelope components were ejected complicates enormously a detailed reconstruction of the nebular formation and shaping history of OH 231.8.
6.3.3 Recent mass-loss history
– The SiO outflow. The compact (1″4″) bipolar SiO outflow that emerges from clump S (§ 4.2) and the hourglass-shaped shell adjacent to the outflow (i.e.,the mini-hg, § 4.3) denote recent bipolar mass ejections that started about 500 yr ago (or less if strong deceleration has occurred). The spatio-kinematics of these components suggests that the SiO outflow (perhaps jointly with an underlying powering CFW not directly seen in these data) is sculpting the ambient material as it propagates outwards. The SiO outflow and the neighboring mini-hg probably sample different adjacent layers of the shell of shock-compressed material that results from the interaction between a fast light wind and a slow high-density environment (e.g., Lee and Sahai, 2003; Sánchez Contreras et al., 2004; Balick et al., 2017). In this scenario, the mini-hg and the SiO outflow are both probably made of a mixture (in different proportions) of ambient material displaced by forward-shocks and fast wind material compressed by backward shocks. Given that SiO is a shock-tracer, it is unlikely that the SiO outflow represents the unshocked CFW itself preserved in a pristine stage.
The two SiO bright knots observed along the axis within 150 AU from clump S (§ 4.2) have kinematical ages of 50-80 yr. The abrupt velocity rise from the center to the compact SiO knots, where the largest velocity spread is observed, suggests that they may represent bow-shocks. Since the shock velocity at the knots is moderate (23 km s-1) we do not expect significant molecular destruction but we do anticipate SiO (and maybe other refractory materials) to be extracted from dust grains, consistent with the observations.
The SiO knots, if bow-shocks, could be associated with internal working surfaces produced by a recent variation of the speed and/or directionality of the underlying CFW. A (small) change in the direction of the CFW’s axis is consistent with the fact that the SiO knots do not lie at the tips of the mini-lobes. It is also accordant with the slightly different (by a few degrees) sky-plane orientation and los-inclination of the SiO and the CO outflow, and, finally, with the S-shaped emission distribution of the SiO lobes (§ 4.2). There are other large-scale nebular structures in OH 231.8 that are unequally oriented (e.g. the two fish bowls), however, there is not a clear periodic or regular pattern in these large-scale components that we can relate to a gradual change in the orientation. This probably denotes episodic (erratic?) wobbling or swing of the CFWs rather than smooth uninterrupted precession.
The spatio-kinematics, the location, and the orientation of the SiO outflow are consistent with this being the large-scale counterpart (or outermost parts) of the bi-lobe 90 AU-long outflowing structure traced by H2O masers (§ 1). In their recent VLBI study of the H2O 22 GHz-maser spots in OH 231.8, Dodson et al. (2018) find bulk motions with radial velocities of about 19 km s-1, leading to an expansion age of 382 yr. Since their discovery in 1980 by Bowers and Morris (1984), the H2O 22 GHz-masers in OH 231.8 have preserved a relatively stable profile, composed on two major peaks centered near 25 and 40 km s-1, suggesting that the structure of the underlying bipolar wind on which the maser spots lie101010we note that H2O maser spots form only in certain specific areas or clumps with suitable pumping conditions. has not undergone substantial structural or dynamical changes. This is consistent with a steady bipolar outflow that has been ongoing for a period longer than a few decades (and maybe during the last 500 yr) but with at least one time-varying speed and/or orientation event about 50-80 yr ago leading to the SiO knots.
– The mini-waist. The equatorial waist of the small-scale hourglass that surrounds the SiO outflow is another component unveiled by ALMA with an unclear origin. The are two major aspects that are difficult to explain in the frame of our current understanding of PN shaping. One is the presence of a linear velocity gradient along the equatorial direction, indicative of equatorial flows that originated at the same time as the polar ejections (i.e., the mini-lobes). A single sudden mass-ejection event was originally proposed by Alcolea et al. (2007) to explain a similar structure in the pPN M 1-92; these authors speculate on the possibility that the whole nebula was formed as a result of a magneto-rotational explosion in a common-envelope system.
Another one is the extremely low expansion velocity observed in the mini-waist. As is best seen in the axial PV of the CS (6-5) transition (Fig. 7), the maximum expansion velocity, which is reached in the outer edge of the waist (500 AU), is only 4-5 km s-1. The velocity is progressively smaller in regions closer to the center. Although the inner edge of the waist is not well resolved, we identify a bright inner region at about 150 AU that expands at a remarkably low velocity, 1-1.2 km s-1. This value is exceedingly small compared with the expansion velocity of the inner-wind layers of QX Pup, within 60-100 AU, where we deduce bulk motions of =5-7 km s-1, and up to 10 km s-1 (given the full width of the high-excitation lines that sample these regions, § 4.1).
We believe that a plausible explanation for the insignificant expansion velocities in the inner boundary of the mini-waist (even smaller than, or comparable to, the typical turbulent motions in AGB and post-AGB envelopes, see, e.e., Decin et al. 2018; Santander-García et al. 2015) is that this extremely slow equatorial outflow lies in, an possibly emerges from, a stable structure orbiting around a central mass, perhaps analog to the rotating and expanding disks observed around a number of post-AGB stars (e.g., the Red Rectangle, Bujarrabal et al., 2016) and, to date, in one AGB star (L2Pup, Kervella et al., 2016). The expansion in these disks is indeed quite slow, with velocities down to 1 km s-1 in some regions. The spatio-kinematic structure of the mini-waist is not inconsistent with slow rotation, 1.5 km s-1, in its innermost regions (in addition to the expansion), however, the spatial resolution in our maps is insufficient to confirm it. We note that, for a central mass of 0.6-2.5 and assuming keplerian rotation we expect rather low values of (2-4) km s-1 at distances of 150 AU. The fact that there is expansion in the mini-waist suggest that rotation could be in a sub-Keplerian regime, that is, with a steeper fall of the rotation speed with the distance to the center, as observed, e.g. in the outer disk of L2 Pup, where (Kervella et al., 2016) or the Red Rectangle, where (Bujarrabal et al., 2016).
6.4 Final remarks
The complex array of small- and large-scale nebular structures in OH 231.8 traced by these ALMA observations indicate that a series of bipolar mass-ejection events have occurred during the last 800-900 yr. The origin of the oldest and most prominent bipolar structures remains unknown, but the presence of much younger bipolar ejections indicate that the CFW-engine is still active at the core of OH 231.8. This fact renders a common envelope (CE) origin improbable, at least, for the range of input parameters explored by Staff et al. (2016). As show by these authors, once the close companion has been swallowed by the AGB star (in less than 30 yr after the first Roche lobe overflow mass-transfer event), it is difficult to produce subsequent jet-launching episodes that are in turn needed to explain the present-day bipolar ejections.
There are two notable differences between the large-scale 800 yr old CO outflow and the most current (80 yr old) bipolar ejections traced by SiO and H2O masers (§ 6.3.3). The moderate expansion velocities of the present-day bipolar outflows (35 km s-1) are in marked contrast with the much larger expansion velocities reached in the massive HV lobes, of up to 400 km s-1. Since the velocity of the outflows must be similar to the escape velocity of the launching site, the A0 V companion of QX Pup is more likely to have blown the 400 km s-1 winds (or the underlying driving CFWs, as already discussed in more detail by Sánchez Contreras et al. 2004). However, which star is blowing the current SiO outflow? Is QX Pup launching a bipolar outflow with or without the assistance of a companion?
Another glaring difference between the SiO and CO outflow is that the former is rather symmetric about the equatorial plane, whereas the south lobe of the large-scale nebula almost doubles the north in size.
These notable differences could indicate that the jet-launching mechanism itself has changed or that the initial conditions under which the jets formed (presumably, involving disk-mediated mass transfer from the AGB to the companion star that blows the jets) have been modified in such a way that they now produce slower and more symmetric bipolar ejections than in the past. These changes may be intimately linked to major adjustments in the binary system configuration, which may have occurred after the powerful ejections that resulted in the formation of the massive and fast CO outflow.
7 Summary
We present new ALMA continuum and molecular line observations in band 7 of the bipolar molecular outflow of the pre-PNe candidate OH 231.84.2. The high angular resolution (02-03) and sensitivity of our ALMA maps provide the most detailed and accurate description of the global nebular structure and kinematics of this object to date. We find an extravagant array of nested (but not always co-axial) small-to-large scale structures previously unknown (schematically depicted in Fig. 2 and listed in Table 4). Here we offer a summary of our main results:
-
-
Our continuum maps, at 294, 304, 330 and 344 GHz, show a 8″4″ hourglass-like structure with its long axis oriented along PA21°. The peak of the continuum maps has coordinates R.A.=07h42m16915 and Dec.=14°42′5006 (J2000) and marks the position of the central star QX Pup (for epoch 2016.6). The latter is enshrouded within a compact (60 AU) clump of dust (and gas) referred to as clump S.
-
-
Unexpectedly, clump S does not lie on the equatorial plane of the hourglass but it is clearly displaced by 06 to the south along the nebular axis.
-
-
Except for clump S, the continuum follows a power-law throughout the hourglass. This implies a dominant contribution by optically thin 75 K dust with an emissivity index of 1.3, consistent with previous studies. At clump S, the continuum obeys a dependence consistent with a population of warm (300-400 K), large (100 m-sized) grains in the vicinity of QX Pup.
-
-
The close surroundings of QX Pup (clump S) are sampled by high-excitation transitions of Na37Cl, SiS, and 30SiO, which show very compact emission (implying a small emitting volume of radius 60 AU) and narrow profiles consistent with low expansion velocities of 5-7 km s-1.
-
-
We discover a compact (1″4″) bipolar outflow that emerges from clump S and that is exclusively traced by SiO (=7-6) and 29SiO (=8-7). This outflow is oriented similarly to the large-scale nebula but is significantly more symmetric about the equatorial plane and slower. The observed radial velocity increases abruptly from the center to two bright and compact regions located at offsets y011 about clump S, where the maximum radial velocities (35 km s-1) and full line widths (23 km s-1) are observed. These regions may represent bow-shocks (viewed at a sky-plane inclination angle of 30°) denoting recent bipolar mass ejections.
-
-
We deduce short kinematical ages for the SiO outflow, ranging from 50-80 yr, in the inner regions (150 AU), to 400-500 yr at the tips (3500 AU). This outflow seems to be the large scale counterpart of the H2O maser, 38 yr-old bipolar flow seen at 100 milliarcsecond scales.
-
-
Adjacent to the SiO outflow, we identify a small-scale hourglass-shaped structure (mini-hourglass) that is probably made of compressed material formed as the SiO outflow penetrates the dense, central regions of the nebula. The lobes and the equatorial waist of the mini-hourglass both are radially expanding with a constant velocity gradient ( ). The dimensions of the mini-waist are consistent with a torus-like structure with an outer radius of about 500 AU orthogonal to, and coeval with, the SiO outflow. The expansion velocity at the inner edge of the mini-waist (150 AU) is extremely low, 1 km s-1, which tentatively suggest the presence of a stable (orbiting?) structure.
-
-
The high-velocity, 01 pc-long bipolar lobes (HV lobes) and the dense equatorial waist (large waist) known from previous works are highly structured, specially the former. The sharp outer boundary of the large waist is now accurately determined (at a radius of 2700 AU) as well as the internal velocity field, indicating that the waist was shaped nearly simultaneously with the HV lobes, about 800-900 yr ago.
-
-
We report the discovery of two large (8″6″) faint bubble-like structures surrounding the central parts of the nebula (fish bowls). The fish bowls, which are probably made of swept-up ambient circumstellar material, are relatively old structures although probably slightly (100-200 yr) younger than the large-scale waist and the HV lobes. The origin of these enigmatic structures is unknown, but it may be linked to a critical time period or instant of the evolution or development of the HV lobes.
-
-
As part of the data analysis, and using the two CS transitions observed with ALMA in this work (=6-5 and =7-6), we have created velocity-channel maps of the rotational temperature, CS column density and total (H2) number density in the hourglass nebula of OH 231.8 (§ 5.1). We find large densities in the walls of the lobes (105 cm-3) and higher, as expected, in the equatorial waist of the nebula where the lobes join (106 cm-3). The lobes are predominantly cold (with 20-40 K). The warmest molecular gas (with 100 K) is found in the dense, central nebular parts.
-
-
We report first detections of Na37Cl and CH3OH in OH 231.8, with CH3OH being also a first detection in an AGB star. High-excitation lines of Na37Cl and other refractory species, namely, SiS and 30SiO, arise in the inner-wind regions of QX Pup (clump S), where we estimate fractional abundances of X(Na37Cl)[1-3], X(SiS)[2-3], and X(30SiO)[0.5-1.5] (§ 5.2.1). The CH3OH emission arises solely from the bipolar outflow, predominantly from the periphery of the compact bipolar outflow traced by SiO, where the fractional abundance is X(CH3OH)10-8-10-7 (§ 5.2.2).
-
-
The position of QX Pup off-centered from the waist of the large-hourglass is one of the most puzzling discoveries from our ALMA data. Perhaps the combination of orbital-motion and recoil of the binary system after strong asymmetrical mass ejections could explain, at least partially, its mysterious location.
-
-
The orbital parameters of the central binary system are very poorly known. A loose upper limit to the orbital separation of 150 AU is deduced from the relative separation between clump S and the centroid of the SiO outflow (presumably collimated by the companion). We present some arguments in favour of a smaller orbital separations, 35 AU.
-
-
Our ALMA observations unveil a series of new substructures that point to a nebular formation and shaping history significantly more complex than previously thought, in particular, indicative of multiple non-spherical mass ejections. The speed and directionality of the driving CFWs seem to have changed over time, although the lack of periodic or regular pattern in the large-scale components probably denotes episodic (erratic?) wobbling or swing of the CFWs rather than smooth uninterrupted precession.
-
-
The origin of the bipolar ejections that led to the formation of the outstanding nebular architecture of OH 231.84.2 remains unknown, but the presence of present-day bipolar ejections indicate that the CFW engine is still active at its core. This is hardly reconcilable with a common envelope ejection scenario, at least in a simplified version of it, where the AGB star has already swollen a compact companion after the premier ejection of the fast collimated winds that produced the large-scale CO outflow 800-900 yr ago.
Acknowledgements.
We are grateful to the referee of this paper, Joel Kastner, for his detailed report and very useful remarks and suggestions to improve the manuscript. We thank Bruce Balick for fruitful discussions on winds interaction hydrodynamics. This paper makes use of the following ALMA data: ADS/JAO.ALMA#2015.1.00256.S. ALMA is a partnership of ESO (representing its member states), NSF (USA) and NINS (Japan), together with NRC (Canada), NSC and ASIAA (Taiwan), and KASI (Republic of Korea), in cooperation with the Republic of Chile. The Joint ALMA Observatory is operated by ESO, AUI/NRAO and NAOJ. The data here presented have been reduced by CASA (ALMA default calibration software; https://casa.nrao.edu); data analysis was made using the GILDAS software (http://www.iram.fr/IRAMFR/GILDAS). This work has been partially supported by the Spanish MINECO through grants AYA2012-32032, AYA2016-75066-C2-1-P, and AYA2016-78994-P and by the European Research Council through ERC grant 610256: NANOCOSMOS. This research has made use of the The JPL Molecular Spectroscopy catalog, The Cologne Database for Molecular Spectroscopy, the SIMBAD database operated at CDS (Strasbourg, France), the NASA’s Astrophysics Data System and Aladin.References
- Alcolea et al. (2001) Alcolea, J., Bujarrabal, V., Sánchez Contreras, C., Neri, R., and Zweigle, J. 2001, A&A, 373, 932
- Alcolea et al. (2007) Alcolea, J., Neri, R., and Bujarrabal, V. 2007, A&A, 468, L41
- Alcolea et al. (1996) Alcolea, J., Bujarrabal, V., and Sanchez Contreras, C. 1996, A&A, 312, 560
- Balick and Frank (2002) Balick, B., and Frank, A. 2002, ARA&A, 40, 439
- Balick et al. (2013) Balick, B., Huarte-Espinosa, M., Frank, A., et al. 2013, ApJ, 772, 20
- Balick et al. (2017) Balick, B., Frank, A., Liu, B., and Huarte-Espinosa, M. 2017, ApJ, 843, 108
- Blackman et al. (2001) Blackman, E. G., Frank, A., & Welch, C. 2001, ApJ, 546, 288
- Bloecker (1995) Bloecker, T. 1995, A&A, 299, 755
- Bowers and Morris (1984) Bowers, P. F., and Morris, M. 1984, ApJ, 276, 646
- Bujarrabal & Alcolea (1991) Bujarrabal, V., & Alcolea, J. 1991, A&A, 251, 536
- Bujarrabal et al. (2002) Bujarrabal, V., Alcolea, J., Sánchez Contreras, C., and Sahai, R. 2002, A&A, 389, 271
- Bujarrabal et al. (2016) Bujarrabal, V., Castro-Carrizo, A., Alcolea, J., et al. 2016, A&A, 593, A92
- Castro-Carrizo et al. (2012) Castro-Carrizo, A., Neri, R., Bujarrabal, V., et al. 2012, A&A, 545, A1
- Castro-Carrizo et al. (2017) Castro-Carrizo, A., Bujarrabal, V., Neri, R., et al. 2017, A&A, 600, A4
- Cernicharo and Guelin (1987) Cernicharo, J., and Guelin, M. 1987, A&A, 183, L10
- Cernicharo (2012) Cernicharo, J. 2012, EAS Publications Series, 58, 251
- Cernicharo et al. (2014) Cernicharo, J., Teyssier, D., Quintana-Lacaci, G., et al. 2014, ApJ, 796, L21
- Choi et al. (2012) Choi, Y. K., Brunthaler, A., Menten, K. M., and Reid, M. J. 2012, IAU Symposium, Volume 287, 407.
- Claude et al. (2000) Claude, S. M. X., Avery, L. W., and Matthews, H. E. 2000, ApJ, 545, 379
- Davidge (2013) Davidge, T. J. 2013, PASP, 125, 115
- Decin et al. (2010) Decin, L., De Beck, E., Brünken, S., et al. 2010, A&A, 516, A69
- Decin et al. (2016) Decin, L., Richards, A. M. S., Millar, T. J., et al. 2016, A&A, 592, A76
- Decin et al. (2018) Decin, L., Danilovich, T., Gobrecht, D., et al. 2018, ApJ, 855, 1
- Dennis et al. (2008) Dennis, T. J., Cunningham, A. J., Frank, A., et al. 2008, ApJ, 679, 1327-1337
- Desmurs et al. (2007) Desmurs, J.-F., Alcolea, J., Bujarrabal, V., Sánchez Contreras, C., and Colomer, F. 2007, A&A, 468, 189
- Doan et al. (2017) Doan, L., Ramstedt, S., Vlemmings, W. H. T., et al. 2017, A&A, 605, A28
- Dodson et al. (2018) Dodson, R., Rioja, M., Bujarrabal, V., et al. 2018, MNRAS, 476, 520
- Glassgold (1996) Glassgold, A. E. 1996, ARA&A, 34, 241
- Gobrecht et al. (2016) Gobrecht, D., Cherchneff, I., Sarangi, A., Plane, J. M. C., and Bromley, S. T. 2016, A&A, 585, A6
- Goldsmith and Langer (1999) Goldsmith, P. F., and Langer, W. D. 1999, ApJ, 517, 209
- González Delgado et al. (2003) González Delgado, D., Olofsson, H., Kerschbaum, F., et al. 2003, A&A, 411, 123
- Guillet et al. (2009) Guillet, V., Jones, A. P., & Pineau Des Forêts, G. 2009, A&A, 497, 145
- Hartigan et al. (1987) Hartigan, P., Raymond, J., and Hartmann, L. 1987, ApJ, 316, 323
- Herman et al. (1986) Herman, J., Burger, J. H., and Penninx, W. H. 1986, A&A, 167, 247
- Highberger et al. (2003) Highberger, J. L., Thomson, K. J., Young, P. A., Arnett, D., and Ziurys, L. M. 2003, ApJ, 593, 393
- Hirano et al. (2004) Hirano, N., Shinnaga, H., Dinh-V-Trung, et al. 2004, ApJ, 616, L43
- Höfner & Olofsson (2018) Höfner, S., & Olofsson, H. 2018, A&A Rev., 26, 1
- Huggins (2007) Huggins, P. J. 2007, ApJ, 663, 342
- Jura & Morris (1985) Jura, M., & Morris, M. 1985, ApJ, 292, 487
- Jura et al. (2002) Jura, M., Chen, C., and Plavchan, P. 2002, ApJ, 574, 963
- Justtanont et al. (2000) Justtanont, K., Barlow, M. J., Tielens, A. G. G. M., et al. 2000, A&A, 360, 1117
- Kastner et al. (1992) Kastner, J. H., Weintraub, D. A., Zuckerman, B., et al. 1992, ApJ, 398, 552
- Kastner and Weintraub (1995) Kastner, J. H., and Weintraub, D. A. 1995, AJ, 109, 1211
- Kastner et al. (1998) Kastner, J. H., Weintraub, D. A., Merrill, K. M., & Gatley, I. 1998, AJ, 116, 1412
- Kervella et al. (2016) Kervella, P., Homan, W., Richards, A. M. S., et al. 2016, A&A, 596, A92
- Knapp (1985) Knapp, G. R. 1985, ApJ, 293, 273
- Leal-Ferreira et al. (2012) Leal-Ferreira, M. L., Vlemmings, W. H. T., Diamond, P. J., et al. 2012, A&A, 540, A42
- Lee and Sahai (2003) Lee, C.-F., and Sahai, R. 2003, ApJ, 586, 319
- Li & Draine (2001) Li, A., & Draine, B. T. 2001, ApJ, 554, 778
- Lique and Spielfiedel (2007) Lique, F., and Spielfiedel, A. 2007, A&A, 462, 1179
- Matt & Balick (2004) Matt, S., & Balick, B. 2004, ApJ, 615, 921
- Maas et al. (2016) Maas, Z. G., Pilachowski, C. A., and Hinkle, K. 2016, AJ, 152, 196
- Meakin et al. (2003) Meakin, C. A., Bieging, J. H., Latter, W. B., Hora, J. L., & Tielens, A. G. G. M. 2003, ApJ, 585, 482
- Milam et al. (2007) Milam, S. N., Apponi, A. J., Woolf, N. J., and Ziurys, L. M. 2007, ApJ, 668, L131
- Mohamed & Podsiadlowski (2012) Mohamed, S., & Podsiadlowski, P. 2012, Baltic Astronomy, 21, 88
- Morris et al. (1987) Morris, M., Guilloteau, S., Lucas, R., and Omont, A. 1987, ApJ, 321, 888
- Müller et al. (2005) Müller, H. S. P., Schlöder, F., Stutzki, J., and Winnewisser, G. 2005, Journal of Molecular Structure, 742, 215
- Olofsson et al. (2017) Olofsson, H., Vlemmings, W. H. T., Bergman, P., et al. 2017, A&A, 603, L2
- Omont et al. (1993) Omont, A., Lucas, R., Morris, M., and Guilloteau, S. 1993, A&A, 267, 490
- Quintana-Lacaci et al. (2016) Quintana-Lacaci, G., Agúndez, M., Cernicharo, J., et al. 2016, A&A, 592, A51
- Raga et al. (1990) Raga, A. C., Canto, J., Binette, L., & Calvet, N. 1990, ApJ, 364, 601
- Ramos-Medina et al. (2018) Ramos-Medina, J., Sánchez Contreras, C., García-Lario, P., et al. 2018, A&A, 611, A41
- Reipurth (1987) Reipurth, B. 1987, Nature, 325, 787
- Riera et al. (2006) Riera, A., Binette, L., and Raga, A. C. 2006, A&A, 455, 203
- Rijkhorst et al. (2005) Rijkhorst, E.-J., Mellema, G., & Icke, V. 2005, A&A, 444, 849
- Sahai and Trauger (1998) Sahai, R., and Trauger, J. T. 1998, AJ, 116, 1357
- Sahai et al. (2006) Sahai, R., Young, K., Patel, N. A., Sánchez Contreras, C., and Morris, M. 2006, ApJ, 653, 1241
- Sánchez Contreras et al. (1997) Sánchez Contreras, C., Bujarrabal, V., and Alcolea, J. 1997, A&A, 327, 689
- Sánchez Contreras et al. (1998) Sánchez Contreras, C., Alcolea, J., Bujarrabal, V., and Neri, R. 1998, A&A, 337, 233
- Sánchez Contreras et al. (2000) Sánchez Contreras, C., Bujarrabal, V., Miranda, L. F., and Fernández-Figueroa, M. J. 2000, A&A, 355, 1103
- Sánchez Contreras et al. (2000) Sánchez Contreras, C., Bujarrabal, V., Neri, R., and Alcolea, J. 2000, A&A, 357, 651
- Sánchez Contreras et al. (2002a) Sánchez Contreras, C., Desmurs, J. F., Bujarrabal, V., Alcolea, J., and Colomer, F. 2002, A&A, 385, L1
- Sánchez Contreras et al. (2002b) Sánchez Contreras, C., Sahai, R., & Gil de Paz, A. 2002, ApJ, 578, 269
- Sánchez Contreras et al. (2004) Sánchez Contreras, C., Gil de Paz, A., and Sahai, R. 2004, ApJ, 616, 519
- Sánchez Contreras et al. (2006) Sánchez Contreras, C., Bujarrabal, V., Castro-Carrizo, A., Alcolea, J., & Sargent, A. 2006, ApJ, 643, 945
- Sánchez Contreras et al. (2015) Sánchez Contreras, C., Velilla Prieto, L., Agúndez, M., et al. 2015, A&A, 577, A52
- Santander-García et al. (2015) Santander-García, M., Bujarrabal, V., Koning, N., & Steffen, W. 2015, A&A, 573, A56
- Sabin et al. (2015) Sabin, L., Hull, C. L. H., Plambeck, R. L., et al. 2015, MNRAS, 449, 2368
- Schöier et al. (2007) Schöier, F. L., Bast, J., Olofsson, H., and Lindqvist, M. 2007, A&A, 473, 871
- Schwarz et al. (1995) Schwarz, H. E., Nyman, L.-A., Seaquist, E. R., & Ivison, R. J. 1995, A&A, 303, 833
- Shirley (2015) Shirley, Y. L. 2015, PASP, 127, 299
- Shure et al. (1995) Shure, M., Sellgren, K., Jones, T. J., and Klebe, D. 1995, AJ, 109, 721
- Soker (2002) Soker, N. 2002, ApJ, 568, 726
- Staff et al. (2016) Staff, J. E., De Marco, O., Macdonald, D., et al. 2016, MNRAS, 455, 3511
- Taylor & Seaquist (1984) Taylor, A. R., & Seaquist, E. R. 1984, ApJ, 286, 263
- Tsuji (1973) Tsuji, T. 1973, A&A, 23, 411
- Velázquez et al. (2012) Velázquez, P. F., Raga, A. C., Riera, A., et al. 2012, MNRAS, 419, 3529
- Velilla Prieto et al. (2015) Velilla Prieto, L., Sánchez Contreras, C., Cernicharo, J., et al. 2015, A&A, 575, A84
- Velilla Prieto et al. (2017) Velilla Prieto, L., Sánchez Contreras, C., Cernicharo, J., et al. 2017, A&A, 597, A25
- Wesson et al. (2010) Wesson, R., Cernicharo, J., Barlow, M. J., et al. 2010, A&A, 518, L144
- Wong et al. (2016) Wong, K. T., Kamiński, T., Menten, K. M., and Wyrowski, F. 2016, A&A, 590, A127
- Wong et al. (2017) Wong, K. T., Menten, K. M., Kamiński, T., et al. 2017, arXiv:1710.01027
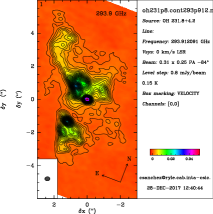
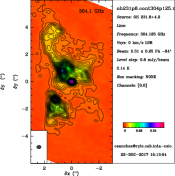
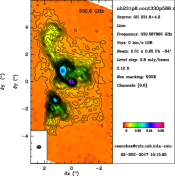
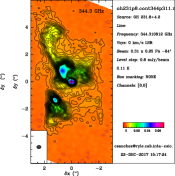
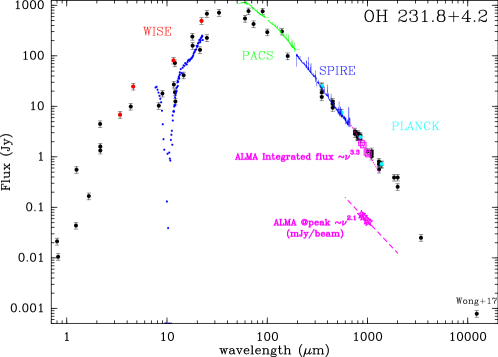
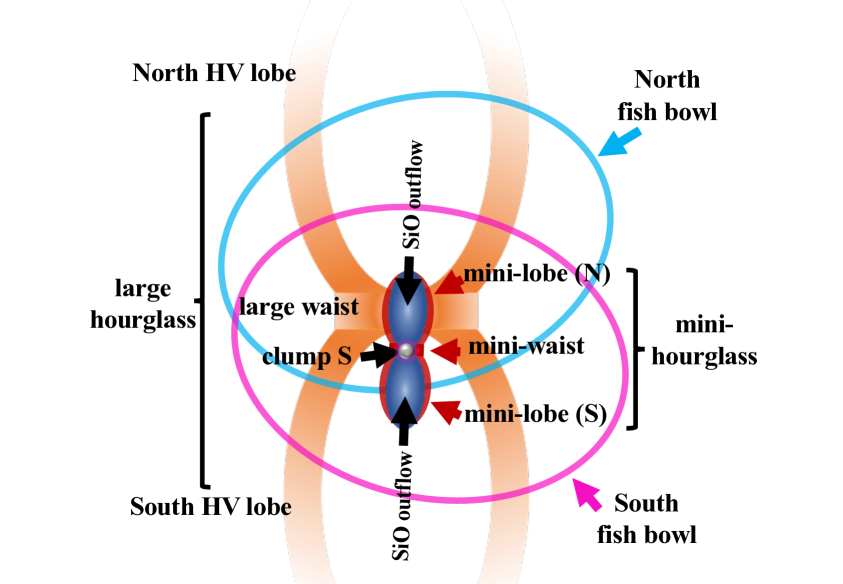
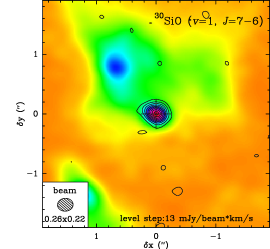

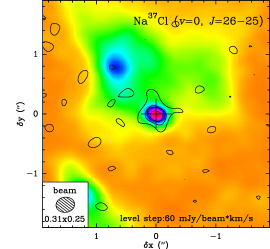
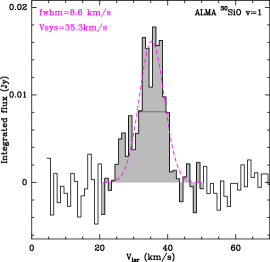
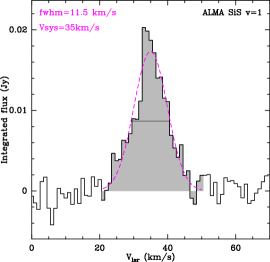
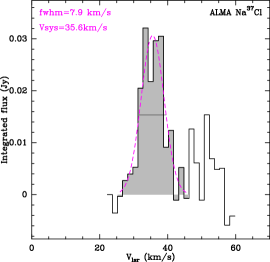
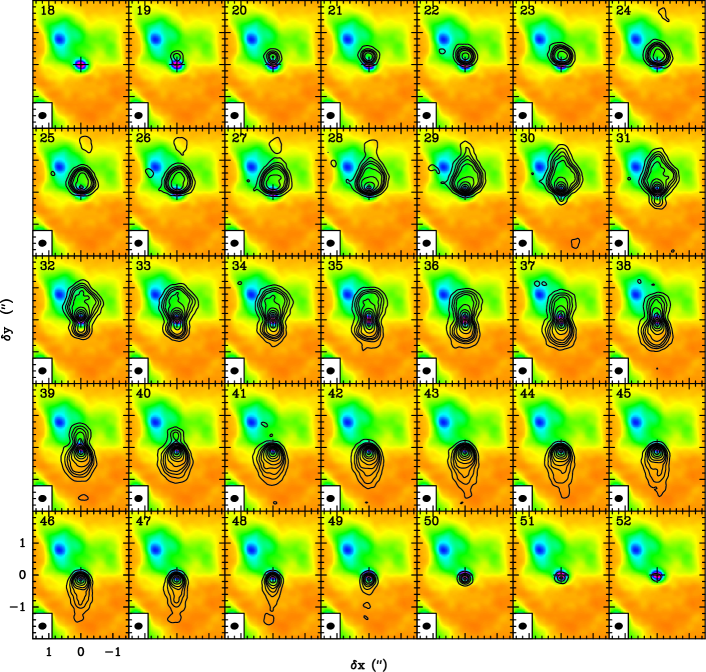
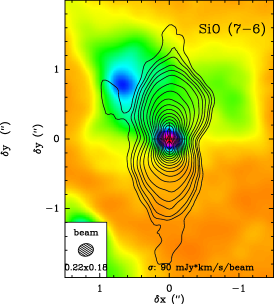
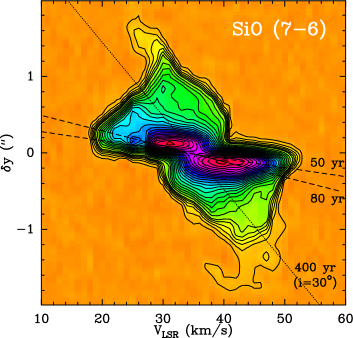
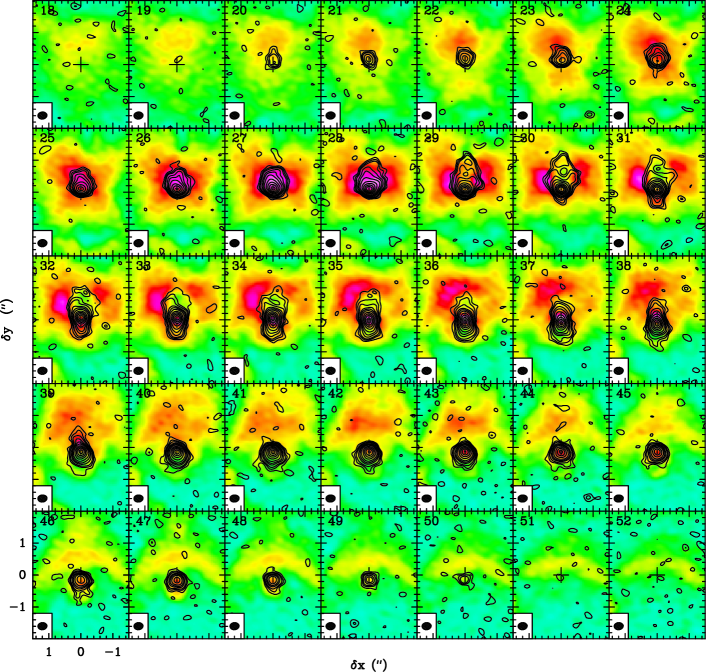
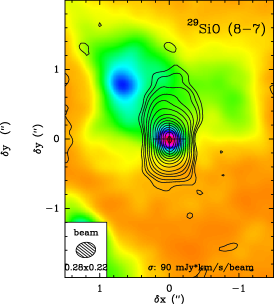
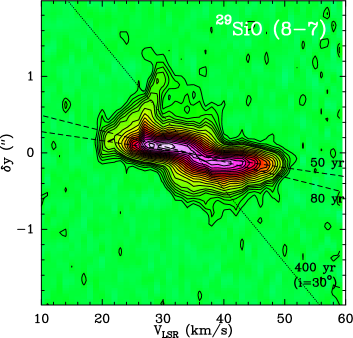
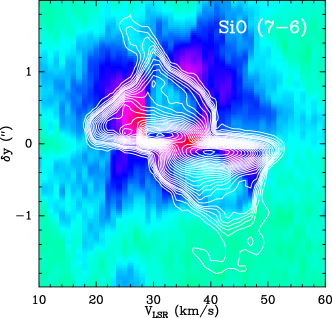
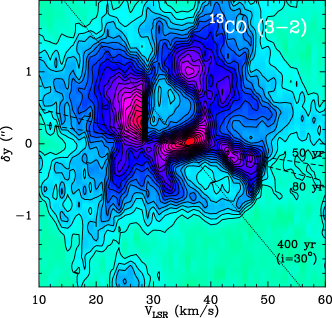
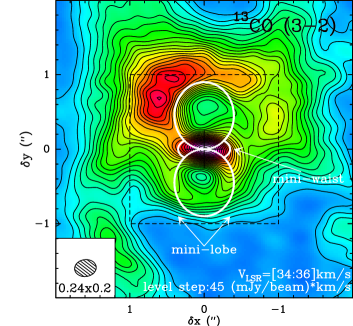
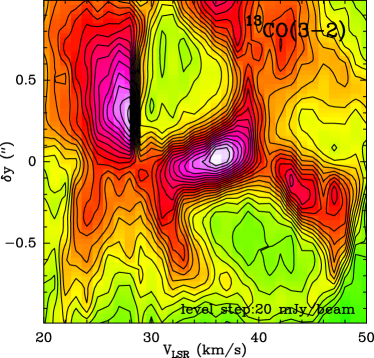
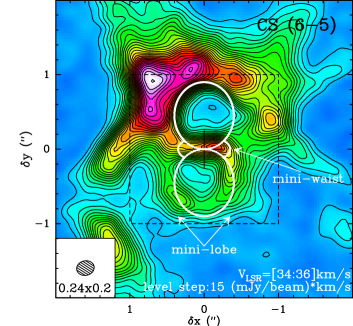
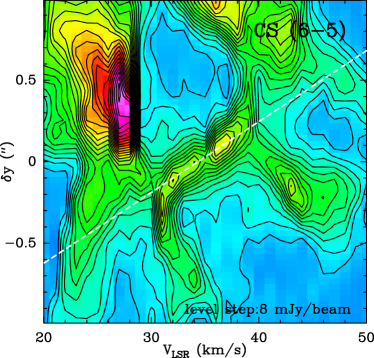
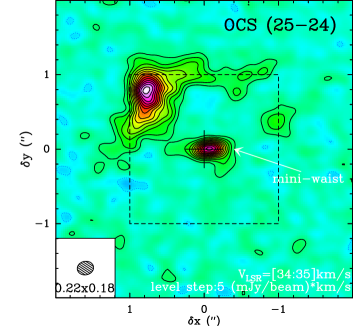
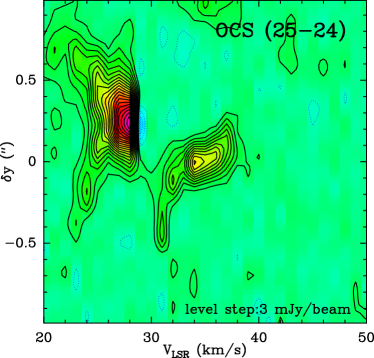
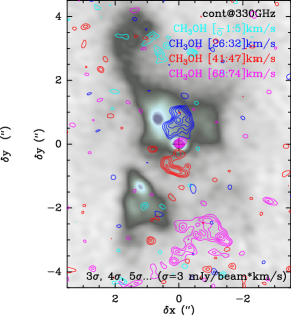
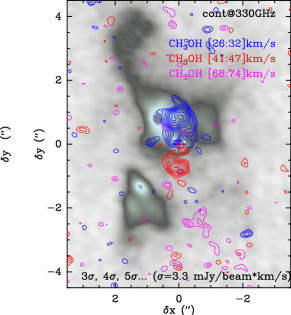
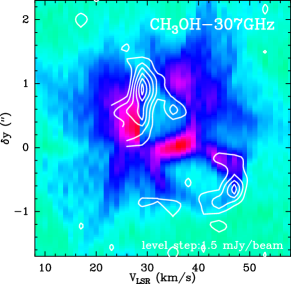
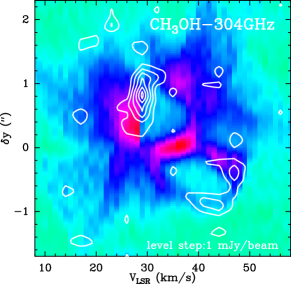
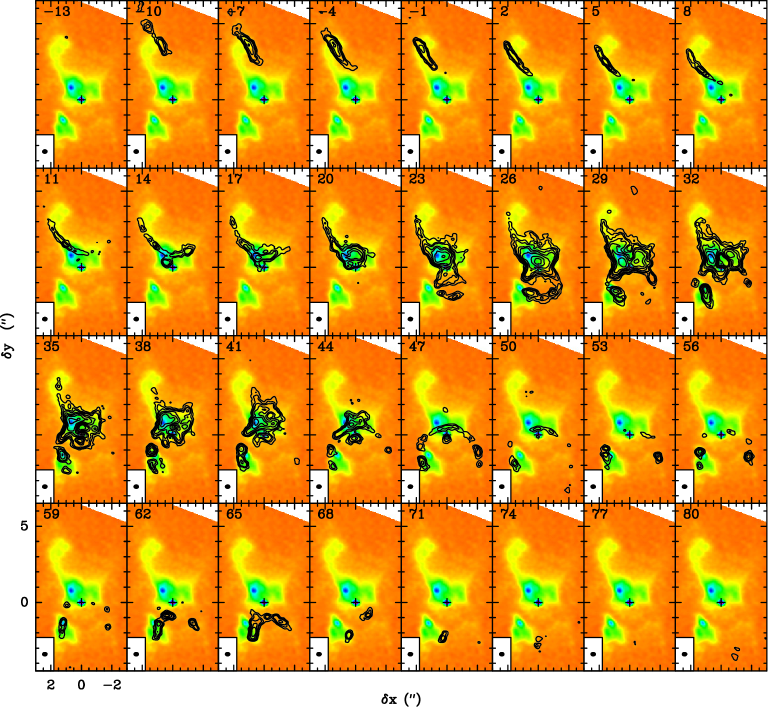
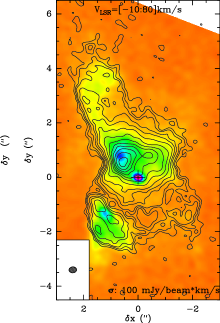
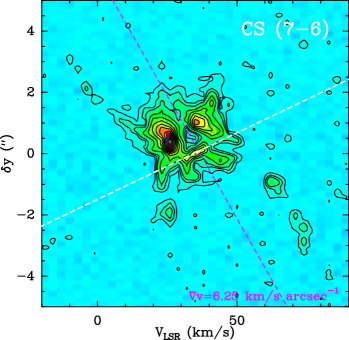
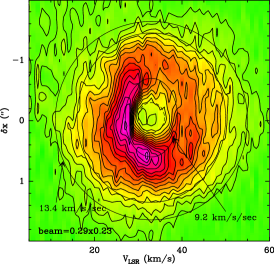
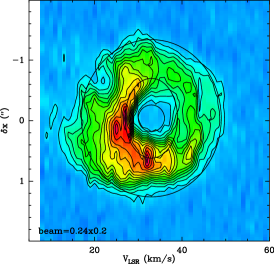
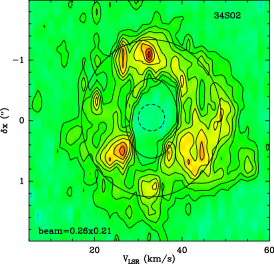
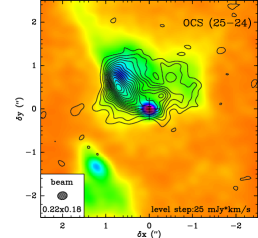
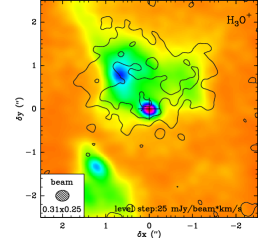
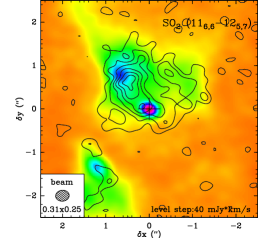
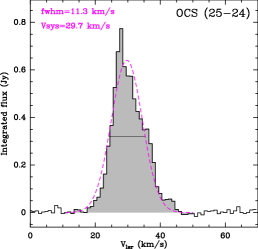
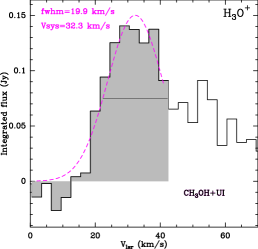
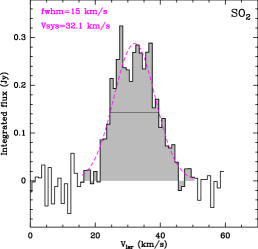
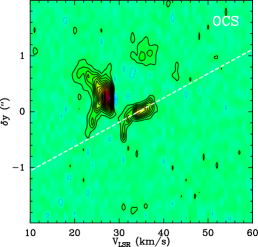
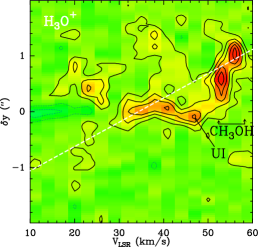
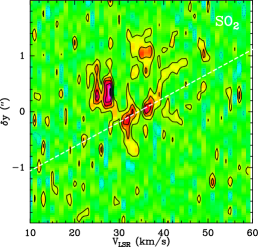
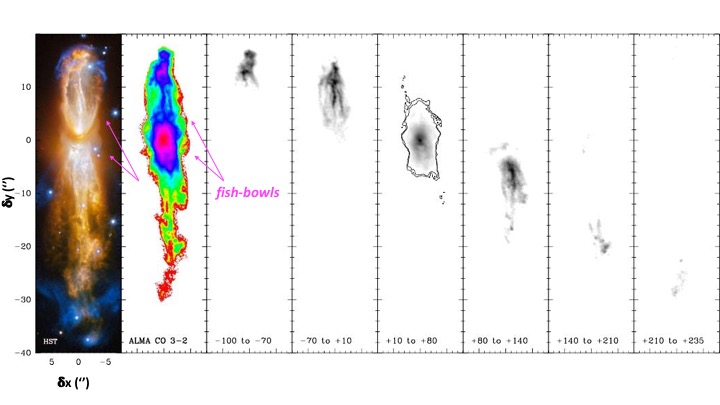
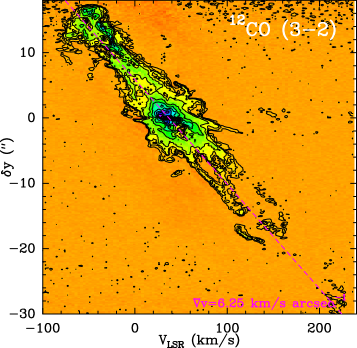
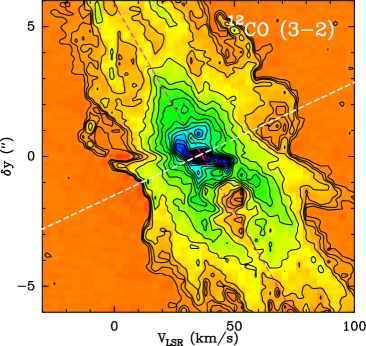
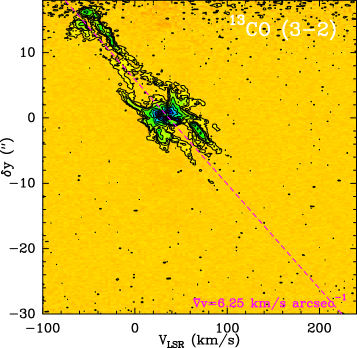
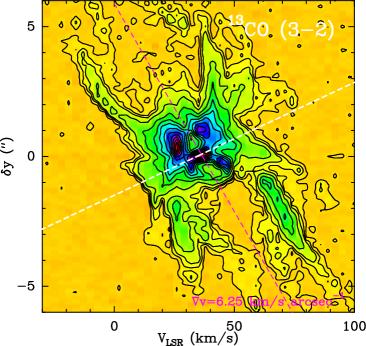
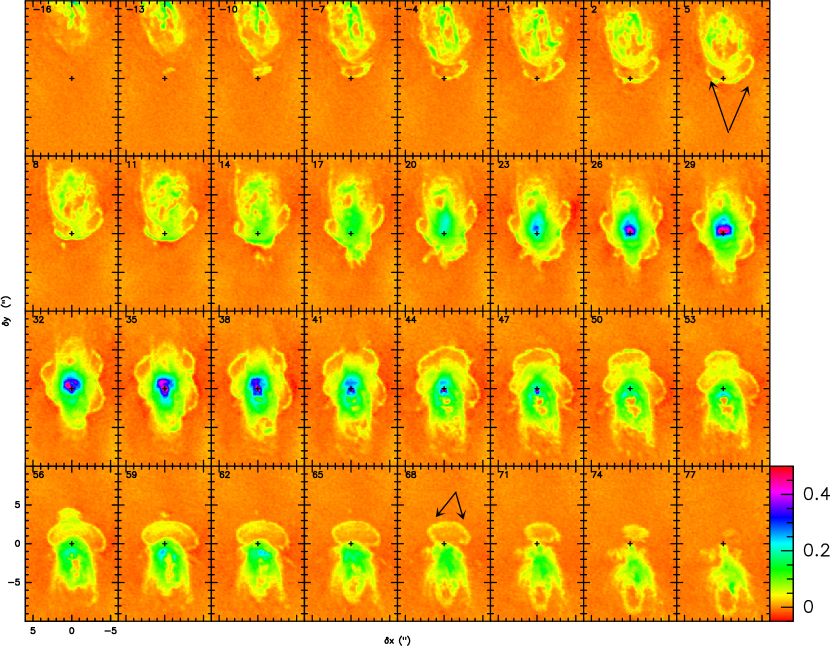
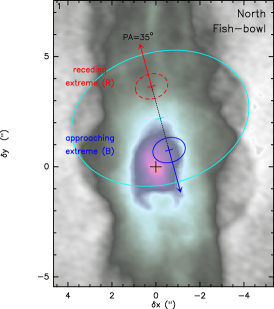
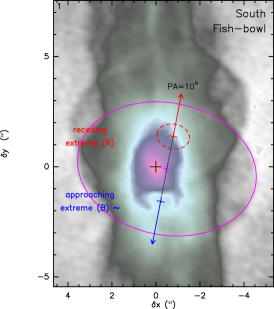
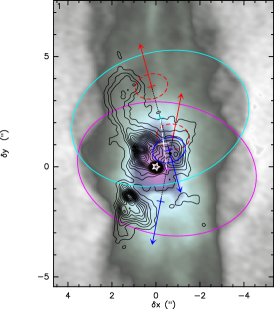
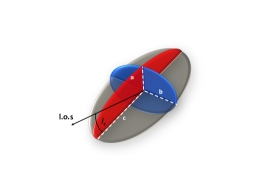
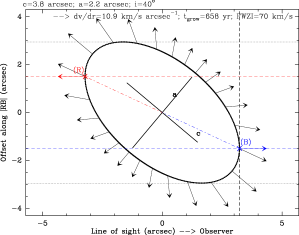

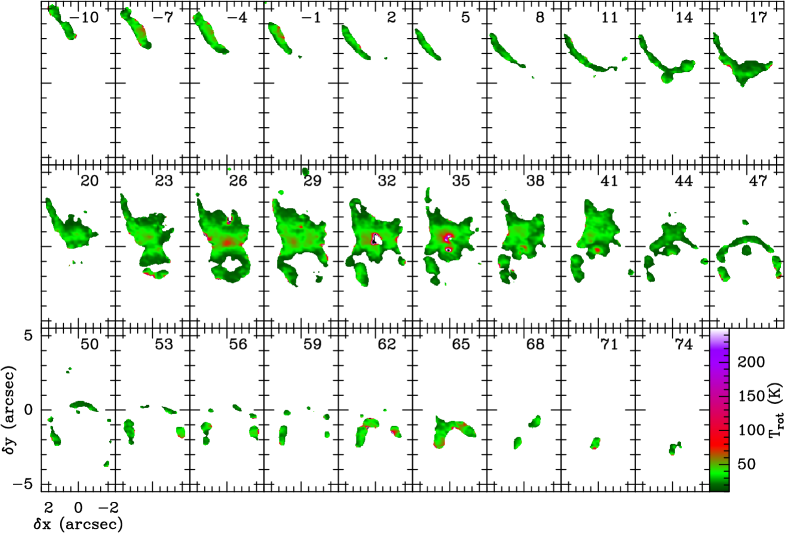
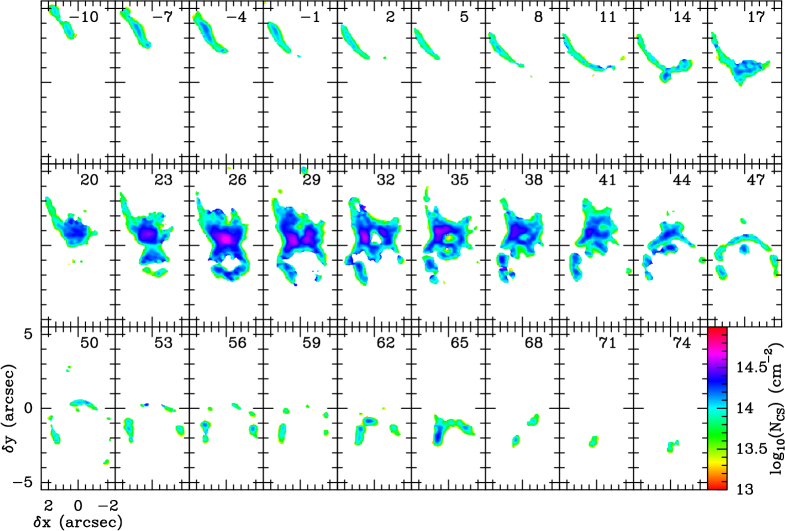
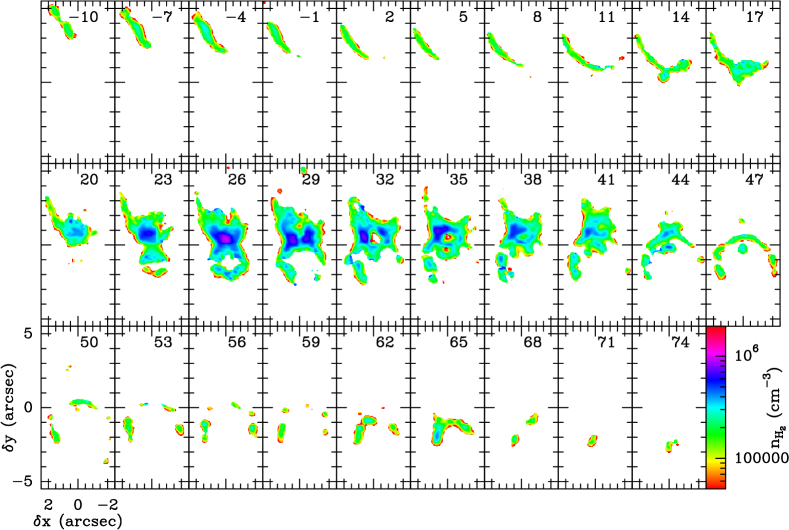
Appendix A ALMA vs. IRAM 30m line profiles


In Fig. 18, we show the profiles of representative molecular transitions mapped with ALMA (integrated over the emitting region) together with single-dish spectra obtained with the IRAM 30m telescope as part of our mm-wavelength spectroscopic survey of OH 231.8 (Velilla Prieto et al. 2015, Sánchez Contreras et al. 2015, and Velilla Prieto et al., in prep.).
The half-power beam width (HPBW) and point source sensitivity (/, i.e., the K-to-Jy conversion factor) of the IRAM-30 m data are described to a good accuracy as a function of the frequency by HPBW(″)=2460/[GHz] and =5.44+(, respectively, according to measurement updates performed in August 2013111111http://www.iram.es/IRAMES/mainWiki/EmirforAstronomers. Additional observational details on the IRAM 30m data are provided in the references above.
Appendix B Velocity-channel maps
Here we show velocity-channel maps of some the molecular transitions discussed in the main body of the paper that further help visualizing some of the nebular components of OH 231.8 unveiled by our ALMA observations. In particular, 13CO (=3-2) and CS (6-5) emission maps of the central (3″4″) regions in the LSR velocity range where the small-scale hourglass that surrounds the compact SiO outflow is showing up (=[18-52] km s-1) – Fig.19 and Fig.20, respectively. Velocity-channel maps of the OCS (25-24) transition in a similar (somewhat narrower) range are plotted in Fig. 21. This transition selectively traces the dense equatorial waist of both the large-scale and the small-scale hourglass nebula (dubbed as the large hg and mini-hg, respectively). See Sections 4.3 and 4.4.1 for additional details on these nebular components.