Can Stellar Discs in a Cosmological Setting Avoid Forming Strong Bars?
Abstract
We investigate the connection between the vertical structure of stellar discs and the formation of bars using high-resolution simulations of galaxies in isolation and in the cosmological context. In particular, we simulate a suite of isolated galaxy models that have the same Toomre parameter and swing amplification parameter but that differ in the vertical scale height and velocity dispersion. We find that the onset of bar formation occurs more slowly in models with thicker discs. Moreover, thicker discs and also discs evolved in simulations with larger force softening also appear to be more resilient to buckling, which acts to regulate the length and strength of bars. We also simulate disc-halo systems in the cosmological environment using a disc-insertion technique developed in a previous paper. In this case, bar formation is driven by the stochastic effects of a triaxial halo and subhalo-disc interactions and the initial growth of bars appears to be relatively insensitive to the thickness of the disc. On the other hand, thin discs in cosmological halos do appear to be more susceptible to buckling than thick ones and therefore bar strength correlates with disc thickness as in the isolated case. More to the point, one can form discs in cosmological simulations with relatively weak bars or no bars at all provided the discs as thin as the discs we observe and the softening length is smaller than the disc scale height.
keywords:
methods:numerical - galaxies: formation - galaxies: kinematics and dynamics - cosmology: theory1 INTRODUCTION
The problem of bar formation in disc galaxies tests our understanding of cosmological structure formation and galactic dynamics. In principle, theories of galaxy formation should yield predictions for the fractional distribution of bars in terms of their strength, length, and pattern speed. While it is often difficult to make precise, quantitative statements about bars from observations, general properties of their distribution have emerged (See Sellwood & Wilkinson (1993), Sellwood (2013) and Binney & Tremaine (2008) for reviews). Roughly 30-40 per cent of disc galaxies exhibit strong bars, that is bars that dominate the disc luminosity. Another 20 per cent or more have relatively weak bars. The bar fraction appears to increase with time. Approximately one tenth of disc galaxies between have visually identifiable strong bars, which is a factor of 3-4 smaller than the fraction in the local Universe (see Simmons et al. (2014) and references therein). The bar fraction also varies with galaxy type. Masters et al. (2010) find that per cent of the so-called passive red spirals have bars as compared to a per cent bar fraction for blue spirals. Since the red spirals are interpreted as old galaxies that have used up their star-forming gas, this result is consistent with a bar fraction that increases with time. The upshot of these observations is that in terms of bars, disc galaxies in the local Universe divide into three roughly equal bins: those with strong bars, those with weak bars, and those with no detectable bar. These observations suggest that bars are capable of forming at a wide range of cosmic times, but once formed, are difficult to destroy.
Intuition tells us that properties of a bar should depend on the properties of its host galaxy and the environment in which that galaxy lives. Theoretical arguments indicate that cold, thin discs are susceptible to local “Toomre” instabilities. Furthermore, discs that are strongly self-gravitating, that is discs that contribute the bulk of the gravitational force required to maintain their rotational motion, are susceptible to global instabilities. Thus, one can construct initially axisymmetric galaxy models that form bars with vastly different properties (or no bars at all) by changing the internal disc dynamics or trading off disc mass for bulge and halo mass. The implication is that the distribution of bars provides an indirect means for inferring a disc’s kinematics and mass-to-light ratio as well as the distribution of mass in a galaxy’s dynamically “hot” components, namely its bulge and dark matter halo.
A galaxy’s ability to resist local instabilities is typically expressed in terms of the (kinetic) Toomre -parameter (Toomre, 1964) while its ability to resist global instabilities is encapsulated in the swing-amplification -parameter (Goldreich & Tremaine, 1978, 1979). Both parameters are defined so that large values imply a more stable disc. The hypothesis that they determine a galaxy’s susceptibility to bar formation has been tested by simulations of isolated, idealized galaxy models (Ostriker & Peebles, 1973; Zang & Hohl, 1978; Combes & Sanders, 1981; Sellwood, 1981). Typically, the initial galaxy is represented by an N-body (Monte Carlo) realization of an equilibrium solution to the collisionless Boltzmann equation comprising a disc, dark matter halo, and often, a bulge. Equilibrium does not imply stability, and a galaxy can develop spiral structure and a bar through instabilities that are seeded by shot noise (Efstathiou et al., 1982) and amplified by feedback loops such as swing amplification (Sellwood, 2013). A common way to suppress the mechanisms which give rise to these effects is by increasing either or . For example, in dynamically warm discs (that is, discs with high ) perturbations are randomized on timescales short enough to prevent the feedback loop from starting (Athanassoula & Sellwood, 1986). Likewise, submaximal discs, that is, discs with high , avoid the bar instability presumably because the disc lacks the self-gravity to drive the bar instability (Efstathiou et al., 1982; Christodoulou et al., 1995; Sellwood, 2013).
As one might imagine, the parameters and do not uniquely describe a galaxy’s susceptibility to bar formation. Widrow et al. (2008) present a grid of models in the plane that all satisfy observational constraints for the Milky Way. These simulations confirm the basic notion that susceptibility to instabilities increases with decreasing and . However, a careful study of bar strength and length as a function of time across these simulations suggests a more complicated picture. In particular, the bar strength is not a perfectly monotonic function of at fixed or vice versa. The implication is that additional parameters are required to fully predict how bar formation will proceed from some prescribed initial conditions. In short, bar formation may proceed very differently within a family of models that have the same and but vary in other ways.
One property of a disc not captured by either or is its thickness, or alternatively, its vertical velocity dispersion. (The Toomre parameter depends only on the radial velocity dispersion.) Klypin et al. (2009) use a suite of simulations to demonstrate that the thickness of the disc plays a profound role in the development of a bar. In particular, their thick disc model forms a stronger and more slowly rotating bar as compared with the bar that forms in a thin disc model with the same initial radial dispersion profile and rotation curve decomposition. Moreover, simulation parameters such as mass resolution and time step also influence the growth of the bar instability and slowdown of the bar due to angular momentum transfer with the dark halo (Dubinski et al., 2009).
Of course, galaxies are neither isolated nor born as axisymmetric, equilibrium systems. In these idealized systems, instabilities can only come from shot noise, whereas this is is not true in a complicated dynamical environment. As such, bar formation may be very different in idealized galaxies as compared with galaxies in a cosmological setting. For example, halo substructure in the form of satellite galaxies and dark matter subhaloes can pass through and perturb the disc. Gauthier et al. (2006), Kazantzidis et al. (2008), and Dubinski et al. (2009) showed that an apparently stable disc galaxy model can develop a bar when a fraction of the “smooth” halo is replaced by substructure in the form of subhaloes. The effect is stochastic; subhalo-triggered bar formation seems to require subhaloes whose orbits take them into the central regions of the disc in a prograde sense. More recently, Purcell et al. (2011) showed that Sagittarius dwarf alone could have been responsible for the Milky Way’s spiral structure and bar.
Cosmological haloes also possess large-scale time-dependent tidal fields, which impart torques to the disc and cause it to precess, nutate, and warp (Dubinski & Kuijken, 1995a; Binney et al., 1998; Dubinski & Chakrabarty, 2009; Bauer et al., 2018). In turn, stellar discs can reshape the inner parts of the dark matter haloes via adiabatic contraction and dynamical friction (Blumenthal et al., 1986; Ryden & Gunn, 1987; Dubinski, 1994; Dubinski & Kuijken, 1995b; DeBuhr et al., 2012; Yurin & Springel, 2015; Bauer et al., 2018). In principle, one can turn to ab initio hydrodynamic cosmological simulations to capture the effects of both triaxiality and substructure. Indeed, galaxy formation studies in the cosmological environment that include the formation of supermassive black holes, stars, and the feedback from these objects on galaxy formation have had remarkable success over the last decade (See, for example Vogelsberger et al. (2013); Schaye et al. (2015)). Unfortunately, feedback techniques are extremely computationally expensive. Moreover, the simulator cannot control the properties of the disc such as its mass and radial scale length that form within a particular haloes. This restriction makes it difficult to explore the “nature vs. nurture” question: Do bars reflect the structure of their host galaxy, substructure interactions of the disc’s lifetime, or large-scale tidal fields from the dark halo?
Techniques developed by Berentzen & Shlosman (2006), DeBuhr et al. (2012), Yurin & Springel (2015), Bauer et al. (2018) and others allow one to insert a collisionless disc into a dark matter halo. These techniques provide a compromise between fully cosmological simulations and simulations of isolated galaxies. In general, the first step is to run a pure dark matter simulation of a cosmological volume and select a halo suitable for the galaxy one intends to study. The simulation is then rerun with a rigid disc potential that is adiabatically grown from some early epoch (say redshift ) and an intermediate one (say ). Doing so allows the halo to respond to “disc formation”. At the intermediate redshift, a suitable N-body disc that is approximately in equilibrium is swapped in for the rigid disc potential and the simulation continues, now with live disc and halo particles.
Perhaps the most striking and perplexing result to come from recent disc-insertion simulations is the prevalence of strong bars. Yurin & Springel (2015), for example, find that all of the discs in their bulge-less simulations for strong bars even though some of these discs are decidedly submaximal. In addition, over half of the discs in simulations with classical bulges form strong bars. Their results suggest that discs in the cosmological setting are more prone to forming strong bars and that bulges play an essential role in explaining the presence of disc galaxies with weak bars or no bars at all.
Though the Yurin & Springel (2015) models vary in and they share two important properties. First, the ratio of the radial and vertical velocity dispersion is set to unity throughout the disc. Second, the ratio of the vertical and radial scale lengths is fixed at , which is roughly a factor of two larger than that of the Milky Way’s thin disc. In addition, the softening length in their simulations is fixed at . Thus, the discs in their simulations are thicker and (vertically) warmer than what one might expect for Milky Way-like galaxies. The results from Klypin et al. (2009) suggest that these properties rather than (or together with) halo substructure and triaxiality are responsible for the preponderance of strong bars in the Yurin & Springel (2015) models.
In this paper, we attempt to isolate the different effects that determine whether a galaxy forms a strong bar, a weak one, or no bar at all. The core of the paper is a a sequence of N-body simulations that include simulations of isolating disc galaxies and galaxies in cosmological haloes. Our choice of models is meant to complement those of Yurin & Springel (2015). In particular, we choose models that have the same and but that vary in their vertical structure.
We begin in section §2 by discussing the dimensionless parameters that arise when one constructs equilibrium disc galaxy models. These include the aforementioned and parameters as well as the ratio of the vertical and radial velocity dispersion and the ratio of the vertical and radial scale lengths. We also discuss possible effects of gravitational softening. In 3 we describe our sequence of simulations and discuss how they fit in with previous work. We discuss results for our isolated galaxy simulations in §4 and our cosmological ones in §5. We conclude with a discussion of the implications of our results in §6.
| A.I | 3.49 | 2.50 | 216 | 25.3 | 0.10 | 1.27 | 2.34 | 1.00 | 0.14 | 0.15 |
|---|---|---|---|---|---|---|---|---|---|---|
| A.II | 3.49 | 2.50 | 216 | 25.3 | 0.10 | 1.27 | 2.34 | 1.00 | 0.14 | 0.50 |
| B.I | 3.49 | 2.50 | 213 | 25.3 | 0.20 | 0.97 | 2.34 | 1.00 | 0.28 | 0.15 |
| B.II | 3.49 | 2.50 | 213 | 25.3 | 0.20 | 0.97 | 2.34 | 1.00 | 0.28 | 0.50 |
| C.I | 3.49 | 2.50 | 208 | 25.3 | 0.40 | 0.77 | 2.34 | 1.00 | 0.50 | 0.15 |
| C.I.Ag | 3.49 | 2.50 | 216 | 25.3 | 0.40 | 0.77 | 2.34 | 1.00 | 0.50 | 0.15 |
| D.IV | 5.82 | 3.70 | 245 | 25.2 | 0.10 | 1.14 | 2.45 | 1.00 | 0.29 | 0.18 |
| E.IV | 5.82 | 3.70 | 245 | 27.4 | 0.25 | 0.72 | 2.45 | 1.00 | 0.73 | 0.74 |
| YS15.A5 | 5.00 | 3.00 | 263 | 30.7 | 0.2 | 1.00 | 3.22 | 1.38 | 0.21 | 0.68 |
| YS15.B5 | 5.00 | 3.00 | 211 | 26.6 | 0.2 | 1.00 | 2.06 | 0.96 | 0.11 | 0.68 |
| YS15.C5 | 5.00 | 3.00 | 270 | 30.3 | 0.2 | 1.00 | 3.31 | 1.42 | 0.23 | 0.68 |
| YS15.D5 | 5.00 | 3.00 | 236 | 26.6 | 0.2 | 1.00 | 2.58 | 1.12 | 0.16 | 0.68 |
| YS15.E5 | 5.00 | 3.00 | 233 | 27.1 | 0.2 | 1.00 | 2.58 | 1.11 | 0.15 | 0.68 |
| YS15.F5 | 5.00 | 3.00 | 219 | 27.0 | 0.2 | 1.00 | 2.22 | 1.02 | 0.11 | 0.68 |
| YS15.G5 | 5.00 | 3.00 | 227 | 28.2 | 0.2 | 1.00 | 2.45 | 1.09 | 0.13 | 0.68 |
| YS15.H5 | 5.00 | 3.00 | 244 | 28.6 | 0.2 | 1.00 | 2.85 | 1.21 | 0.16 | 0.68 |
| G06 | 7.77 | 5.57 | 226 | 17.1 | 0.06 | 1.80 | 2.78 | 1.43 | 0.10 | 0.15 |
2 THEORETICAL CONSIDERATIONS
In this section, we consider the structural properties of disc-halo models with an eye toward understanding the formation of bars in these systems. We begin with the and parameters and then discuss the vertical structure of the disc as defined by its scale height, vertical velocity dispersion, and surface density. Finally, we consider the effect softening might have on bar formation.


2.1 and
The stability of a stellar disc is generally thought to be determined by the Toomre- parameter (Toomre, 1964)
| (1) |
| (2) |
where is the Galactocentric radius of a cylindrical coordinate system, is the surface density of the disc, is the radial velocity dispersion of the disc, and is the azimuthal mode number. The epicyclic radial frequency is given by
| (3) |
where is the circular speed. We assume an exponential disc with mass , radial scale length , and surface density
| (4) |
Note that , , , , , and are functions of . In what follows, we consider the radius at which the contribution to the rotation curve from the disc, reaches a peak value. For an exponential disc, and (Binney & Tremaine, 2008).
Roughly speaking, describes the susceptibility of a disc to local instabilities. Cold discs with low velocity dispersion and are unstable to local perturbations. On the other hand, describes the vigour with which a global perturbation with an -fold azimuthal symmetry undergoes swing amplification. Since we are interested in bar formation, we set and note that is a measure of disc self-gravity. To see this, we use Eq. (4) and the expression for to find
| (5) |
where we have assumed that the logarithmic derivative in Eq.(3) is zero.
For simplicity, we define
| (6) |
Therefore when the contribution of the disc to the circular speed curve at its peak is equal to the combined contributions of the dynamically hot components, namely the bulge and halo. Following Efstathiou et al. (1982), Yurin & Springel (2015), use where is the maximum circular speed. If we assume that , then and the stability criterion from Efstathiou et al. (1982), , becomes .
2.2 Vertical Structure of Stellar Discs
As discussed in Klypin et al. (2009) the vertical structure of a stellar disc plays a key role in determining the properties of any bar that forms. In general, the vertical structure is characterized by the vertical velocity dispersion , surface density , and scale height. For a self-gravitating plane-symmetric isothermal disc these quantities are connected through the relation where is the root mean square distance of “stars” from the midplane. (Spitzer, 1942; Camm, 1950).
We can incorportate the effects of dark matter by modifying the Poisson equation
| (7) | ||||
where and are the densities of the disk and halo, respectively, and is the density of the disc in the midplane. In the second line we assume, as is done in the pure self-gravitating case, that the disc stars are vertically isothermal with velocity dispersion . We also assume that the halo density is constant in the region of the disc. We then solve Eq. 7 numerically. The result is well-described by the relation
| (8) |
where the factor provides a simple interpolation between the pure self-gravitating case and the case where disc particles are test particles in the (harmonic) potential of a constant density halo. As discussed in the next section Eq. 8 holds at the 10 per cent level for our equilibrium models. Departures from Eq. 8 might come from radial gradients and the rotation of the disc. (See, for example, Read (2014)).
| (9) |
This expression can be interpreted in several ways. First, if the ratios of to and to are fixed, then there is a linear relation between and . On the other hand, if one considers a family of models in which the only variation is in the vertical structure of the disc, then the scale height varies roughly linearly with the vertical velocity dispersion, apart from corrections due to the contribution of the halo to the vertical force.
2.3 Effect of Gravitational Softening
Numerical effects can significantly alter the development of bars in simulated galaxies. For example, in simulations of an isolated galaxy that is initially in equilibrium, the onset of bar formation is delayed when mass resolution is increased (Dubinski et al., 2009) essentially because the bar instability is seeded by shot noise. The importance of mass resolution as well as force resolution and time stepping are also discussed in Klypin et al. (2009).
In this section, we focus on the effects of force softening. Equilibrium models, such as the ones used as initial conditions in isolated galaxy simulations, satisfy the collisionless Boltzmann and Poisson equations. When evolved with force softening, they will begin slightly out of equilibrium. This effect should be most noticeable when the softening length is comparable to or larger than the thickness of the disc. To gain some intuition as to this extent of this effect we the Poisson equation in one dimension. The potential for a mass distribution with vertical density profile of can be calculated by convolving with the Green’s function:
| (10) |
For Newtonian gravity, . For softened gravity, we replace with where is the softening length. (The motivation for this expression is as follows: Begin with a system of Plummer-softened particles, that is, a system where point-like particles are replaced by particles whose spherical density profile is proportional to . If the particles are confined to a plane, then the vertical density profile will be . The one-dimensional potential with this is indeed proportional to .) The integral Eq. 10 and the related integral for the vertical force, , can be evaluated numerically. As expected, the potential energy per unit area of the system, is smaller than that of the same system found assuming Newtonian gravity. Hence, a system that is set up to be in equilibrium under the assumption of Newtonian gravity, will be too “warm” for a softened gravity simulation and will “puff up”. To an excellent approximation, we find that the virial ratio between the kinetic energy per unit area and is given by where and . Roughly speaking, simulations run with a softening length equal to will have a virial ratio of .
Softening may have other effects on the development of the bar. In principle, softening should suppress the Toomre instability on small scales. However, this instability develops on scales comparable to or larger than the Jeans length, which is typically much larger than the thickness of the disc and hence larger than the softening length for most simulations. On the other hand, softening may suppress buckling, a bending instability, which is strongest on small scales. As discussed below, buckling appears to be responsible for regulating the growth of bars.
3 MODELS AND SIMULATIONS
3.1 Initial Conditions for Isolated Galaxy Simulations
We follow the evolution of isolated disc-halo systems using the N-body code gadget-3 (Springel, 2005). The initial conditions for most of our isolated galaxy simulations are generated with GalactICS (Kuijken & Dubinski, 1995; Widrow et al., 2008), which allows users to build multicomponent, axisymmetric equilibrium systems with prescribed structural and kinematic properties. Disc particles are sampled from a distribution function (DF) that is a semi-analytic function of the total energy , the angular momentum about the disc symmetry axis , and the vertical energy , where is the gravitational potential and is an orbit’s vertical velocity. By design, the disc DF yields a density law in cylindrical coordinates given, to a good approximation, by . Here is exponential surface density profile (Eq. 4) and is the scale height. Note that while the “half-mass” scale height used in Yurin & Springel (2015) is given by . The disc DF is also constructed to yield a radial velocity dispersion profile that is exponential in with scale length . The halo DF is designed to yield a truncated NFW profile (Navarro et al., 1997) as described in Widrow et al. (2008).
While used in the GalactICS disc DF is conserved to a good approximation for nearly circular orbits it varies considerable for stars that make large excursions in and . Thus, the initial conditions for “thick” or “warm” discs will not represent true equilibrium solutions to the dynamical equations. To test whether non-conservation of vertical energy affects our results, we compare a thick disc model with GalactICS initial conditions with a similar one where the initial conditions are generated with AGAMA (Vasiliev, 2018). In principle, this action-based code should yield initial conditions that are closer to a true equilibrium system than ones based on especially for thick discs.
3.2 Description of simulations
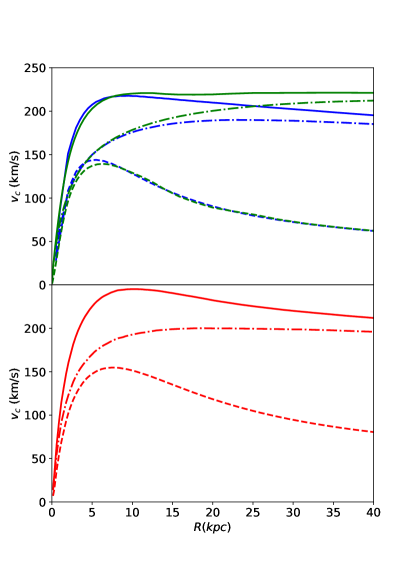
In this section, we describe a suite of simulations where and are fixed and where the velocity dispersion and scale length ratios are allowed to vary. Our aim is to test the hypothesis that scale height plays a key role in the development of bars. The parameters for our simulations are summarized in Table 1. Our suite of isolated galaxy simulations form a sequence A, B, C in increasing thickness. The models have the same rotation curve decomposition, which is shown in the top panel of Fig. 1. By design, the contribution to the rotation curve from the disc is slightly below that of the halo at . Therefore our models have slightly greater than and should be susceptible to global instabilities.
The fiducial simulations are run with a softening length of , which is about two thirds of the scale height of our thinnest model (A.I). The simulations A.II and B.II use a softening length of , which is close to the value assumed in Yurin & Springel (2015). The simulation C.I.Ag is similar to C.I (large scale height) but run with AGAMA initial conditions. A comparison of its rotation curve decomposition with that for model C.I is shown in the top panel of Fig. 1. The contributions from the disks in the two models are nearly the same and the contributions from the halos differ significantly only beyond . The simulations A.III and B.III use a scheme to isotropize vertical motions and effectively shut off buckling and are discussed in §4.4.
In addition to these isolated galaxy simulations we run two cosmological simulations using the disc insertion scheme described in Bauer et al. (2018). The initial conditions for these models, labeled D.I and E.II, are identical except for the vertical scale height and softening length, which are larger in E.II. Thus, these models are cosmological analogs to A.I and B.II. The rotation curves for these models are shown in the bottom panel of Fig. 1. The models themselves are discussed in Section §5.
3.3 Comparison with Previous Work
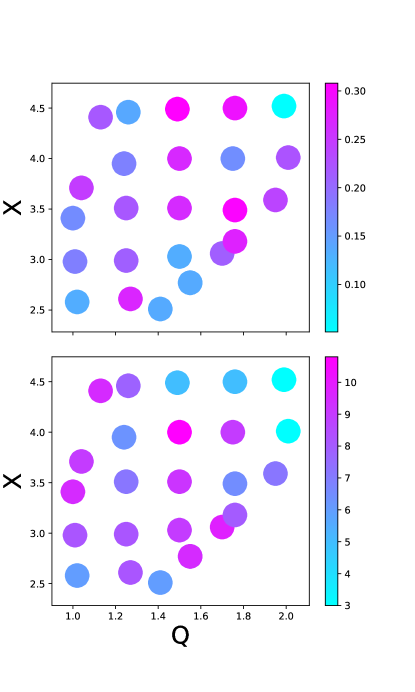
While the parameters and allow one to predict the rapidity and vigour with which instabilities develop in disc galaxies that are actually imperfect predictors of the strength and length of bars at late times. The point is illustrated in Widrow et al. (2008) where results for a suite of 25 simulations that explore the plane are presented. By design, the initial conditions for the models satisfy observational constraints for the Milky Way such as the rotation curve, the local vertical force, and the velocity dispersion toward the bulge. (See Hartmann et al. (2014) for a further analysis of these simulations.) As expected, the onset of the bar instability is delayed in models with large initial values for and/or . However, the dependence on these parameters of the bar strength and length is more complicated. In Fig.4 we show the bar strength parameter and length of the bar across these models. Evidently, the models that form the strongest and longest bars have intermediate values of and . The implication is that models where the instabilities grow too quickly lead to weaker and somewhat shorter bars. Bar formation appears to be a self-regulating process.
Table 1 gives the relevant parameters for the eight disc-halo models from Yurin & Springel (2015) as well as the disc-bulge-halo model for M31 from Gauthier et al. (2006). In the Yurin & Springel (2015) simulations discs are inserted into dark matter haloes from the cosmological Aquarius simulation. In this respect, they are similar to the disc-insertion simulations described in Section §5. The initial discs in these models all have a scale height to scale length ratio of and a radial to vertical velocity dispersion ratio of . As discussed above, these choices mean that their discs were chosen from a one-parameter family of models within the parameter space.
4 ISOLATED GALAXY SIMULATIONS
4.1 Morphology of Bar Forming Galaxies
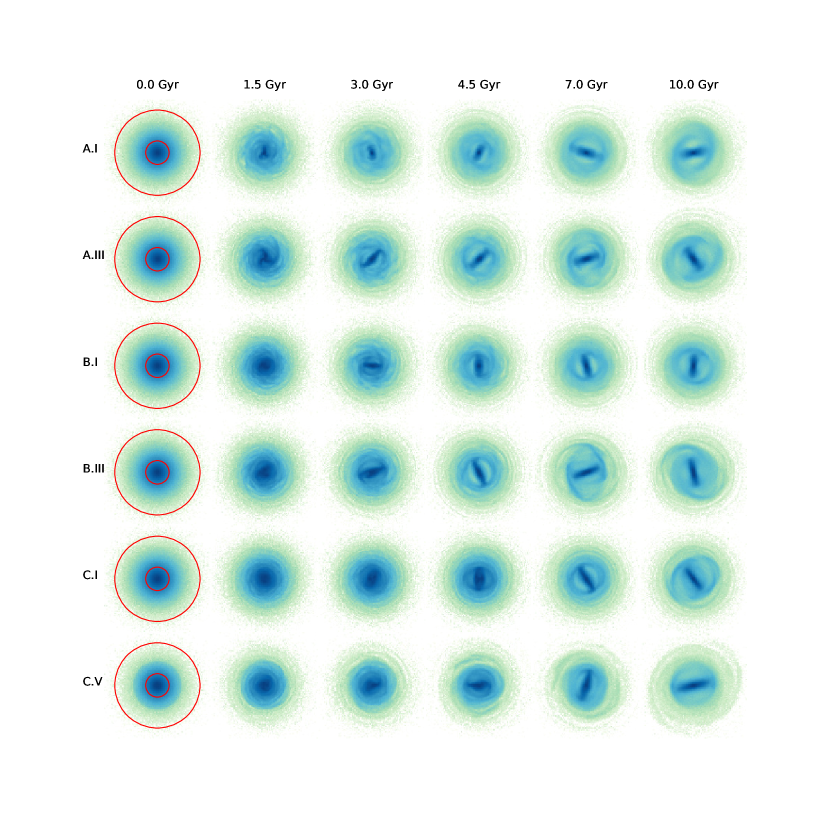
Face on surface density maps for models A.I, A.II, B.I, B.II, C.I, and C.I.Ag are shown in Fig. 5. All discs form bars by the end of the simulation (). However, bar formation appears to be delayed in models B.I and C.I relative to that in model A.I while the final bar in A.I is shorter than those in B.I and C.I. Other features are also evident. These include two-armed spiral structure, most clearly seen in A.I and B.III and elliptical rings, as, for example, in C.I.
Evidently, the dominant mode for in-plane perturbations is Nevertheless, there are strong structures in the snapshot of the A.I and A.II simulations and hints of a weak structure in the same snapshot of B.II.
A larger softening length seems to lead to stronger bars at intermediate times. We see this in the comparison of A.I and A.II or B.I and B.II in the and snapshots.
4.2 Bar strength parameter
It is convenient to think of the azimuthal distribution of particles in a given radial bin as a Fourier series. We define the coefficient of the Fourier component with -fold azimuthal symmetry to be
| (11) |
where is the mass of the -th particle and is a circularly symmetric region of the disc. The normalization is chosen so that a distribution of particles along a line through the origin will have for all even. Moreover, for a uniform distribution of particles, and for all . The amplitude and phase for the -th Fourier coefficient are given by and , respectively. Note that both of these quantities depend on the region
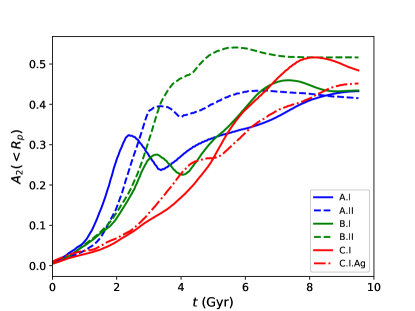
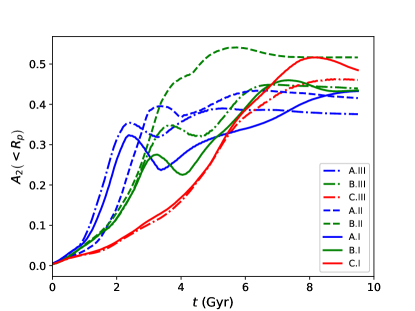
Fig. 6 shows a plot of the mean inside the radius as a function of time for the fiducial simulations, the two simulations with high softening, and the thick disc simulation with initial conditions from agama. Consider first the fiducial (low-softening) simulations. Initially, grows roughly exponentially with a growth rate that decreases with increasing thickness. In simulations A.I and B.I, the end of exponential growth is followed by a decrease in after which again increases, now, approximately linearly with time. In the thick disc case (C.I) exponential growth transitions directly to linear growth. The trend is for exponential growth to end at later times as one goes to thicker discs. It is worth noting that the value of at is similar in the three low-softening simulations.
In the thin disc case, an increase in softening appears to delay the onset of exponential growth as well as the time at which exponential growth ends. Furthermore, the drop in is less severe. Though the value of at the end of the simulation is approximately the same in the low and high softening cases, the bar strength, as measured by is larger in the high-softening case at intermediate times between and . For the intermediate thickness case (B.I and B.II) softening has little effect on the initial growth rate of . But as in the thin disc case, softening allows exponential growth to continue to later times and the final bar is about twenty per cent stronger as compared with the low-softening case. Once again we see that the effect of high softening is to produce stronger bars at intermediate times.
The evolution of for the thick disc runs with GalactICS and agama initial conditions are fairly similar. In particular, the initial growth rate is almost identical as are the final values.
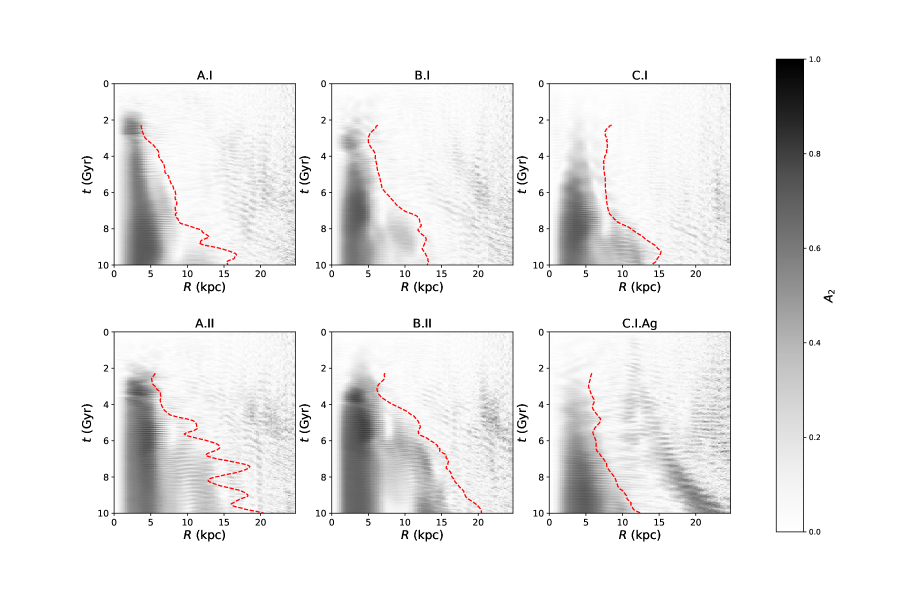
Fig. 6 encapsulates bar strength into a single number, the mean Fourier amplitude inside disc scale lengths, or about . A more complete picture of bar strength is presented in Fig. 7 where we plot as a function of and . The figure is constructed by calculating (Eq. 11) for cylindrical rings of radius . Also shown is the corotation radius, which is determined from the pattern speed and rotation curve. The former is given by a numerical estimate of ; corotation is found by determining the radius at which . Thus, since our galaxy models have roughly flat rotation curves beyond , the corotation essentially gives the inverse patter speed or pattern period.
From Fig. 6 we see that the corotation radius tends to grow with time and provides an envelope for the bar and other structures such as two-armed spirals and elliptical rings. The bar pattern speed is therefore decreasing with time, presumably due to dynamical friction between the bar and both the disc and dark halo (Debattista & Sellwood, 1998, 2000). It is worth noting that the corotation radius increases more rapidly in simulations with high softening. The naive interpretation is that softening somehow increases the frictional coupling between the bar and disc or halo particles. A more likely explanation is that with a high softening length comes stronger bars. Since the acceleration on the bar due to dynamical friction scales as the mass of the bar, stronger bars should spin down more rapidly.
As in Fig. 6 we see that bar formation is delayed in models with thicker discs. Bar formation is well underway by in A.I but doesn’t really take hold until in C.I. Moreover, the first hints of power in C.I arise further out at radii closer to .
The dip in bar strength is clearly seen between in A.I and between in B.I. As discussed below, we attribute this dip to buckling.
4.3 Vertical Structure and Velocity Dispersion
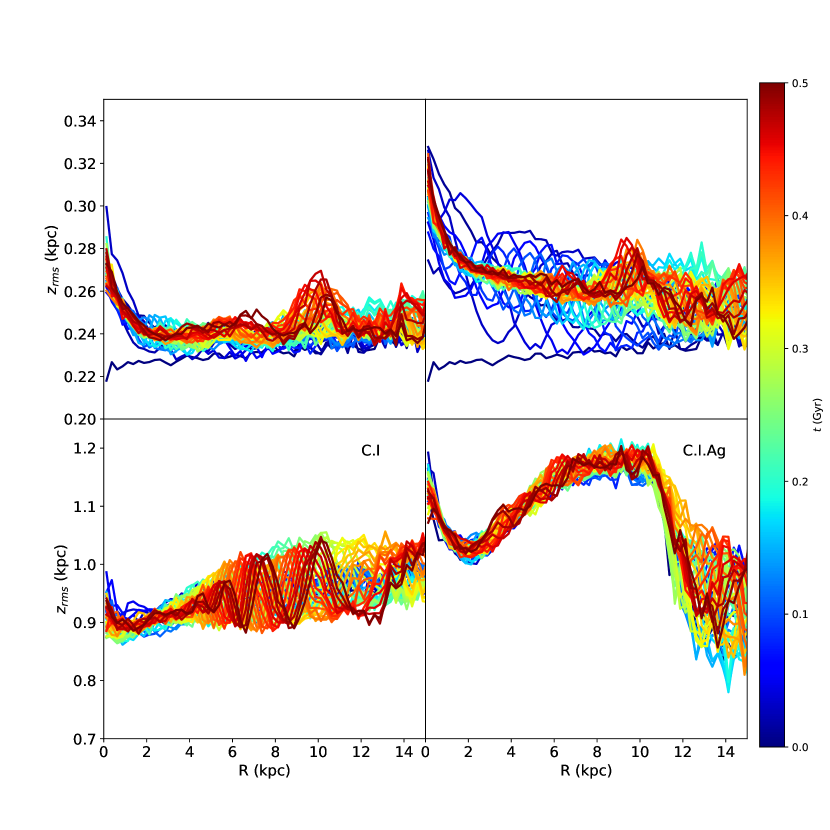
Figs. 8 and 9 show the and velocity dispersion profiles for a sequence of snapshots in various models. The first of these plots focuses on the evolution of during the initial of the simulation. The top panels show the profiles for simulations A.I and A.II and illustrate the effect softening has on the evolution from “equilibrium” initial conditions. As discussed in Section 2 as system that is initialized to be in equilibrium under the assumption of Newtonian gravity will be out of equilibrium if evolved with softened gravity. In particular, the mean potential energy will be systematically low and the system will puff up. For our thin disc model, . In the high softening case, , we estimate the virial ratio for the vertical structure to be . Of course, the excess kinetic energy will redistribute itself into both kinetic and potential energy. The upshot is that the system quickly settles into a new state with a thickness somewhat larger than the initial one as seen in the right hand panel.
The bottom panels in Fig. 8 provide a comparison of profiles for the thick disc simulations with GalactICS and agama initial conditions. We first note that is approximately constant in the C.I but varies by about in C.I.Ag. This difference is simply a reflection in how the initial conditions are set up. In both cases, the scale height depends implicitly on the functional form of the DFs, which are written in terms of either and or the actions. The GalactICS case does exhibit transient wavelike perturbations with a peak to trough amplitude of at radii . A plausible explanation for these oscillations is that they are due to the fact that is not a true constant of motion. In any case, the system quickly settles to to a new equilibrium state not too different from the initial one.
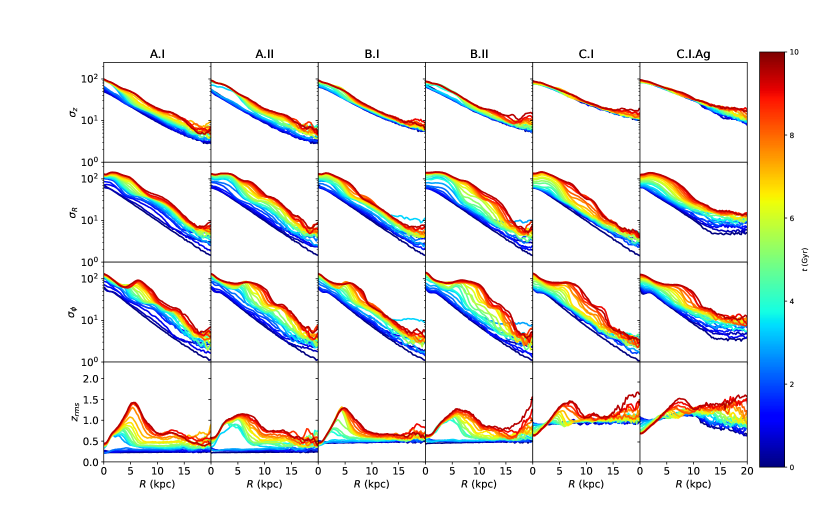
Fig. 9 shows profiles for and the diagonal components of the velocity dispersion tensor, , , and . The effect of bar formation is readily apparent in the and profiles. In simulation A.I, for example, bar formation, which begins around is accompanied by thickening and vertical heating. By the end of the simulation, increases linearly with from a central value of about to at a radius of about and then decreases beyond this radius. The evolution is similar in simulations B.I and C.I. Interestingly enough, the central and peak values are very similar in all three cases even though the initial thick of the discs are very different. Indeed, the central value for actually decreases with time in our thick disc simulation.
Vertical heating of the disc in the central regions also seems to be connected with bar formation, at least in the thin and intermediate thickness cases. In A.I, for example, the central velocity dispersion appears to increase rapidly starting around and reaching a final value of , which is roughly a factor of two larger than the initial value. As with , the value of the central vertical velocity dispersion is nearly identical in all models. Evidently, the final vertical structure of the barred disc is insensitive to initial conditions.
All models show significant in-plane disc heating across the disc and throughout the simulation. While the initial radial velocity dispersion profile is exponential in the final profile is almost flat within the central . Thus, the greatest increase in radial velocity dispersion is at about this radius, which corresponds to the end of the bar. On the other hand, the greatest increase in occurs at larger radii, closer to .
4.4 Simulations Where Buckling is Suppressed
Buckling is a well-known phenomena often seen in simulations of bar-forming galaxies where the bar bends in and out of the disc plane. Eventually, these coherent oscillations are converted to random vertical motions (Binney & Tremaine, 2008). Buckling typically leads to shorter and weaker bars (Martinez-Valpuesta & Shlosman, 2004)
To isolate the effects of buckling we implement a simple scheme that prevents the instability from taking hold. Essentially, at each timestep, we reverse the vertical components of the position, velocity, and acceleration for a fraction of disc particles. In practice, we choose though the results are insensitive to the exact value.
Fig. 10 shows the effect suppressing buckling has on the disc evolution. In the thin disc case, the bar instability develops a bit faster when buckling is suppressed. More importantly, the drop in seen in simulation A.I is not as strong, thus confirming the notion that buckling regulates the strength of bars. Buckling has a similar effect on our intermediate thickness runs. Furthermore, the effect of suppressing buckling is similar, in some respects, to the effect of increasing softening as can be seen by noting similarities between A.II and B.III. Finally, we note that buckling doesn’t appear to occur in our thick disc simulations.
5 COSMOLOGICAL SIMULATIONS
Disc galaxies simulated from axisymmetric, equilibrium initial conditions, as was done in the previous section, form bars at rates and with strengths that depend on their intrinsic scale height of the disc and on the force resolution of the simulation. In this section, we investigate the extent to which these results hold in a cosmological environment. In particular we follow the evolution of a thin disc with moderate softening and a thick disc with high softening that are embedded in identical cosmological haloes.
5.1 Simulation Setup; Inserting Discs into Cosmological Haloes
We model a stellar disc in a cosmological halo using the disc insertion scheme described in Bauer et al. (2018). This scheme, which builds on the methods developed by Berentzen & Shlosman (2006), DeBuhr et al. (2012), and Yurin & Springel (2015) uses an iterative procedure to initialize the disc. The first step is to run a pure dark matter simulation and identify a suitable halo. The system is then rerun from redshift to , this time with a disc potential that grows slowly in mass and radius. Doing so allows the halo particles to respond to the gravitational field of the would-be disc. At , the rigid disc is replaced by an N-body system and the “live” disc-halo system is evolved to the present epoch.
For our pure dark matter simulation, we implement the zoom-in technique of Katz et al. (1994) and Navarro et al. (1994), broadly following the recommendations of Oñorbe et al. (2014), which allows us to achieve very high spatial and mass resolution for a single halo while still accounting for the effects of large-scale tidal fields. We choose cosmological parameters based on the results from Planck 2013 (Planck Collaboration et al., 2014) with , , , , , and . N-body initial conditions for the dark matter particles are generated with the music code (Hahn & Abel, 2013). We select a suitably-sized halo for a Milky Way-like galaxy, namely one with a mass of that comprises .
During its growth phase from to , the disc is treated as a rigid body whose orientation and center-of-mass position evolve according to the standard equations of rigid body dynamics. At , we swap a live disc for the rigid one using the GalactICS code (Kuijken & Gilmore, 1989; Widrow et al., 2008), which generates a three-integral DF disc in the best axisymmetric approximation to the halo Bauer et al. (2018).
We run two simulations, D.I, which assumes a thin disc with a softening length of and E.II, which assumes a thick disc with a softening length of . The softening length chosen for D.I is in accord with the criteria outlined in Power et al. (2003). The simulations D.I and E.II roughly correspond to A.I and B.II, respectively. As well, E.II is similar to the discs considered by DeBuhr et al. (2012), Yurin & Springel (2015) and Bauer et al. (2018), whereas D.I is more consistent with typical discs considered in isolated galaxy suites like Widrow et al. (2008).
5.2 Results
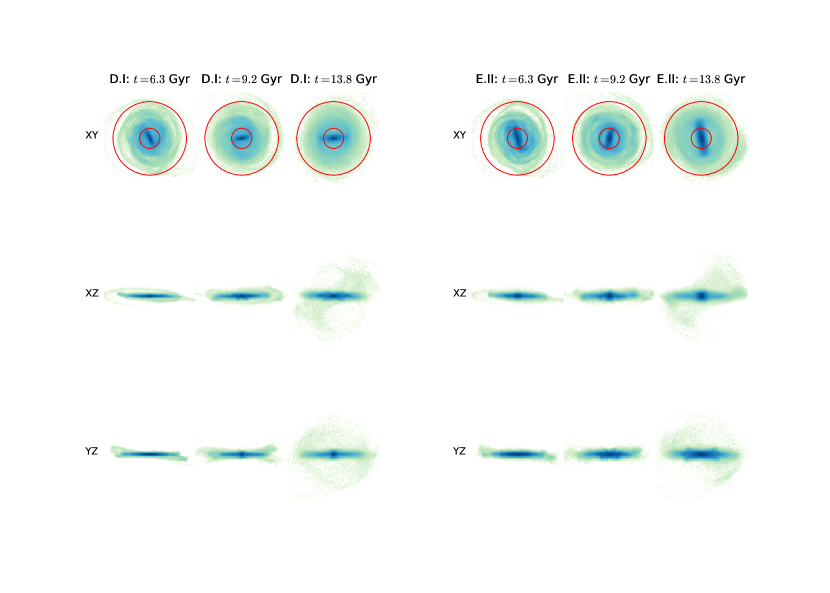
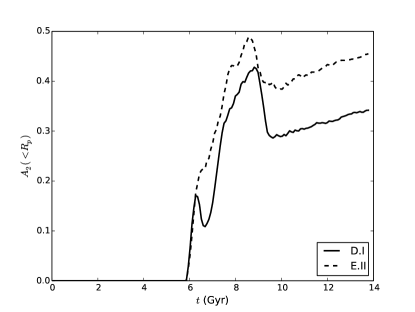
Results from our two cosmological simulations are displayed in Figs. 11 and 12. The former shows projections of the mass density at three epochs while the latter gives as a function of time. Evidently, the discs in both cases roughly follow the same evolutionary sequence that was seen in the isolated galaxy simulations: rapid growth of the bar strength followed by a period where the bar strength decreases, presumably due to buckling, and finally steady strengthening of the bar. The three epochs chosen in Fig. 11 correspond to the initial growth phase of the bar (), an epoch after buckling (), and the present epoch at . Visually, the bar appears to be stronger and longer in the E.II run than D.I one at each of these epochs but perhaps most notably in the final one. Indeed, the disc in E.II looks very similar to those seen in the simulations of DeBuhr et al. (2012), Yurin & Springel (2015), and Bauer et al. (2018). The fact that the bar in D.I is weaker than the one in E.II is consistent with the results from our isolated galaxy simulations that thicker discs produce stronger bars (See Fig. 5.
The most significant difference between bar formation in the cosmological setting and bar formation in isolated galaxies concerns the initial growth of the bar. For isolated galaxies, Fig. 6 clearly shows that the onset of bar formation is delayed for thicker discs. Conversely, in the cosmological case, rapidly grows to a value of within the first few hundred Myr after the disc “goes live” regardless of the disc thickness. At this point, the bar in the thin disc model decreases in strength with dropping to before resuming its growth. By contrast, the bar in the thick disc model continues to grow monotonically. As in the isolated galaxy simulations, self-regulating processes such as buckling are more efficient in the thin disc case and so in simulation D.I lags behind that of E.II. We note that in both cases, drops significantly at around and grows steadily thereafter.
Our interpretation of these results is as follows: In isolation, where discs start from axisymmetric initial conditions, the only source of the perturbations that drive bar formation is shot noise from the N-body distribution. Evidently, making a disc thicker slows the growth of these perturbations. On the other hand, perturbations abound in the cosmological environment where halos are clumpy and triaxial. The initial growth of the bar may, in fact, be relatively insensitive to the thickness of the disc, once discs are placed in a cosmological setting. On the other hand, disc thickness does effect the resilience of the bar to self-regulating processes, such that buckling and therefore thick discs tend to have stronger bars.
Finally, we note that in both D.I and E.II, a significant number of particles are found at high galactic latitudes. These particles represent stars “kicked-up” from the disc presumably by the large-scale tidal fields of the halo and interactions between the disc and halo substructure. Kicked-up stars have been seen in cosmological simulations by Purcell et al. (2010), McCarthy et al. (2012) and Tissera et al. (2013). Their existence was inferred in a combined analysis of kinematic and photometric data for the Andromeda galaxy (Dorman et al., 2013). Furthermore, the idea of kicked-up stars has been invoked by (Price-Whelan et al., 2015) to explain the Triangulum-Andromeda stellar clouds (Rocha-Pinto et al., 2003; Martin et al., 2014) and by (Sheffield et al., 2018) to explain the Monoceros Ring (Yanny et al., 2000; Newberg et al., 2002) and associated A13 stellar overdensity (Sharma et al., 2010).
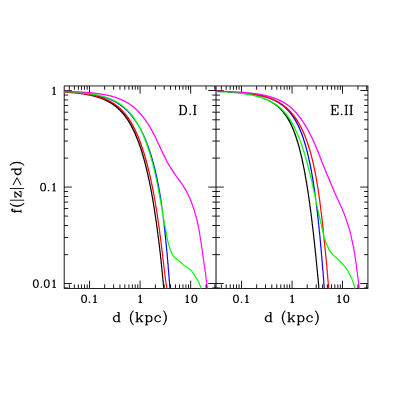
In Fig. 13 we show the fraction of stars with for different regions of the discs in our two cosmological simulations. The results are strikingly similar for the two simulations as is already evident from a visual inspection of Fig. 11. The implication is that the processes by which stellar orbits are perturbed out of the disc plane are relatively insensitive to the vertical structure of the disc. We see that very few of the stars with cylindrical radius and only of the stars between and are kicked-up to distances greater than though some stars from the region do end up with . On the other hand, of the stars from the region beyond end up with from the midplane and . Of course, the actual number of stars is certainly larger since a fraction of the kicked-up stars will be passing through the disc with large vertical velocities.
6 CONCLUSIONS
The seminal work of Ostriker & Peebles (1973) introduced the notion that disc dynamics provides a powerful constraint on the structure of discs and the halos in which they reside. In short, discs that are dynamically cold and that account for a substantial fraction of the gravitational force that keeps their stars on nearly circular orbits are unstable to the formation of strong bars and spiral structure. The existence of galaxies with weak bars or no bars at all tells us that at least some discs are relatively low in mass (i.e., submaximal) and/or dynamically warm.
The theoretical analysis presented in Section 2 showed with a few simple assumptions (e.g., exponential surface density profile) one can derive a relation among the structural parameters of a disc in approximate equilibrium and thus a constraint on initial conditions that one might choose for simulations. For example, if one fixes and , as was done in Yurin & Springel (2015), then there is an approximately one-to-one relationship between and . Likewise, fixing and implies a relationship between and . These results have important implications for applying disc dynamics as a constraint on models of galaxy formation. In particular, inconsistencies between bar demographics in a galaxy formation model and in observational surveys may reflect differences in the scale height and vertical velocity dispersion of model and real galaxies.
One lesson from our work and the work of others is that the relation between structural parameters of galaxies and bar strength and length is often rather complicated. This observation is no doubt due, at least in part, to the self-regulating nature of bar formation. When bars develop rapidly, they tend to buckle, which leads to weaker and shorter bars (Martinez-Valpuesta & Shlosman, 2004). Thick discs appear to be more resilient to buckling, which may explain why bars in these models often end up stronger and longer than bars in thin-disc models (Klypin et al., 2009). For similar reasons, gravitational softening can affect the development and ultimate strength of bars.
In simulations of isolated galaxies from “pristine” equilibrium initial conditions, bar formation is seeded by the shot noise of the N-body distribution. On the other hand, bars in a cosmological environment are subjected to large perturbations including the ones that drive bar formation. Thus, the fact that bar formation is delayed in thick disc models of isolated galaxies may be purely academic — bar formation in the cosmological environment will be initiated by a variety of stochastic effects regardless of the thickness of the disc. On the other hand, the resilience of thick disks to buckling is relevant in the cosmological setting and may explain why thick disks tend to form strong bars. The upshot is that a proper understanding the distribution of bars in cosmological models must go hand-in-hand with a proper understanding of the vertical structure of discs.
Clearly, a more exhaustive exploration of the model parameter space is in order. One might, for example, include galaxy scaling relations to further constrain the space of models. In addition, it would be of interest to insert different discs (and for that matter, nearly identical ones) into different halos in order to explore the random nature of disc-halo interactions. Ultimately, improvements in observations together with a more complete survey of models via simulations should allow us to fully exploit bars in discs as a means of testing and constraining theories of structure formation.
Acknowledgements
LMW and JB are supported by a Discovery Grant with the Natural Sciences and Engineering Research Council of Canada. JSB acknowledges the assistance of Matthew Chequers and Keir Darling in understanding the AGAMA program interface.
References
- Athanassoula & Sellwood (1986) Athanassoula E., Sellwood J. A., 1986, MNRAS, 221, 213
- Bauer et al. (2018) Bauer J. S., Widrow L. M., Erkal D., 2018, preprint, (arXiv:1801.03608)
- Berentzen & Shlosman (2006) Berentzen I., Shlosman I., 2006, ApJ, 648, 807
- Binney & Tremaine (2008) Binney J., Tremaine S., 2008, Galactic Dynamics: Second Edition. Princeton University Press
- Binney et al. (1998) Binney J., Jiang I.-G., Dutta S., 1998, MNRAS, 297, 1237
- Blumenthal et al. (1986) Blumenthal G. R., Faber S. M., Flores R., Primack J. R., 1986, ApJ, 301, 27
- Camm (1950) Camm G. L., 1950, MNRAS, 110, 305
- Christodoulou et al. (1995) Christodoulou D. M., Shlosman I., Tohline J. E., 1995, ApJ, 443, 563
- Combes & Sanders (1981) Combes F., Sanders R. H., 1981, A&A, 96, 164
- DeBuhr et al. (2012) DeBuhr J., Ma C.-P., White S. D. M., 2012, MNRAS, 426, 983
- Debattista & Sellwood (1998) Debattista V. P., Sellwood J. A., 1998, ApJ, 493, L5
- Debattista & Sellwood (2000) Debattista V. P., Sellwood J. A., 2000, ApJ, 543, 704
- Dorman et al. (2013) Dorman C. E., et al., 2013, ApJ, 779, 103
- Dubinski (1994) Dubinski J., 1994, ApJ, 431, 617
- Dubinski & Chakrabarty (2009) Dubinski J., Chakrabarty D., 2009, ApJ, 703, 2068
- Dubinski & Kuijken (1995a) Dubinski J., Kuijken K., 1995a, ApJ, 442, 492
- Dubinski & Kuijken (1995b) Dubinski J., Kuijken K., 1995b, ApJ, 442, 492
- Dubinski et al. (2009) Dubinski J., Berentzen I., Shlosman I., 2009, ApJ, 697, 293
- Efstathiou et al. (1982) Efstathiou G., Lake G., Negroponte J., 1982, MNRAS, 199, 1069
- Gauthier et al. (2006) Gauthier J.-R., Dubinski J., Widrow L. M., 2006, ApJ, 653, 1180
- Goldreich & Tremaine (1978) Goldreich P., Tremaine S., 1978, ApJ, 222, 850
- Goldreich & Tremaine (1979) Goldreich P., Tremaine S., 1979, ApJ, 233, 857
- Hahn & Abel (2013) Hahn O., Abel T., 2013, MUSIC: MUlti-Scale Initial Conditions, Astrophysics Source Code Library (ascl:1311.011)
- Hartmann et al. (2014) Hartmann M., Debattista V. P., Cole D. R., Valluri M., Widrow L. M., Shen J., 2014, MNRAS, 441, 1243
- Katz et al. (1994) Katz N., Quinn T., Bertschinger E., Gelb J. M., 1994, MNRAS, 270, L71
- Kazantzidis et al. (2008) Kazantzidis S., Bullock J. S., Zentner A. R., Kravtsov A. V., Moustakas L. A., 2008, ApJ, 688, 254
- Klypin et al. (2009) Klypin A., Valenzuela O., Colín P., Quinn T., 2009, MNRAS, 398, 1027
- Kuijken & Dubinski (1995) Kuijken K., Dubinski J., 1995, MNRAS, 277, 1341
- Kuijken & Gilmore (1989) Kuijken K., Gilmore G., 1989, MNRAS, 239, 571
- Martin et al. (2014) Martin N. F., et al., 2014, ApJ, 787, 19
- Martinez-Valpuesta & Shlosman (2004) Martinez-Valpuesta I., Shlosman I., 2004, ApJ, 613, L29
- Masters et al. (2010) Masters K. L., et al., 2010, MNRAS, 405, 783
- McCarthy et al. (2012) McCarthy I. G., Font A. S., Crain R. A., Deason A. J., Schaye J., Theuns T., 2012, MNRAS, 420, 2245
- Navarro et al. (1994) Navarro J. F., Frenk C. S., White S. D. M., 1994, MNRAS, 267, L1
- Navarro et al. (1997) Navarro J. F., Frenk C. S., White S. D. M., 1997, ApJ, 490, 493
- Newberg et al. (2002) Newberg H. J., et al., 2002, ApJ, 569, 245
- Oñorbe et al. (2014) Oñorbe J., Garrison-Kimmel S., Maller A. H., Bullock J. S., Rocha M., Hahn O., 2014, MNRAS, 437, 1894
- Ostriker & Peebles (1973) Ostriker J. P., Peebles P. J. E., 1973, ApJ, 186, 467
- Planck Collaboration et al. (2014) Planck Collaboration et al., 2014, A&A, 571, A16
- Power et al. (2003) Power C., Navarro J. F., Jenkins A., Frenk C. S., White S. D. M., Springel V., Stadel J., Quinn T., 2003, MNRAS, 338, 14
- Price-Whelan et al. (2015) Price-Whelan A. M., Johnston K. V., Sheffield A. A., Laporte C. F. P., Sesar B., 2015, MNRAS, 452, 676
- Purcell et al. (2010) Purcell C. W., Bullock J. S., Kazantzidis S., 2010, MNRAS, 404, 1711
- Purcell et al. (2011) Purcell C. W., Bullock J. S., Tollerud E. J., Rocha M., Chakrabarti S., 2011, Nature, 477, 301
- Read (2014) Read J. I., 2014, Journal of Physics G Nuclear Physics, 41, 063101
- Rocha-Pinto et al. (2003) Rocha-Pinto H. J., Majewski S. R., Skrutskie M. F., Crane J. D., 2003, ApJ, 594, L115
- Ryden & Gunn (1987) Ryden B. S., Gunn J. E., 1987, ApJ, 318, 15
- Schaye et al. (2015) Schaye J., et al., 2015, MNRAS, 446, 521
- Sellwood (1981) Sellwood J. A., 1981, A&A, 99, 362
- Sellwood (2013) Sellwood J. A., 2013, Dynamics of Disks and Warps. p. 923, doi:10.1007/978-94-007-5612-0_18
- Sellwood & Wilkinson (1993) Sellwood J. A., Wilkinson A., 1993, Reports on Progress in Physics, 56, 173
- Sharma et al. (2010) Sharma S., Johnston K. V., Majewski S. R., Muñoz R. R., Carlberg J. K., Bullock J., 2010, ApJ, 722, 750
- Sheffield et al. (2018) Sheffield A. A., Price-Whelan A. M., Tzanidakis A., Johnston K. V., Laporte C. F. P., Sesar B., 2018, ApJ, 854, 47
- Simmons et al. (2014) Simmons B. D., et al., 2014, MNRAS, 445, 3466
- Spitzer (1942) Spitzer Jr. L., 1942, ApJ, 95, 329
- Springel (2005) Springel V., 2005, MNRAS, 364, 1105
- Tissera et al. (2013) Tissera P. B., Scannapieco C., Beers T. C., Carollo D., 2013, MNRAS, 432, 3391
- Toomre (1964) Toomre A., 1964, ApJ, 139, 1217
- Vasiliev (2018) Vasiliev E., 2018, preprint, (arXiv:1802.08239)
- Vogelsberger et al. (2013) Vogelsberger M., Genel S., Sijacki D., Torrey P., Springel V., Hernquist L., 2013, MNRAS, 436, 3031
- Widrow et al. (2008) Widrow L. M., Pym B., Dubinski J., 2008, ApJ, 679, 1239
- Yanny et al. (2000) Yanny B., et al., 2000, ApJ, 540, 825
- Yurin & Springel (2015) Yurin D., Springel V., 2015, MNRAS, 452, 2367
- Zang & Hohl (1978) Zang T. A., Hohl F., 1978, ApJ, 226, 521