Black hole mass and spin estimates of the most distant quasars
We investigate the properties of the most distant quasars ULASJ134208.10+092838.61 (), ULASJ112001.48+064124.3 () and DELSJ003836.10-152723.6 () studying their Optical-UV emission that shows clear evidence of the presence of an accretion disk. We model such emission applying the relativistic disk models KERRBB and SLIMBH for which we have derived some analytical approximations to describe the observed emission as a function of the black hole mass, accretion rate, spin and the viewing angle. We found that: 1] our black hole mass estimates are compatible with the ones found using the virial argument but with a smaller uncertainty; 2] assuming that the virial argument is a reliable method to have a black hole mass measurement (with no systematic uncertainties involved), we found an upper limit for the black hole spin of the three sources: very high spin values are ruled out; 3] our Eddington ratio estimates are smaller than those found in previous studies by a factor : all sources are found to be sub-Eddington. Using our results, we explore the parameter space (efficiency, accretion rate) to describe the possible evolution of the black hole assuming a seed: if the black hole in these sources formed at redshift , we found that the accretion has to proceed at the Eddington rate with a radiative efficiency in order to reach the observed masses in less than Gyr.
Key Words.:
galaxies: active – (galaxies:) quasars: general – black hole physics – accretion, accretion disks1 Introduction
The existence of super-massive black holes (SMBHs) at redshifts has been confirmed by a growing number of observations (Fan et al. 2001; Barth et al. 2003; Willott, McLure & Jarvis 2003). Since the Universe was less than billion years old, their large masses () represent one of the most challenging aspects of such objects and the issue related to their rapid growth is still under debate. Several authors proposed different evolutionary scenarios (e.g. Haiman & Loeb 2001; Volonteri & Rees 2005; Li et al. 2007; Pelupessy et al. 2007; Tanaka & Haiman 2009; Li 2012). The two possible frameworks adopted to understand the evolution of SMBHs are:
-
Merging between multiple black holes (BHs) (e.g. Volonteri et al. 2003); this could have led to an accelerated growth of the black hole mass. The production of gravitational waves is important (e.g. Fig. 2 in Seoane et al. 2013) and the possible recoil effects could have slowed the BH growth down and prevented it growing to sufficiently large masses (Haiman 2004; O’Leary et al. 2006; Volonteri 2007) 111Yoo & Escude (2004) showed that the gravitational wave recoil problem can be overcome within certain conditions, making a BH grow quickly without invoking super-Eddington accretion.. A large number of black hole mergings is required to form a in a short amount of time and this could happen in a hierarchical process (Volonteri & Natarajan 2009; Seoane et al. 2013).
-
Accretion of matter onto the BH (e.g. Ruszkowski & Begelman 2003; Koushiappas et al. 2004; Volonteri & Rees 2005; Dotti et al. 2013); this process can happen in two different ways (or a combination of the two):
-
–
Chaotic accretion of ‘blobs’ of matter: this could have led to fast super-Eddington accretion with a rapid growth of the BH mass.
-
–
Accretion through a disk-like structure: this scenario leads to the production of the observed thermal UV emission222The origin of the so-called “big blue bump” emission in Active Galactic Nuclei (AGN) is still under debate and, as discussed by, for example Koratkar & Blaes (1999), there are some significant inconsistencies between the predictions of the standard disk models and observations: the broadband continuum slopes at optical/near-UV wavelengths (e.g., Neugebauer et al. 1979; Berk et al. 2001; Davis et al. 2007); X-rays and the soft X-ray excess (e.g. Pounds et al. 1986; Nandra & Pounds 1994); micro-lensing observations of the accretion disk size (e.g. Rauch & Blandford 1991).. Several authors (e.g. Shakura & Sunyaev 1973, hereafter SS; Novikov & Thorne 1973; Laor & Netzer 1989; Czerny & Zbyszewska 1991; Hubeny et al. 2000) described this emission whose features depend on different parameters like the accretion rate, the BH mass and its spin.
-
–
Both merging and accretion have an effect on the BH spin. In a BH-BH merging or a chaotic accretion scenario, objects falling onto a central BH from different directions affect its spin amplitude and orientation (e.g. Dotti et al. 2013): if this happens randomly, the expected adimensional spin value is . If the accretion occurs through a disk, the spin orientation is nearly constant and the BH eventually spins up to its maximum value after roughly doubling its mass (Bardeen 1970; Thorne 1974).333If the counteracting torque produced by the radiation emitted by the disk is taken into account, the ’canonical’ equilibrium value for the adimensional black hole spin is (Thorne 1974). This suggests that if a disk-like structure, producing the observed UV bump, is present around a BH with a coherent angular momentum for a sufficiently long time, the spin must be large. Other effects may spin the BH down, like the formation of relativistic jets through the Blandford–Znajek process (Blandford & Znajek 1977): nevertheless some authors showed that even in the presence of such process, the BH spins rapidly with (e.g. Lu et al. 1996; Wang 1998).
If accretion occurred mainly through a disk, a BH could have reached the maximum spin value in the early stage of its evolution, but this scenario alone could explain the presence of SMBHs at high redshifts only if the BH seed mass is and accreting at the Eddington rate (Li 2012). This is in contrast with what has been proposed by several authors (Volonteri & Rees 2005; Volonteri 2010; Alexander & Hickox 2011) who suggested a smaller seed mass of the order of . In the latter case, super-Eddington accretion represents a solution for the rapid growth problem. In this context, Lapi et al. (2014) showed that a BH can grow by accretion in a self-regulated regime with radiative power that can slightly exceed the Eddington limit at high redshifts: in this scenario, the radiative efficiency of the disk is , large enough to produce a significant luminosity.
In view of this discussion, the aim of our work is to estimate disk luminosity and BH mass, and to constrain the spin of the highest redshift quasars. Specifically, we focused on the three highest redshift objects known up to the end of 2018: ULASJ134208.10+092838.61 (J1342) at (Bañados et al. 2018, hereafter BN18), the second most distant quasar ULASJ112001.48+064124.3 (J1120) at , studied by Mortlock et al. (2011) (hereafter MR11), and the recent discovery DELSJ003836.10-152723.6 (J0038) at redshift (Wang et al. 2018, hereafter W18). The first quasar (QSO) is a source with a radio-loudness (Venemans et al. 2017)444The radio-loudness is defined as , where is the flux density at a specific rest-frame frequency., at the border of the radio-loud/quiet divide (); for the second one has been estimated, depending on the assumed radio spectral index (Momjian et al. 2014)555They defined the radio-loudness as , where is the luminosity density at a specific rest-frame frequency.; no radio detections are available for the third source. These sources can be classified as Type 1 QSOs, and as such we do not expect them to be strongly absorbed (by a dusty torus).
In order to estimate luminosity, mass and spin, we ’fit’ their spectral energy distribution (SED) with an accretion disk model. We call this procedure SED-fitting method. This method is widely used (e.g. Francis et al. 1991; Molendi et al. 1992; Laor & Davis 2011; Calderone et al. 2013; Sbarrato et al. 2013; Castignani & De Zotti 2015; Capellupo et al. 2015, 2016; Ghisellini & Tavecchio 2015; Castelló-Mor et al. 2016; Sbarrato et al. 2016; Majia-Restrepo et al. 2018); some of these works show a good agreement between the SED-fitting and the single epoch virial method for deriving the BH mass (e.g. Castignani et al. 2013; Castelló-Mor et al. 2016; Majia-Restrepo et al. 2018) and that motivated us to study the three sources using (relativistic) accretion disk models666The accretion disk model reliability to infer the BH mass can be verified by using BH mass estimates from the reverberation mapping (RM) technique. However, in this case a large sample of sources with good optical-UV data is needed and the uncertainties related to the scale factor , not related to the quality of data (Bentz & Katz 2015), must be taken into account..
First we use the relativistic model KERRBB (Li et al. 2005) developed to describe the radiation emitted by a thin disk around a stellar Kerr BH (Campitiello et al. 2018 - hereafter C18 - found analytic expressions practical also for SMBHs): one of the main assumptions of this model is that all the heat generated in the disk is immediately radiated away and this assumption is physically consistent only for low accretion rates (i.e. the Eddington ratio must be ; see Laor & Netzer 1989; McClintock et al. 2006, but larger than , since for smaller accretion rates the advection-dominated accretion flow regime sets in, changing the main properties of the accretion disk; Ichimaru 1977; Rees et al. 1982; Narayan & McClintock 2008). For higher accretion rate values, advection dominates over radiative energy transport in the inner parts of the disk and this latter is thought to inflate in the so-called “slim” regime (e.g. Abramowicz et al. 1988): for this reason, supposing that high-redshift quasars have gone through a phase with a large accretion rate to attain a fast growth, we compared the KERRBB results with the prediction of the slim disk model SLIMBH (i.e. Sadowski 2009; Sadowski et al. 2009; Sadowski et al. 2011; Straub, Done & Middleton 2013) 777Both these models are implemented in the interactive X-ray spectral fitting program XSPEC (see Arnaud 1996 and references therein). whose application could be more appropriate for near and slightly super-Eddington AGNs (see Koratkar & Blaes 1999). Also this model is designed for stellar mass BHs: we extended its usage for SMBHs (following the same analysis done by C18 for KERRBB) deriving some analytical approximation to describe the observed disk emission as a function of the BH mass, spin, Eddington ratio and viewing angle (see Appendix B).
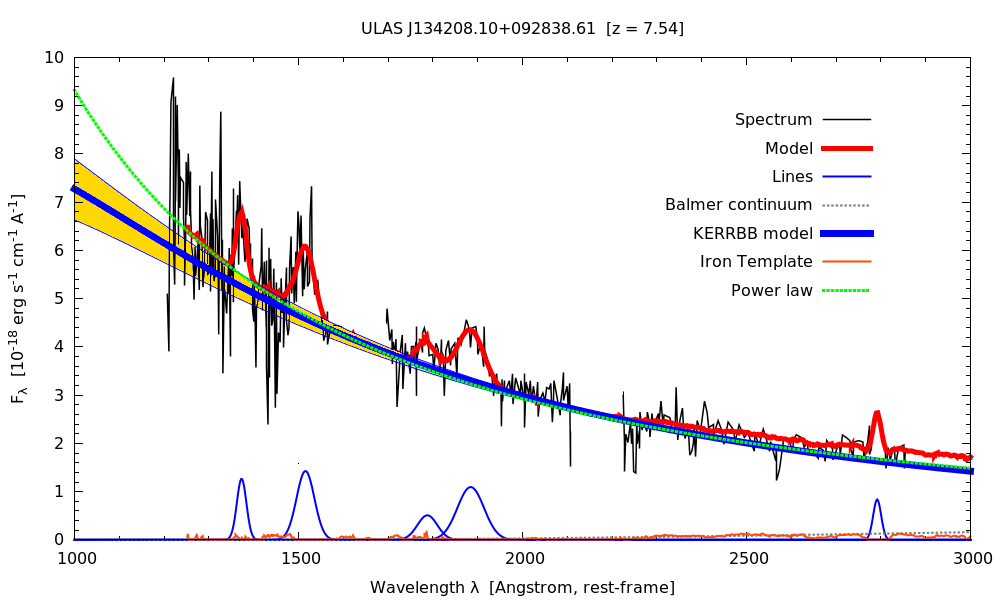
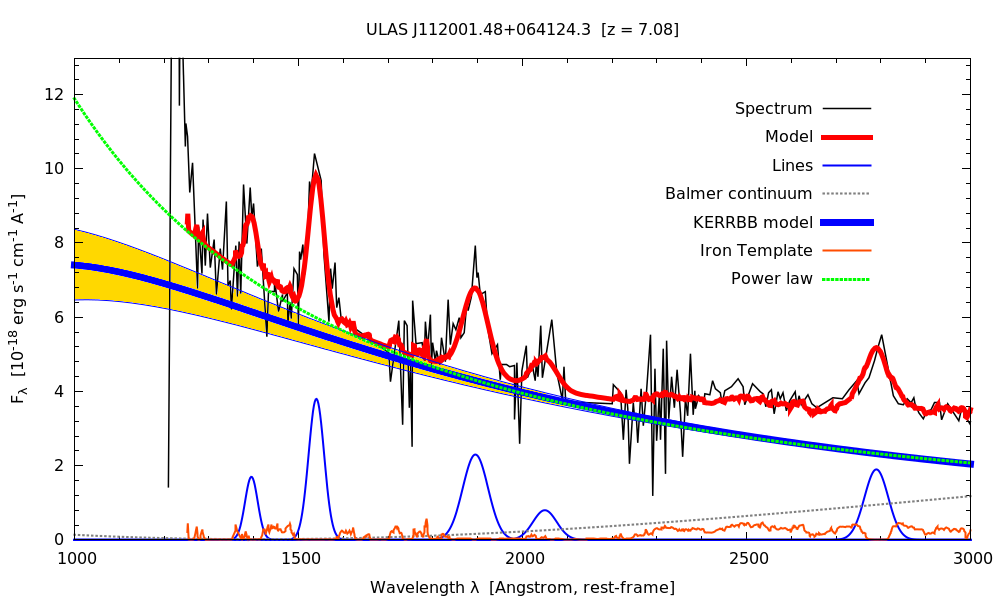
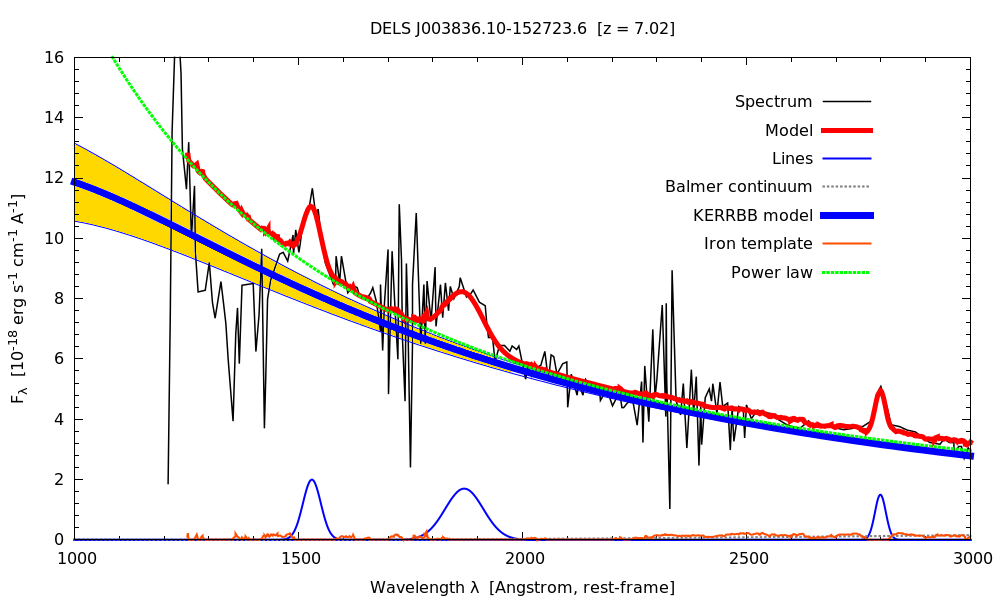
In Sect. 2 we describe the procedure adopted for the ’fitting’, discussing the possible uncertainties in the observed spectra due to various sources of absorption and emission, and estimating the consequent uncertainties on the resulting physical parameters of the fitted models. We then present the results of the fits in terms of luminosities (Sect. 2.1), BH masses (Sect. 2.2), spins (Sect. 2.3) and Eddington ratios (Sect. 2.4) and compare the findings of the Kerr versus slim disk modelling (Sect. 2.5). In Sect. 3, we discuss the possible BH evolution with different assumptions on the radiative efficiency and accretion rate. A discussion and the final conclusions are the content of Sect. 4.
In this work, we adopt a flat cosmology with km s-1 Mpc-1 and (Planck Collaboration XIII, 2015).
2 Spectral energy distribution fitting: Results
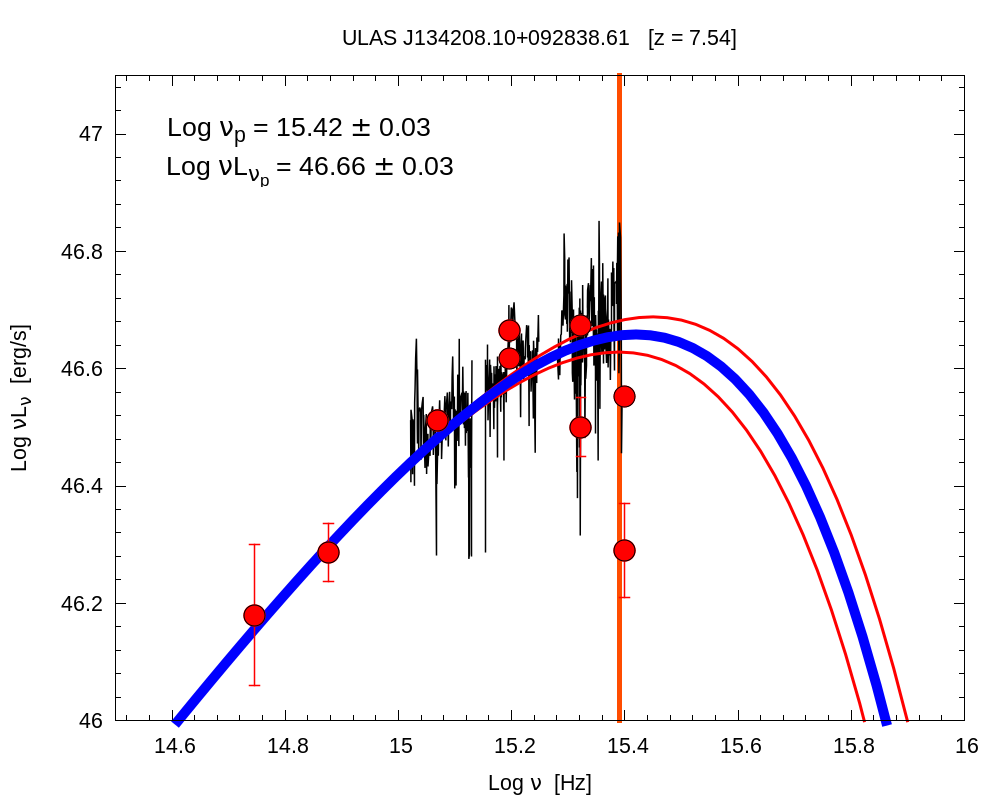
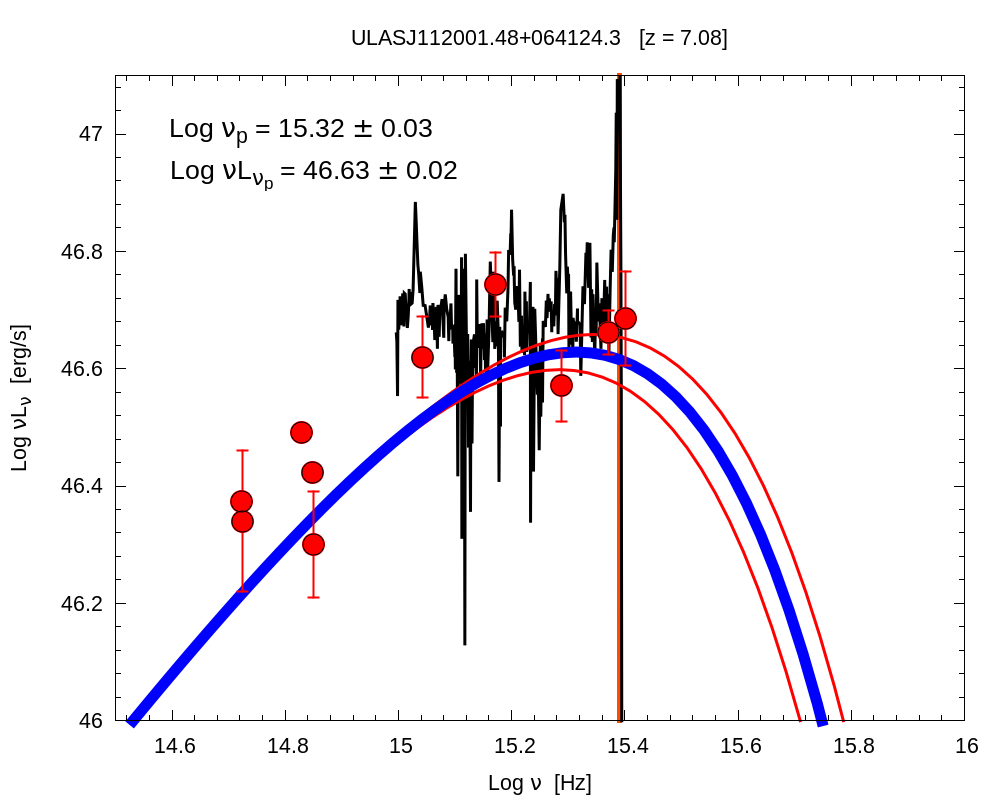
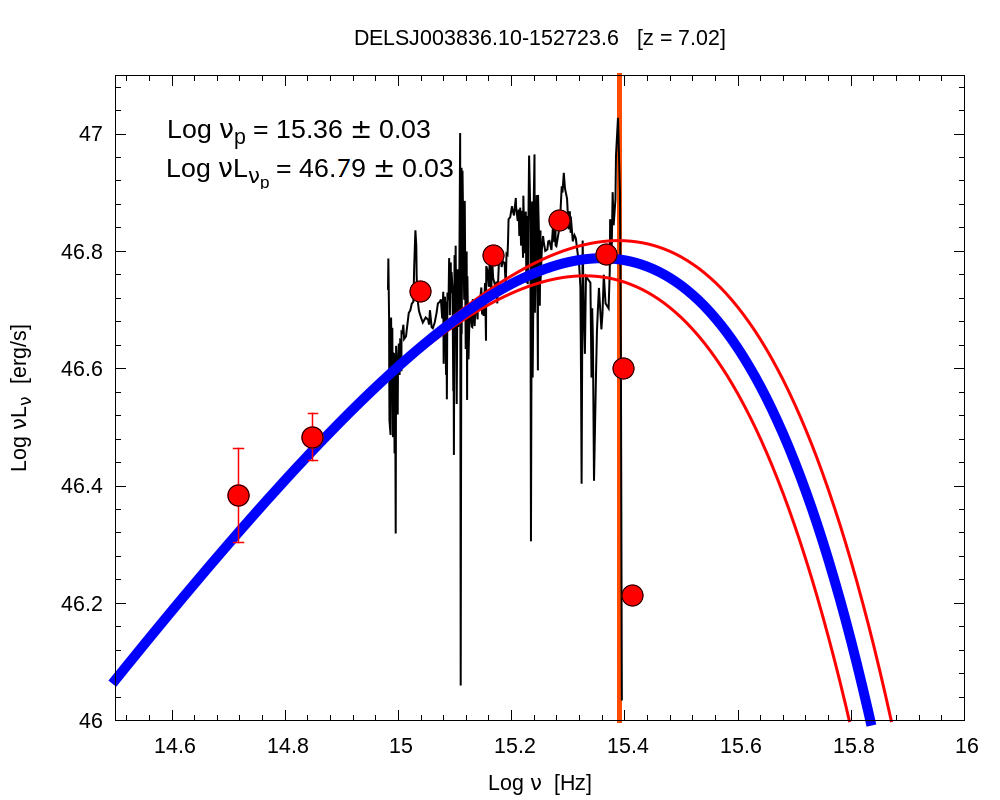
In this section, we fit the optical-UV SED of the sources J1342, J1120 and J0038 ( plot in Fig. 1; plot in Fig. 2), in order to extrapolate information about the observed disk luminosity, the BH mass, spin and Eddington ratio; then we compare the results with previous estimates. In order to infer these quantities, we interpreted the optical-UV ”bump” as the emission produced by an accretion disk around a SMBH: by adapting two relativistic models (first KERRBB and then SLIMBH) to the spectrum (black line in Figs. 1-2) we estimated the peak frequency and luminosity needed to infer all the information (see Appendix). We have associated to these last quantities an uncertainty ( dex) which defines a confidence interval (yellow area in Fig. 1 and red curves in Fig. 2). In the fit procedure we did not include photometric data (red points) and the associated uncertainties because they may be contaminated by lines emission (e.g. Ly and MgII, for J1120) and/or affected by absorption (e.g. points at Log for J1342 and J0038).
We limited our fitting to the spectral range where the uncertainties on the underlying continuum are minimized. The confidence interval of the modelling just mentioned is thus determined by the range of predicted spectra which does not alter the spectrum in such a spectral range. It is relevant to stress that the location of the spectrum peak can be estimated even if it is slightly outside the frequency range covered by data (i.e. at larger frequencies). This is because we can fit the changing curvature of the spectrum when it is approaching its peak.
In the following we discuss in some detail the effects that different phenomena (which could modify the UV spectrum) could have on the goodness of the modeling.
-
•
Intrinsic Dust Extinction: Figures 1 and 2 show the SED of the three sources without any correction from possible dust absorption: since these sources are Type 1 QSOs, we do not expect any (strong) dust absorption of the accretion disk emission from the surrounding molecular torus; the latter is thought to have an average opening angle of from the normal to the disk (see e.g. Calderone et al. 2012). For this reason we assumed an observation of these sources with a viewing angle from the normal to its accretion disk. However dust extinction could be present at a relatively low level. If corrected for dust, the spectrum becomes harder with a peak shifted at larger frequencies, increasing the disk luminosity, lowering the BH mass and increasing the Eddington ratio estimates. We checked the effect on our results by considering the extinction curves derived by Czerny et al. (2004). A self-consistency requirement for modeling the spectrum as disk emission is that the slope of the corrected, de-reddened spectrum has to be softer than the theoretical value . This translates into an upper limit for the extinction . Adopting this ”extreme” correction, the resulting disk luminosity, BH mass and Eddington ratio would change by less than a factor .
-
•
Dust Emission: This emission is mainly produced in the IR band, characterized by two significant bumps (silicate dust emission at around Hz and a hot component at around Hz; Barvainis 1987; Pier & Krolik 1993; Mor et al. 2009; Hönig & Kishimoto 2010). Therefore, the contribution by such components is not expected to affect the spectral region of the disk emission fit.
-
•
Contribution from lines: We fitted the spectrum of the three sources (Fig. 1) as a power-law continuum plus the iron complex (Vestergaard & Wilkes 2001; Tsuzuki et al. 2006), the Balmer continuum (e.g., De Rosa et al. 2014) and prominent emission lines (modeling them with a Gaussian, e.g. MgII, CIII, CIV, SiIV), using the fitting routine implemented in GNUPLOT (non-linear least-squares Marquardt-Levenberg algorithm). Then we performed the same procedure using the KERRBB model to describe the AGN continuum instead of the power law: as shown in Fig. 1, the KERRBB model overlaps well the power law for (the difference at shorter wavelengths is due to the fact that the accretion disk model is not a power law around the spectral peak). Therefore, when the contributions from lines are subtracted from the total spectrum (and even if uncertainties on the spectrum itself are taken into account)888The uncertainties are shown in Figure 1 of BN18 (gray line), MR11 (black line) and W18 (gray line): they are rather small at 1 level (the percentage uncertainty is less than )., the continuum emission is well reproduced by our KERRBB model inside our confidence interval (yellow area in Fig. 1).
-
•
Poor sky transparencies: Regions between the J-H and H-Ks bands are affected by low sky transparencies (Figs. 1-2). For J1342 these regions are not shown in the original spectrum (Bañados et al. 2018); instead, for the other two sources, these regions are visible but they are very noisy. Therefore we did not include them in the fitting procedure. Even if they were included, the fit would not change significantly because the best model is well determined by the rest of the spectrum.
-
•
IGM absorption: We considered the correction of the spectrum from the intergalactic medium (IGM) absorption (at least for the source J1342), following the reconstruction of the AGN intrinsic emission done by BN18: such correction affects only the Ly line emission band without modifying the spectrum at lower frequencies, and so without affecting our best fit.
-
•
Broad Absorption Lines: J0038 shows some absorption troughs that may have caused the high frequency part of the spectrum to be dimmer. The spectral analysis showed that the fit is not influenced by the absorption features of the spectrum; moreover, our confidence interval is in good agreement with the quasar composite spectrum constructed with SDSS quasars, compared with that of J0038 and shown in Fig. 1 of W18.
We conclude that, although the above effects can alter the spectrum, the uncertainties are mostly consistent with the estimated confidence interval of the model (corresponding to the yellow area in Fig. 1 and the two red curves reported in Fig. 2). The major uncertainty on the spectrum peak position estimates could come from dust absorption, affecting the derived disk luminosity, BH mass and Eddington ratio at most by a factor .
2.1 Observed disk luminosity
The observed disk luminosity can be estimated from the spectrum peak luminosity, .999A similar relation has been found by Calderone et al. (2013) using the classical SS model. See also C18. We found erg s-1 for J1342; erg s-1 for J1120; and erg s-1 for J0038. These values are smaller than the bolometric luminosities estimated by BN18, MR11 and W18 because their results are based on the bolometric correction (where is the luminosity at 3000 Å) 101010These bolometric estimates also take into account the luminosity contribution in the IR and X-ray bands and the bolometric correction factor has an uncertainty due to the scatter in the SEDs for individual quasars (e.g., Richards et al. 2006; Vasudevan & Fabian 2007). that overestimates the disk luminosity by a factor (Calderone et al. 2013). It is important to point out that the observed disk luminosity is different with respect to the total disk luminosity (spin dependent) by a factor if one considers a SS model (Calderone et al. 2013), or by a factor depending on the viewing angle and the BH spin if one considers the KERRBB/SLIMBH model (see C18).
2.2 Black hole mass estimates
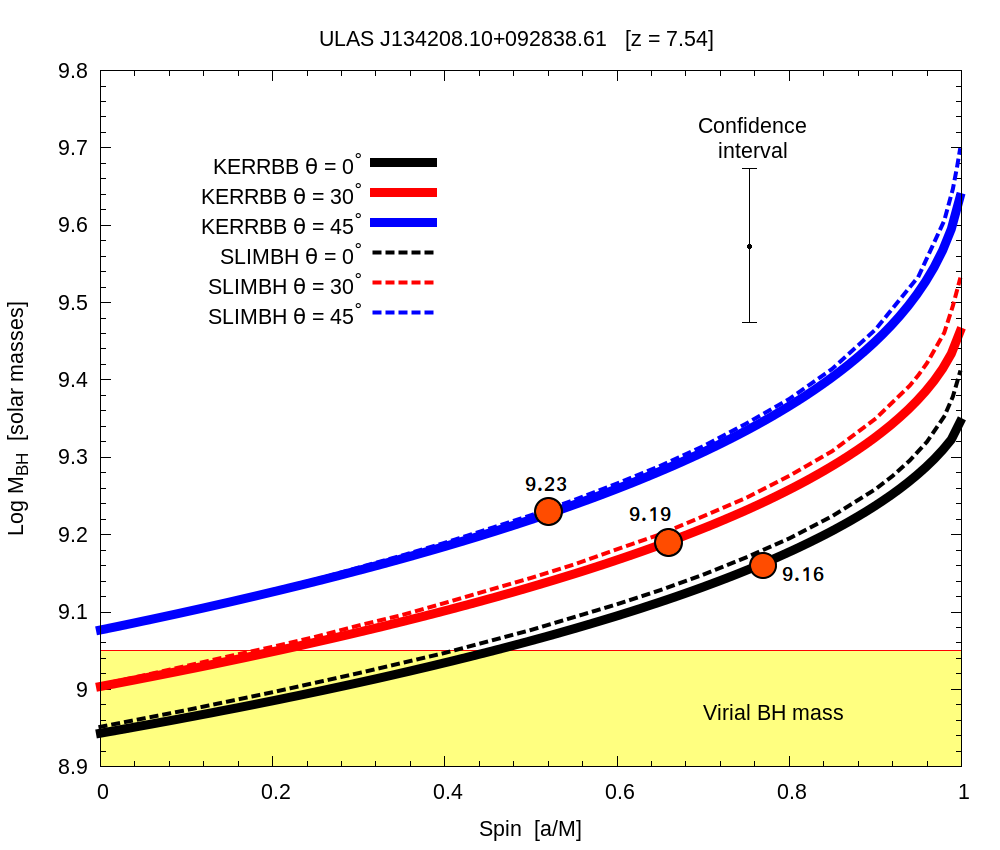
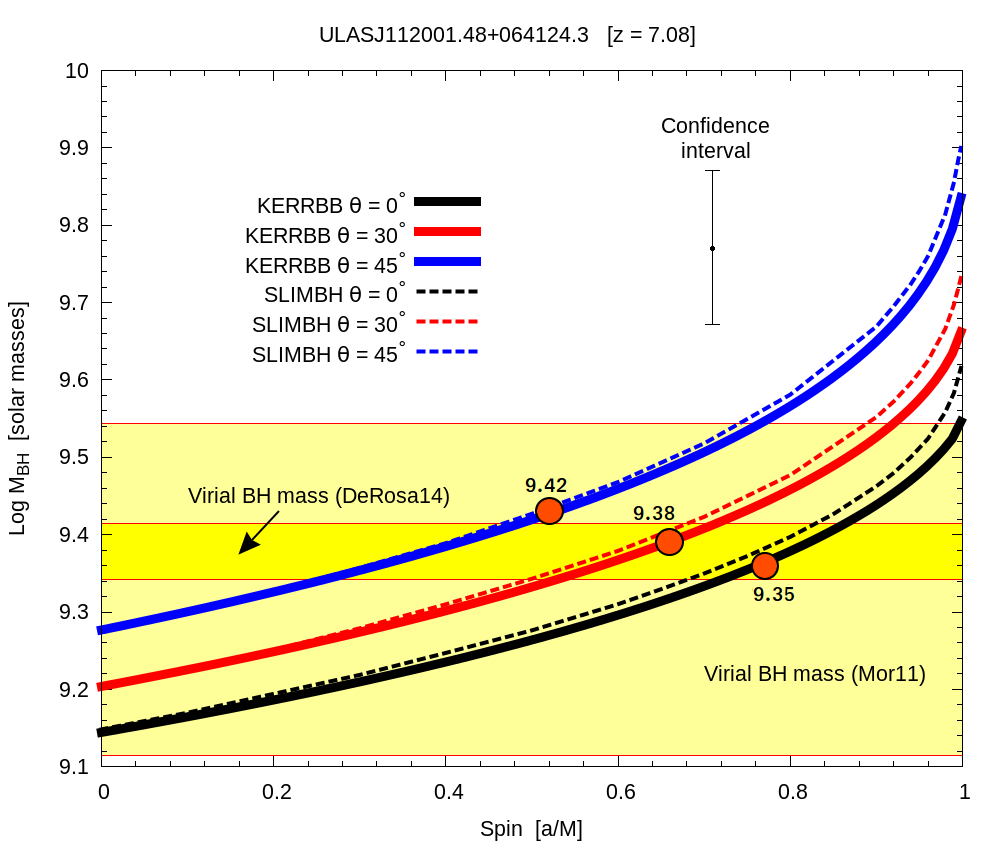
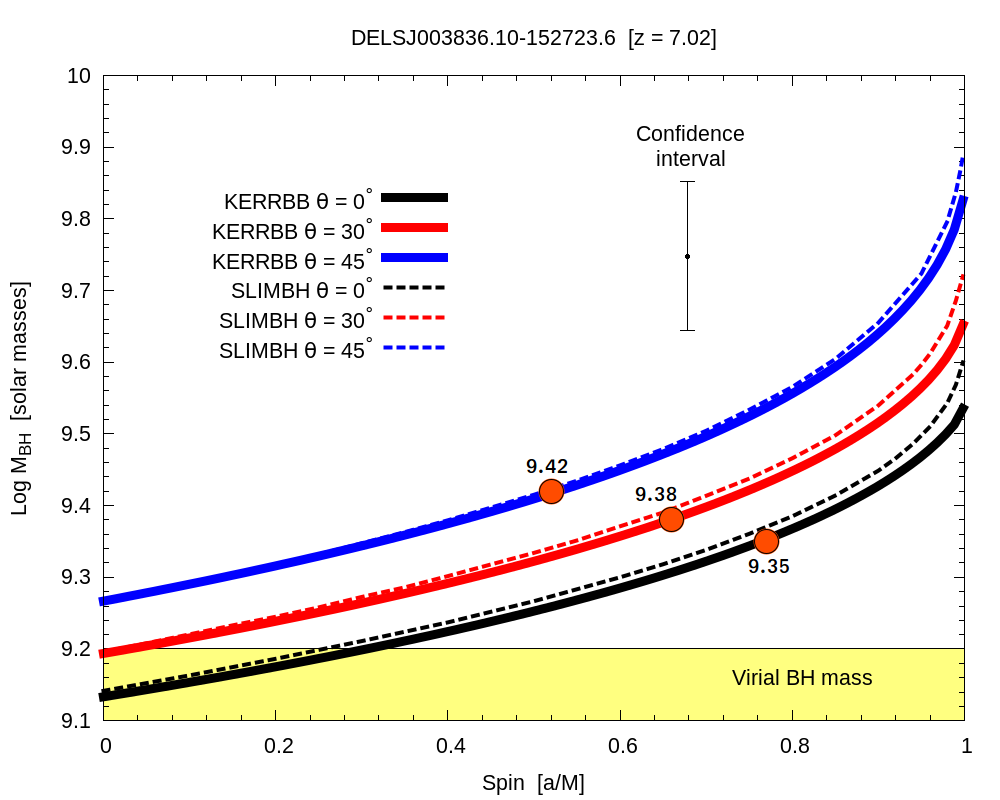
Figure 3 shows the KERRBB BH mass (solid lines) for the three sources as a function of the spin, for (following C18, we used the same procedure to find analytic expressions for different viewing angles; see Appendix A). These solutions describe the same spectrum with the same peak position: as shown by C18, if the spectrum peak is fixed, the KERRBB model is degenerate in mass , accretion rate , and spin .
In fact, assume that a spectrum can be described for some values of , and : if the spin value is increased, the inner radius of the disk moves to closer orbits. As a consequence, the radiative efficiency increases, making the disk luminosity increase as well. Consequently the spectrum shifts to higher luminosities and frequencies. However by increasing (i.e. moving the spectral peak to lower ) and decreasing (i.e. shifting the spectrum to lower ) conveniently, it is possible to reproduce the same original spectrum (see Fig. 4 in C18).
For illustration, in Fig. 3 we show the values of the BH mass corresponding to the fitting with a classical SS model (orange dots), that is, with no spin no relativistic corrections: this model can mimic a KERRBB model with the same , and , and a specific spin (see C18 for more details). Our estimates of the BH mass of the three sources for are summarized in Table 1. In the same figure, the single epoch virial mass ranges (from the Mg II line) as estimated by BN18, MR11, De Rosa et al. (2014) and W18 are shown as yellow areas. Our results are compatible with the virial mass estimates but with typically smaller uncertainties compared to the systematic dex in the local scaling relations for virial estimates (Vestergaard & Osmer 2009).
2.3 Black hole spin estimates
Assuming that the virial estimates are reliable measurements of BH masses (with no systematic uncertainties involved), the overlapping between the yellow area (indicating the virial BH mass range) and the KERRBB solutions in Fig. 3 can in principle be used to find some constraints on the BH spin: taking the reported quantities for the source J1342, the BH spin would have to be . For J1120, using the virial estimates of MR11, an upper limit for the BH spin would be present only for ( for , for ); using the virial mass of DR14, the spin would be constrained in the range . For J0038, the BH spin has to be . These ranges would rule out the maximum spin solution, but clearly no systematic uncertainties on the virial BH mass estimates (major uncertainty) and on the spectrum peak position have been taken into account: if these are considered, no constrains on the spin can be derived.
| Model | Source | ||||||
|---|---|---|---|---|---|---|---|
| KERRBB | J1342 | (9.16) | (0.26) | ||||
| (9.19) | (0.28) | ||||||
| (9.23) | (0.31) | ||||||
| J1120 | (9.35) | (0.16) | |||||
| (9.38) | (0.17) | ||||||
| (9.42) | (0.19) | ||||||
| J0038 | (9.35) | (0.23) | |||||
| (9.38) | (0.25) | ||||||
| (9.42) | (0.25) | ||||||
| SLIMBH | J1342 | ||||||
| J1120 | |||||||
| J0038 | |||||||
2.4 Eddington ratios
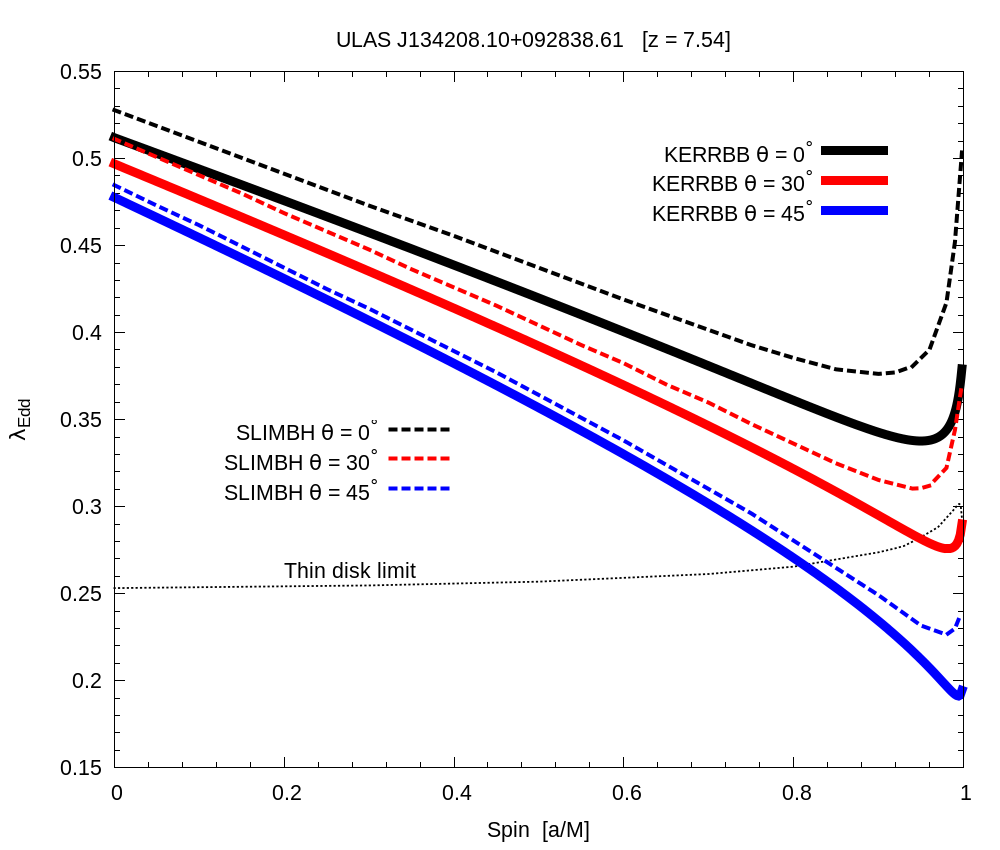
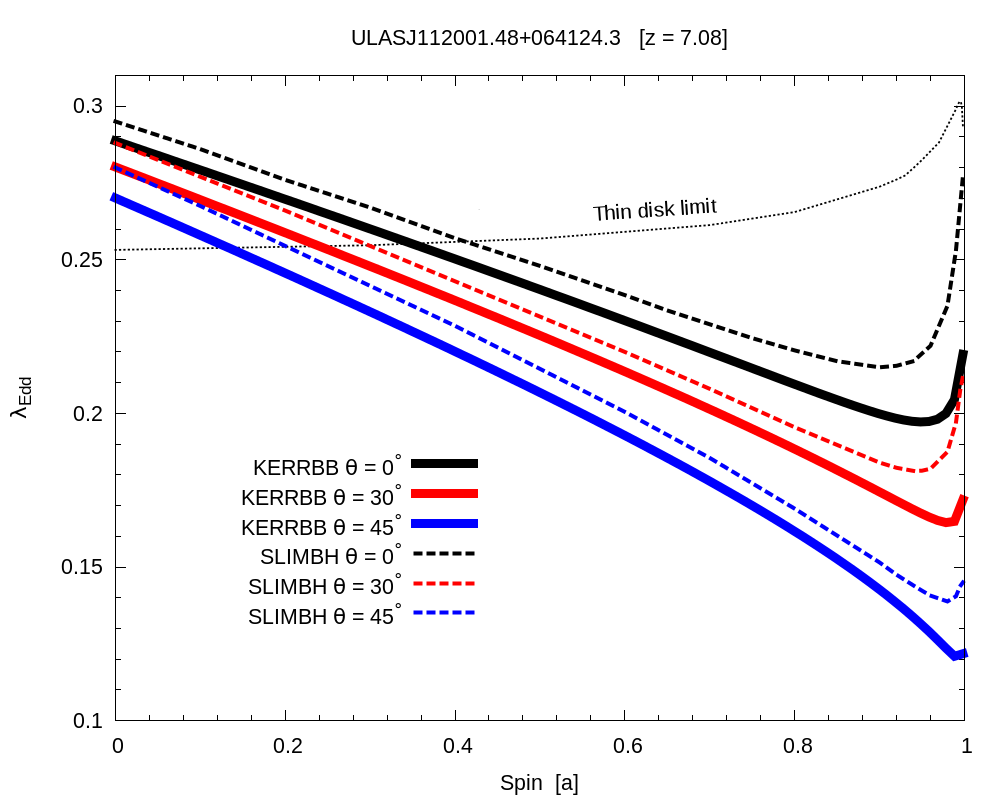
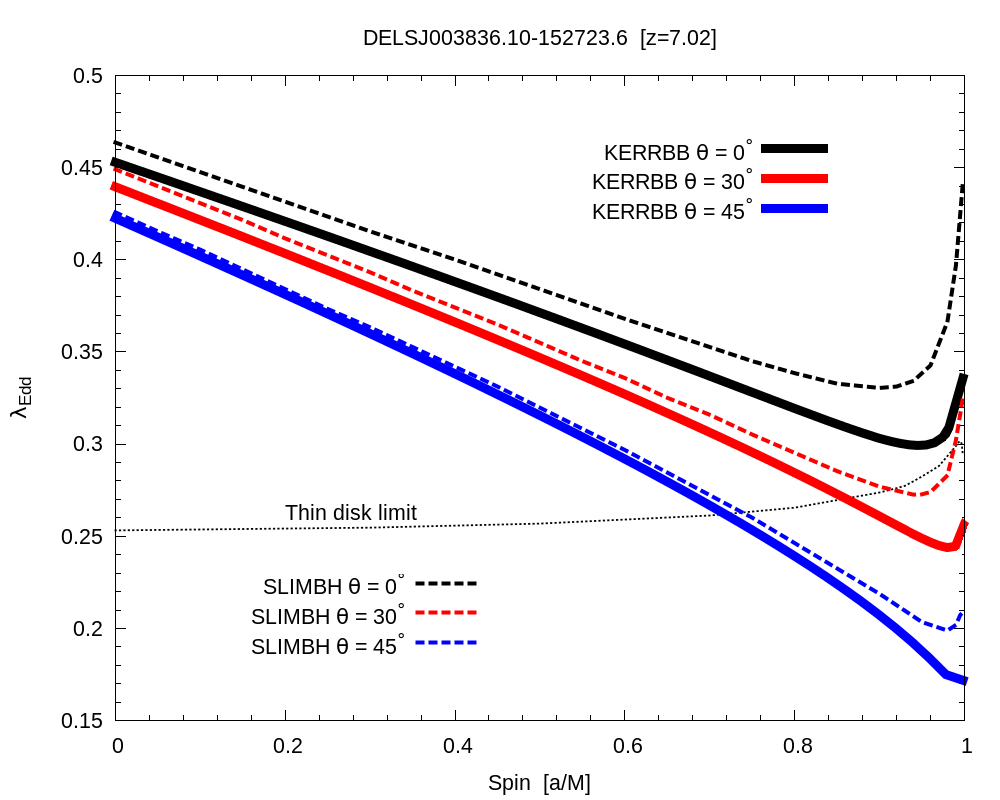
Figure 4 shows the Eddington ratios of the sources computed for the different KERRBB solutions (solid lines) as a function of the spin. The Eddington ratio is defined as (where with erg s-1): the value of decreases with the BH spin until (this value depends on the value of the viewing angle) where it reaches a minimum and then increases with . We point out that this effect is only due to the fact that, for the same spectral peak, mass and accretion rate (as a function of the BH spin) change in a different way for different viewing angles.111111For , the value of decreases as increases because the Eddington luminosity increases by a factor of with respect to the disk luminosity , which is almost constant (there is a small increment by a factor of ); instead, for spin values close to the maximum, the disk luminosity increases more significantly than the Eddington luminosity due to a larger radiative efficiency and, for this reason, the value of increases (and hence the minimum). For larger viewing angles () the value of is always decreasing for all spin values. We found the following upper limits: for J1342, for J1120, and for J0038, considering and spin (Table 1). Our KERRBB Eddington ratio estimates are smaller than the results found by BN18 for J1342 (), MR11 for J1120 () and W18 for J0038 (): the reason behind such different results is that they use bolometric luminosities (larger than our disk luminosity estimates) which lead to a larger value of , at least by a factor of .
2.5 KERRBB versus SLIMBH model
On the same Fig. 4, we compared the results with the thin disk limit for the Eddington ratio following Laor & Netzer (1989) (black dotted line): in order to have a geometrically thin disk (i.e. ratio between the disk half-thickness and disk radial coordinate ), the Eddington ratio must be (see also McClintock et al. 2006).121212Only for J1342 and J0038 our estimates are above this limit. Above this value, the results are not consistent with the thin disk assumptions and another solution (e.g. slim disk) must be used. In fact, beyond a critical accretion rate value, advection dominates over radiative energy transport and the disk becomes ”slim”. Also, the efficiency is lower because part of the energy dissipated in the disk is trapped in the accreting flow and not radiated away (e.g. Katz 1977; Begelman 1978) and this effect is more prominent for large spin values (see Sadowski 2009). To fit the spectrum and infer physical quantities, we therefore used SLIMBH, a relativistic model that describes the emission produced by a slim disk which is thought to be more appropriate for bright AGNs (Koratkar & Blaes 1999): high redshift SMBHs (with possible disk accretion) may have gone through a fast accretion phase with a large . SLIMBH is designed for stellar and intermediate mass BHs: following the same analysis done by C18 for KERRBB, we found analytical expressions to describe the observed disk emission as a function of the BH mass, spin, Eddington ratio and viewing angle, in order to extend its usage also for SMBHs (see Appendix B). Figures 3 and 4 show respectively the BH mass and the Eddington ratio for the three sources, computed using SLIMBH (dashed lines), for different spin values and angles, assuming the same peak position found with KERRBB: the results, summarized in Table 1, are similar for low spin values and slightly different for large spin values (by a factor of ). Also for what concerns the observed disk luminosity and the BH spin, the results inferred from the SLIMBH fits are similar to those obtained using KERRBB.
3 Evolution of the black hole mass
In this section we describe the BH growth following different evolutionary scenarios, considering simplified assumptions discussed in the following. The aim of the estimates below is to explore possible evolutionary histories for the considered sources, so that they reach their masses via accretion at their observed (high) redshifts. We evaluate the evolutionary paths in terms of accretion parameters, radiative efficiency, seed mass and formation redshift. The procedure is oversimplified as no physically motivated time evolution in the accretion parameters is adopted. Nevertheless, despite the limitations of the procedure, it gives a sense of which range of evolutionary parameters is viable and which source provides the strongest constraints on the growth parameters.
Accretion onto a BH changes its mass and spin (Bardeen 1970; Thorne 1974). The variation of the BH mass as a function of time is
where is the radiative efficiency (depending on the BH spin) and is the accretion rate. By integrating this expression, it is possible to find the evolution time for a BH, that is, the time it takes to grow from an initial mass to a final mass (Salpeter time, Salpeter 1964) assuming a fixed Eddington ratio ,
| (1) |
Lapi et al. (2014) present a consistent scenario in which at high redshifts, a BH grows in a self-regulated regime with a radiative power slightly super-Eddington () and a radiative efficiency . After this phase, a fast decrease of occurs until the matter reservoir, assumed to surround the BH and accrete onto it, is exhausted (i.e. in a sub-Eddington phase). Figure 20 in Lapi et al. (2014) shows that the fast decrease of the Eddington ratio lasts less than Gyr while most of the BH evolution occurs during the super-Eddington phase (which lasts longer). Therefore, the BH evolution time can be approximated by Eq. 1 with . Within such a scenario, our estimates for the Eddington ratios () would indicate that the three BHs we consider have already reached the last phase of their evolution. Therefore, in order to asses their growth, we have to focus on the previous (super)-Eddington phase.
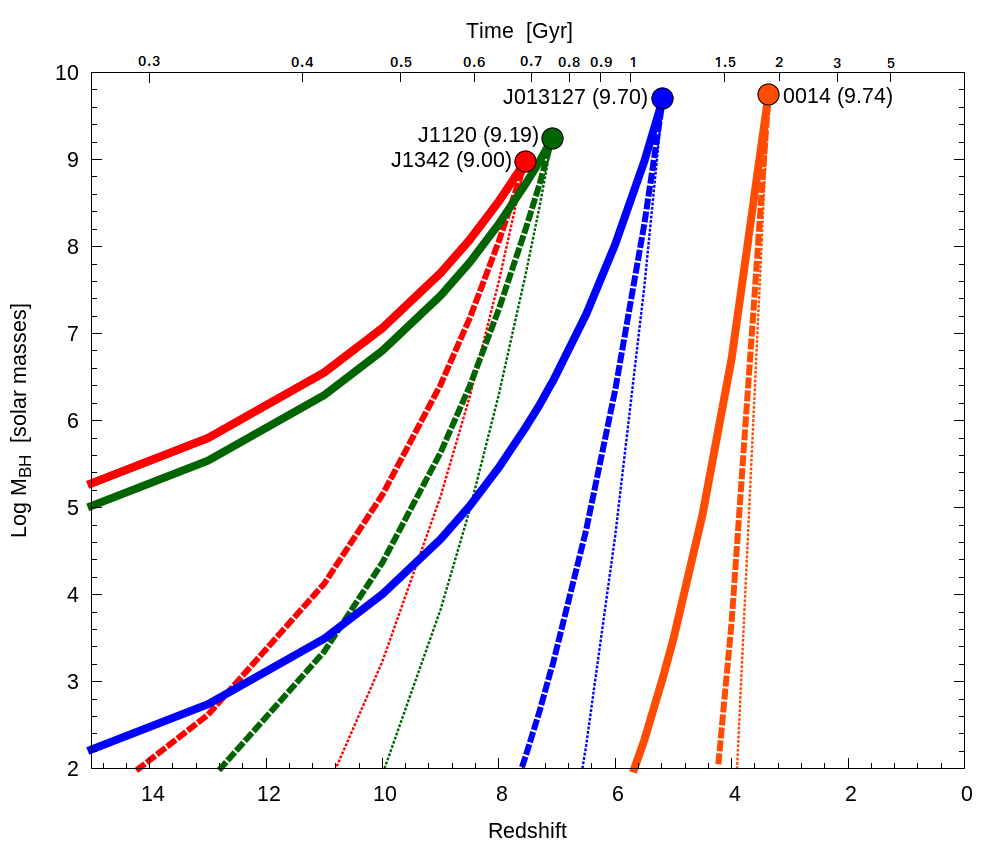
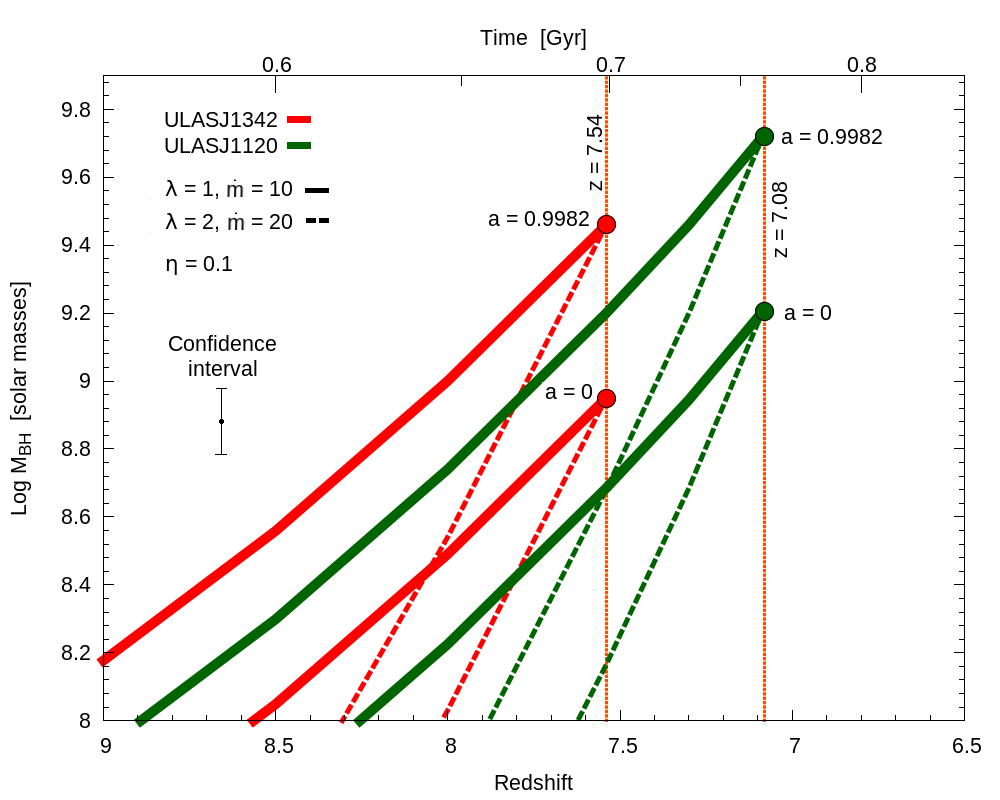
A first oversimplified assumption is that the observed Eddington ratio and observed accretion rate (defined as where ) describe the whole BH evolution. In this case, since for spin values we have inferred an Eddington ratio and an accretion rate , a very massive seed (Log ) is required for the sources at redshift . In other words, if the BH seed had a mass of , then a significantly larger and were needed during the fast growth phase of super-Eddington accretion. 131313For J1342, the evolution described with the observed parameters and is similar to the case with and .. Figure 5 shows the evolutionary tracks (i.e. BH mass as a function of redshift with the final mass corresponding to the case with and ) of the three sources, for different assumptions on the accretion parameters, as described below.141414For the case where , the curves are similar and shifted rigidly to larger masses by a factor of . These are compared with the equivalent tracks for the radio loud sources SDSSJ013127.34-032100.1 (hereafter J013127, ) and S5 0014+813 (hereafter 0014, ), studied by C18 using KERRBB, whose masses for non-rotating BHs are Log and Log , respectively. For simplicity, we can describe the evolution in two ways:
-
1.
Super-Eddington evolution : We fixed the radiative efficiency to . We assume that this choice is reasonable both in the accretion disk scenario and the chaotic one. If we assume the presence of a slim disk in the super-Eddington phase, the BH can spin up to the maximum value () and the radiative efficiency is lower than the canonical value (Thorne 1974) due to photon trapping; if instead the super-Eddington phase is characterized by a chaotic accretion, the BH spin is thought to be low or (Dotti et al. 2013): the value of is not easy to estimated and we follow Lapi et al. 2014. In the range of considered in this work, the choice of is in agreement with the results of Sadowski (2009) concerning the super-Eddington accretion through a slim disk. In the case (), a massive seed of is required at redshift or larger in order to reach the observed masses (as also obtained by BN18). For J013127 and 0014 instead, a seed of could have grown in Gyr, starting at redshift and , respectively. For larger values of , the BH evolution could have begun with a lighter BH seed at smaller redshifts, growing exponentially and reaching the estimated masses in less than Gyr.
-
2.
Eddington limited evolution : In this case, by definition, we have the bound . For different values of , the evolutionary curves are similar to the ones in Fig. 5. For the same value of , the evolution is slightly faster because is smaller due to the bound : assuming , the radiative efficiency is and this case is represented by the solid lines in Fig. 5; for , we have and the evolution curves are similar to the ones described by dashed lines but the growth proceeds slightly faster due to an efficiency .
The right panel of Fig. 5 shows a zoom around the observed redshifts of the sources J1342 and J1120 (for J0038, the evolutionary tracks are similar to the ones of J1120, shifted to lower redshifts by , not overplotted for clarity). At redshift , J1120 and J0038 could have been more (or less) massive than J1342 depending on the values of the Eddington ratio and the BH spin: for example, in the case with , J1120 and J0038 were less massive than J1342 by a factor of for any spin value; in the case with , the two sources were more massive than J1342 only if the sources had different spins. So, the source J1342 can be considered more extreme than J1120 and J0038, being more demanding to be built at such high redshift, in terms of seed mass or accretion speed.
4 Discussion and conclusions
We adopted the relativistic thin disk model KERRBB and slim disk model SLIMBH to describe the optical-UV SED of the most distant quasars identified up to the end of 2018, ULASJ134208.10+092838.61 (), ULASJ112001.48+064124.3 () and DELSJ003836.10-152723.6 (). The aim was to estimate their BH masses, spin and accretion rate. For the SED fitting process, we assumed a viewing angle (i.e. we assumed that is smaller than the aperture angle of the molecular torus surrounding the accretion disk), consistent with the properties of a Type 1 QSO. The results of the modeling can be summarized as follows:
-
The masses of the three sources from the fit of the accretion disk emission are compatible with the virial masses estimated by Mortlock et al. (2011), De Rosa et al. (2014),Bañados et al. (2018) and Wang et al. (2018). Our uncertainties are smaller compared to the systematics of virial estimates ( dex);
-
On the assumption that the virial estimates are reliable measurements of the BH masses (with no systematic uncertainties involved), our findings imply that for the source J1342 the BH spin has to be . For J1120, an upper limit for the BH spin is present only for viewing angles ( for ); for J0038 the BH spin has to be ;
-
The three sources emit radiation at a sub-Eddington rate, contrary to what Mortlock et al. (2011), Bañados et al. (2018) and Wang et al. (2018) found in their work: they computed the Eddington ratio using the AGN bolometric luminosity, which includes the IR and X-ray contributions, resulting in larger Eddington ratios at least by a factor of . Our results are in agreement with several works (e.g. Willott et al. 2010) showing that at high redshifts not all the sources emit close to the Eddington limit. Clearly a larger sample is needed to further investigate this issue. The sub-Eddington regime we inferred for the observed accretion suggests the need of a previous (super-Eddington?) phase during which most of the BH mass was quickly assembled (e.g. Lapi et al. 2014);
-
We showed, with a simplified approach, possible paths for the BH growth evolution. Two scenarios were considered: [1] a super-Eddington evolution with ; [2] an Eddington limited evolution with . For both these scenarios, we considered different accretion rates and different radiative efficiencies (with the bound ). The evolutionary tracks (i.e. mass versus time) of the three sources were also compared with those of SDSSJ013127.34-032100.1 () and S5 0014+813 (), studied by Campitiello et al. (2018). Independently of the value of , we found that a high accretion rate () and a low radiative efficiency () are necessary to reach the estimated masses at the observed redshifts, when starting the evolution from a black hole seed at redshift . It was also shown that the source J1342 can be considered more extreme than J1120 and J0038, in the sense of being more demanding to be built at such high redshift in terms of seed mass or accretion speed.
Some caveats and issues should be mentioned regarding our analysis:
-
We checked the robustness of our results, that is, the physical parameters derived from the model fits against emission and absorption affecting the observed spectra. Even for the most significant effect which can be due to (low level) dust absorption, our results (disk luminosity, BH mass, Eddington ratio) differ at most by a factor of . In the absence of dust absorption the main uncertainties on , and are limited by the confidence interval of the spectral modeling (‘visually’ represented by the red curves in Fig. 2);
-
In the (super-) Eddington phase of the assumed BH evolution, we considered constant parameters (, , ). This is clearly an oversimplified approach due to our ignorance of the temporal and physical evolution of the parameters regulating the growth history. The presented growth tracks have to be considered only as an indicator of the parameter space involved in order to account the measured mass. We note that, by definition, the assumption means that the accretion rate increases with the BH mass;
-
On the same line, we did not account for any kind of transitions between the (super-) Eddington phase and the observed sub-Eddington one;
-
Similarly, evolution of the BH spin has been neglected as this cannot be simply predicted and it would depend on the accretion rate and modality. One possible solution for the evolution is given by a two-phase scenario:
-
–
chaotic growth of the BH via BH-BH mergings and/or accretion of matter and gas falling onto a seed BH with no/small net angular momentum ( or low would be expected). The low efficiency could have provided a rapid growth of the BH even without violating the Eddington limit;
-
–
stable phase in which the accretion occurs through a disk-like structure (i.e. the phase we observe) producing the optical-UV bump: this kind of accretion could spin the BH up to its maximum rotation.
-
–
Future works on a large sample of quasars at could shed light on the possible mass and Eddington ratio distributions and give stronger constraints on the probable BH growth. The usage of relativistic accretion disk models (e.g. KERRBB and SLIMBH) could be a viable, alternative (and possibly more accurate) means to infer parameters like BH mass and Eddington ratio. In principle, well-calibrated alternative mass determinations would constrain BH spins.
Acknowledgements.
We are grateful to the anonymous referee for her/his constructive critical comments and suggestions, which helped improving the paper.References
- Abramowicz et al. (1988) Abramowicz M., Czerny B., Lasota J. P., & Szuszkiewicz E., 1988, ApJ, 332, 646-658
- Alexander & Hickox (2011) Alexander, D. M., Hickox, R. C., 2011, arXiv:1112.1949
- Arnaud (1996) Arnaud, K. A., 1996, Astronomical Data Analysis Software and Systems V. ASP Conference Series, Vol. 101, eds. G. H. Jacoby and J. Barnes, p. 17.
- Bañados et al. (2018) Bañados et al., 2018, Nature, 553.7689, 473
- Bardeen (1970) Bardeen, J. M., 1970, Nature, 226, 64
- Barth et al. (2003) Barth A. J., Martini P., Nelson C. H., Ho L. C., 2003, ApJ, 594, L95.
- Barvainis (1987) Barvainis, R., 1987, ApJ, 320, 537
- Begelman (1978) Begelman, M. C., 1978, MNRAS, 184, 53
- Bentz & Katz (2015) Bentz, M. C., & Katz, S., 2015, PASP, 127 (947), 67
- Berk et al. (2001) Berk, D. E. V. et al., 2001, AJ, 122, 549
- Blandford & Znajek (1977) Blandford, R. D. & Znajek, R. L., 1977, MNRAS, 179: 433-456
- Calderone et al. (2012) Calderone, G., Sbarrato, T., & Ghisellini, G., 2012, MNRAS, 425, L41
- Calderone et al. (2013) Calderone, G., Ghisellini, G., Colpi, M., & Dotti, M., 2013, MNRAS, 431, 210
- Campitiello et al. (2018) Campitiello, S., Ghisellini, G., Sbarrato, T., & Calderone, G., 2018, A & A, 612, A59, C18
- Capellupo et al. (2015) Capellupo, D. M., Netzer, H., Lira, P., Trakhtenbrot, B., & Mejia-Restrepo, J., 2015, MNRAS, 446, 3427-3446
- Capellupo et al. (2016) Capellupo, D. M., Netzer, H., Lira, P., Trakhtenbrot, B., & Mejia-Restrepo, J., 2016, MNRAS, 460, 212-226
- Castelló-Mor et al. (2016) Castelló-Mor, N., Netzer, H., & Kaspi, S., 2016 MNRAS, 458(2), 1839-1858
- Castignani & De Zotti (2015) Castignani, G., & De Zotti, G., 2015, A&A, 573, A125
- Castignani et al. (2013) Castignani, G., Haardt, F., Lapi, A., et al., 2013, A&A, 560, 28
- Czerny & Zbyszewska (1991) Czerny, B., & Zbyszewska, M. 1991, MNRAS, 249, 643
- Czerny et al. (2004) Czerny, B., et al., 2004, MNRAS, 348(3), L54-L57
- Davis et al. (2007) Davis, S. W., Woo, J.-H., & Blaes, O. M., 2007, ApJ, 668, 682
- De Rosa et al. (2014) De Rosa, G. et al., 2007, ApJ, 790(2), 145, DR14
- Dotti et al. (2013) Dotti, M., Pallini, S., Perego, A., Colpi, M., Volonteri, M., 2013, ApJ, 762.68
- Ebisawa et al. (1991) Ebisawa, K., Mitsuda, K., & Hanawa, T., 1991, ApJ, 367, 213
- Fan et al. (2001) Fan, X. et al., 2001, AJ, 122, 2833
- Francis et al. (1991) Francis, P. J., Hewett, P. C., Foltz, C. B., Chaffee, F. H., Weymann, R. J. & Morris, S. L. 1991, ApJ, 373, 465
- Ghisellini & Tavecchio (2015) Ghisellini, G. & Tavecchio, F., 2015, MNRAS, 448.2: 1060-1077
- Haiman (2004) Haiman, Z., 2004, ApJ, 613, 36
- Haiman & Loeb (2001) Haiman, Z. & Loeb, A., 2001, ApJ, 552: 459-463
- Hanawa (1989) Hanawa, T., 1989, ApJ, 341, 948
- Hönig & Kishimoto (2010) Hönig, S. F., & Kishimoto, M., 2010, A&A, 523, 27
- Hubeny et al. (2000) Hubeny, I., Agol, E., Blaes, O., & Krolik, J. H., 2000, ApJ, 533, 710
- Ichimaru (1977) Ichimaru, S. E. T. S. U. O., 1977, ApJ, 214, 840-855
- Katz (1977) Katz, J., I., 1977, ApJ, 215, 265
- Koratkar & Blaes (1999) Koratkar, A. & Blaes, O., 1999, PASP, 111, 1
- Koushiappas et al. (2004) Koushiappas, S., M., Bullock, J., S., Dekel, A., 2004, MNRAS, 354, 292
- Laor & Davis (2011) Laor, A. & Davis, S., 2011, MNRAS, 417.1: 681-688
- Laor & Netzer (1989) Laor, A. & Netzer, H., 1989, MNRAS 238, 897
- Lapi et al. (2014) Lapi, A., Raimundo, S., Rossella, A., et al., 2014, AJ, 782(2), 69
- Li (2012) Li, L.-X., 2012, MNRAS, 424, 2, 1461–1470
- Li et al. (2005) Li, L.-X., Zimmerman, E. R., Narayan, R., & McClintock, J. E., 2005, ApJ, 157, 335-370
- Li et al. (2007) Li, Y., Hernquist, L., Robertson, B., Cox, T. J., Hopkins, P. F., & Springel, V., 2007, ApJ, 665:187-208
- Lu et al. (1996) Lu, Y. J., Zhou, Y. Y., Yu, K. N., Young, E. C. M., 1996, AJ, 347, 148
- Madau et al. (2014) Madau, P., Haardt, F., & Dotti, M., 2014, ApJL, 784.2, L38
- Majia-Restrepo et al. (2018) Mejia-Restrepo, J. E., et al., 2018 Nature Astronomy, 2.1, 63.
- McClintock et al. (2006) McClintock, J. E., Shafee, R., Narayan, R., et al., 2006, ApJ, 652, 518
- McLure & Jarvis (2002) McLure, R. J. & Jarvis, M. J., 2002, MNRAS, 337, 109
- Molendi et al. (1992) Molendi, S., Maraschi, L. & Stella, L., 1992, MNRAS, 255, 27
- Momjian et al. (2014) Momjian, E., Carilli, C., L., Walter, F., & Venemans, B. 2014, AJ, 147, 6
- Mor et al. (2009) Mor, R., Netzer, H., & Elitzur, M. 2009, ApJ, 705, 298
- Mortlock et al. (2011) Mortlock, D., J, Warren, S., J., Venemans, B., P. et al., 2011, Nature, 474, 616, MR18
- Nandra & Pounds (1994) Nandra, K. & Pounds, K. A., 1994, MNRAS, 268, 405
- Narayan & McClintock (2008) Narayan, R., & McClintock, J. E., 2008, New Astronomy Reviews, 51 (10), 733-751
- Neugebauer et al. (1979) Neugebauer, G., Oke, J. B., Becklin, E. E., & Matthews, K., 1979, ApJ, 230, 79
- Novikov & Thorne (1973) Novikov, I. D. & Thorne, K. S., 1973, in Black holes, ed. C. De Witt and B. De Witt (New York: Gordon and Breach),343
- O’Leary et al. (2006) O’Leary, R., M., et al., 2006, ApJ, 637, 937
- Pelupessy et al. (2007) Pelupessy, F. I., Matteo, T. D., & Ciardi, B., 2007, ApJ, 665, 107
- Pier & Krolik (1993) Pier, E. A., & Krolik, J. H., 1993, ApJ, 418, 673
- Pounds et al. (1986) Pounds, K. A., Warwick, R. S., Culhane, J. L., & de Korte P. A. J., P. A. J., 1986, MNRAS, 218, 685
- Rauch & Blandford (1991) Rauch, K. P. & Blandford, R. D., 1991, ApJ, 381, L39
- Rees et al. (1982) Rees, M. J. et al., 1982, Nature, 295 (5844), 17
- Richards et al. (2006) Richards, G., T., et al. , 2006, ApJS, 166, 470
- Ruszkowski & Begelman (2003) Ruszkowski, M., Begelman, M., C., 2003, ApJ, 586, 3
- Sadowski (2009) Sadowski A., 2009, ApJS, 183, 171
- Sadowski et al. (2009) Sadowski A., Abramowicz M., Bursa M., Kluzniak W., Rozanska, A., & Straub, O., 2009, A & A, 502, 7
- Sadowski et al. (2011) Sadowski A., Abramowicz M., Bursa M., Kluzniak W., Lasota J.-P. & Rozanska A., 2011, A&A, 527, A17
- Salpeter (1964) Salpeter, E. E., 1964, ApJ, 140, 796
- Sbarrato et al. (2013) Sbarrato, T., Ghisellini, G., Nardini, M., Tagliaferri, G., Greiner, J., Rau, A., & Schady, P., 2013, MNRAS, 433, 2182
- Sbarrato et al. (2016) Sbarrato, T., Ghisellini, G., Tagliaferri, G., Perri, M., Madejski, G. M., Stern, D., Boggs, S. E., Christensen, F. E., Craig, W. W., Hailey, C. J., Harrison, F. A., & Zhang, W. W., 2016, MNRAS, 462, 1542-1550
- Seoane et al. (2013) Seoane, P., A. et al., 2013, ”The gravitational universe.” arXiv preprint arXiv:1305.5720
- Shakura & Sunyaev (1973) Shakura, N. I. & Sunyaev, R. A., 1973, AA, 24, 337, SS
- Shen et al. (2011) Shen, Y. et al., 2011, ApJS, 194, 45
- Straub, Done & Middleton (2013) Straub, O., Done, C., & Middleton, M., 2013, A&A, 533, A61
- Tanaka & Haiman (2009) Tanaka, T. & Haiman, Z., 2009, ApJ, 696, 1798
- Thorne (1974) Thorne, K. S., 1974, ApJ, 191, 507-519
- Tsuzuki et al. (2006) Tsuzuki, Y., Kawara, K., Yoshii, Y., et al., 2006, ApJ, 650, 57
- Vasudevan & Fabian (2007) Vasudevan, R., V., & Fabian, A., C., 2007, MNRAS, 381.3, 1235-1251
- Venemans et al. (2017) Venemans, B. P., Walter, F., Decarli, R. et al., 2017, ApJ, 837, 146
- Vestergaard & Osmer (2009) Vestergaard, M. & Osmer, P. S., 2009, ApJ, 699, 800
- Vestergaard & Wilkes (2001) Vestergaard, M., & Wilkes, B. J., 2001, ApJS, 134, 1
- Volonteri (2007) Volonteri, M., 2007, ApJ, 641, 689
- Volonteri (2010) Volonteri, M., 2010, A&A Rev., 18, 279
- Volonteri & Natarajan (2009) Volonteri, M., & Natarajan, P., 2009, MNRAS, 400, 1911
- Volonteri & Rees (2005) Volonteri, M. & Rees, M. J., 2005, ApJ, 633, 624
- Volonteri et al. (2003) Volonteri, M., Haardt, F., & Madau, P., 2003, ApJ, 582, 559
- Wang (1998) Wang, D.-X., 1998, General Relativity and Gravitation, 30, 7, 1025–1035
- Wang et al. (2018) Wang, F., et al., 2018, arXiv:1810.11925, W18
- Willott, McLure & Jarvis (2003) Willott C. J., McLure R. J., Jarvis M. J., 2003, ApJ, 587, L15.
- Willott et al. (2010) Willott, C., J., et al., 2010 AJ, 140, 546.
- Yoo & Escude (2004) Yoo, J. & Escude, J. M., 2004, ApJ, 614, L25-L28
Appendix A KERRBB equations
| -6238.24278 | -0.12968 | -926.60788 | 37153.52731 | -319409.16085 | 983173.49265 | -1228407.5946 | 532213.69610 | ||
| -9332.65475 | -0.30891 | -1356.5323 | 54978.79312 | -474342.11691 | 1462740.0025 | -1829629.6737 | 793292.21583 | ||
| -12431.6125 | -0.20298 | -1797.0174 | 73606.04261 | -636017.88764 | 1961099.1802 | -2451848.7325 | 1062521.5524 | ||
| -16314.3127 | -0.41098 | -2325.9424 | 95651.40409 | -828227.37848 | 2557278.0153 | -3200363.0119 | 1387917.3481 |
| 1.37528 | -0.03581 | 0.21458 | -0.35971 | 0.16821 | 0 | ||
| -0.69241 | 0.21439 | -0.57440 | 0.75878 | -0.31345 | 0 | ||
| -0.28949 | 0.33854 | -1.10213 | 1.27581 | -0.48471 | 0 | ||
| -0.02094 | 0.20299 | -0.65531 | 0.69134 | -0.24475 | 0 | ||
| 0.00538 | 0.04041 | -0.12718 | 0.12852 | -0.04411 | 0 | ||
| 9.917034 | -3.22512 | 17.89987 | -41.84139 | 41.27971 | -14.78658 | ||
| 3.51987 | -2.44127 | 13.36609 | -29.61009 | 29.12455 | -10.46037 | ||
| 0.72886 | -4.09764 | 21.16717 | -46.66724 | 46.53742 | -16.81675 | ||
| 0.39809 | -2.70631 | 14.15261 | -31.93365 | 32.12041 | -11.63591 | ||
| 0.10769 | -0.52470 | 2.79254 | -6.40072 | 6.46561 | -2.34359 | ||
| 1.43631 | -0.04881 | 0.29277 | -0.47116 | 0.22691 | 0 | ||
| -0.79532 | -0.01997 | 0.33520 | -0.75650 | 0.53158 | 0 | ||
| -0.22587 | -0.02063 | 0.09107 | -0.69291 | 0.63651 | 0 | ||
| 0.02389 | 0.02883 | -0.15739 | -0.10901 | 0.22802 | 0 | ||
| 0.01253 | 0.01160 | -0.05570 | 0.01933 | 0.02243 | 0 | ||
| 10.35255 | -3.29155 | 18.23667 | -42.38302 | 41.68164 | -14.90491 | ||
| 2.98930 | -2.42948 | 12.92896 | -28.15866 | 27.60484 | -9.89120 | ||
| 0.59669 | -4.53087 | 22.72740 | -49.83698 | 49.55957 | -17.85179 | ||
| 0.48252 | -3.02872 | 15.50716 | -34.91153 | 35.02577 | -12.65587 | ||
| 0.13420 | -0.58612 | 3.06804 | -7.02543 | 7.08401 | -2.56372 | ||
| 1.50731 | -0.07421 | 0.44310 | -0.66183 | 0.30977 | 0 | ||
| -0.94113 | 0.04156 | 0.22037 | -0.66194 | 0.48374 | 0 | ||
| -0.13063 | -0.33330 | 1.96527 | -3.88455 | 2.23797 | 0 | ||
| 0.06519 | -0.16637 | 1.16515 | -2.43971 | 1.43194 | 0 | ||
| 0.01540 | -0.02046 | 0.19603 | -0.44262 | 0.26763 | 0 | ||
| 11.07996 | -3.55277 | 19.73825 | -45.64546 | 44.84619 | -16.02576 | ||
| 2.34516 | -2.75232 | 14.20309 | -30.41746 | 29.43857 | -10.38000 | ||
| 0.65369 | -5.59958 | 27.68371 | -60.66151 | 59.68996 | -21.22119 | ||
| 0.71299 | -3.70302 | 18.84159 | -42.43550 | 42.23110 | -15.11877 | ||
| 0.18732 | -0.70811 | 3.69829 | -8.47710 | 8.49652 | -3.05447 |
The relativistic model KERRBB (Li et al. 2005) describes the emission produced by a thin disk around a Kerr BH. Using a ray-tracing technique to compute the observed spectrum, the authors included all relativistic effects such as frame-dragging, Doppler beaming and light-bending. It is an extension of a previous relativistic model called GRAD (Hanawa 1989; Ebisawa et al. 1991) which assumes a non-rotating black hole. Campitiello et al. (2018) build an analytic approximation of the KERRBB disk emission features considering an hardening factor and no limb-darkening effect: in the case of a face-on disk, they found analytic expressions to compute the BH mass and accretion rate by fitting a given SED for different spin values. Here we followed the same procedure. From the SED, the spectrum peak and luminosity are
| (2) |
| (3) |
where Log , Log . The functions and account for all the effects due to the viewing angle and the spin . We fixed and we used KERRBB data to find analytic expressions for and that can be written as
| (4) |
A smaller number of parameters reduces the precision of these equations. The different parameters for and are reported in Table 2 for the viewing angles . Then the BH mass, accretion rate and Eddington ratio can be found:
where Log . For we used the expressions and the parameters found by Campitiello et al. (2018).
Appendix B SLIMBH equations
The relativistic model SLIMBH (Abramowicz et al. 1988; Sadowski 2009; Sadowski et al. 2009; Sadowski et al. 2011; Straub, Done & Middleton 2013) describes the emission produced by a slim disk around a BH. It is based on the relativistic description of Novikov & Thorne (1973) and it accounts also for the vertical radiative energy transport which is not negligible for high accretion rates. As KERRBB, the observed spectrum is computed using the ray-tracing technique and it is implemented in XPSEC. For this work, we assumed a viscosity with , hardening factor , and no limb-darkening effect. The procedure to find analytic expression for SLIMBH is similar to the one adopted for KERRBB. Since the Eddington ratio is a free parameter of the model, we re-wrote Eqs. 2 and 3, adding and including all the effects due to spin and viewing angle in the new functions and :
| (5) |
| (6) |
The new functions and depend also on the Eddington ratio. We adopted the following procedure: we fixed the viewing angle , the BH mass and the Eddington ratio , and we used SLIMBH to compute the peak frequency and luminosity for different spin values; then we found analytic equations for and and, after that, we considered the product
where Log . At this point, we estimated the left-hand side of the expression from an observed spectrum. The right-hand side is derived since we have found analytic expressions for and : the comparison leads to the only value of the BH spin corresponding to the fixed . By using this spin value in Eq. 5 (or 6), it is possible to find the corresponding BH mass. We repeated this procedure for different Eddington ratio values and found the solutions for different BH spins. The procedure led to the following analytic functions for and :
The parameters , , , , are a function of the Eddington ratio and can be approximated with a polynomial
| (7) |
whose parameter values are reported in Table 3, for the viewing angles . Therefore, as for KERRBB, only the spectrum peak position (frequency and luminosity ) are required in order to extrapolate information about the BH.