Comparing Chandra and Hubble in the Northern Disk of M31
Abstract
The X-ray source populations within galaxies are typically difficult to identify and classify from X-ray data alone. We are able to break through this barrier by combining deep new Chandra ACIS-I observations with extensive Hubble Space Telescope imaging from the Panchromatic Hubble Andromeda Treasury of the M31 disk. We detect 373 X-ray sources down to 0.35-8.0 keV flux of 10-15 erg cm-2 s-1 over 0.4 square degrees, 170 of which are reported for the first time. We identify optical counterpart candidates for 188 of the 373 sources, after using the HST data to correct the absolute astrometry of our Chandra imaging to 0.1′′. While 58 of these 188 are associated with point sources potentially in M31, over half (107) of the counterpart candidates are extended background galaxies, 5 are star clusters, 12 are foreground stars, and 6 are supernova remnants. Sources with no clear counterpart candidate are most likely to be undetected background galaxies and low-mass X-ray binaries in M31. The hardest sources in the keV band tend to be matched to background galaxies. The 58 point sources that are not consistent with foreground stars are bright enough that they could be high mass stars in M31; however, all but 8 have optical colors inconsistent with single stars, suggesting that many could be background galaxies or binary counterparts. For point-like counterparts, we examine the star formation history of the surrounding stellar populations to look for a young component that could be associated with a high mass X-ray binary (HMXB). About one third of the point sources are not physically associated with a young population, and are therefore more likely to be background galaxies. For the 40 point-like counterpart candidates associated with young populations, we find that their age distribution has two peaks at 15-20 Myr and 40-50 Myr. If we only consider the 8 counterpart candidates with typical high-mass main sequence optical star colors, their age distribution peaks mimic those of the sample of 40. Finally, we find that intrinsic faintness, and not extinction, is the main limitation for finding further counterpart candidates.
1. Introduction
X-ray sources probe the most exotic forms of matter in the universe. Those outside of active galactic nuclei, such as X-ray binaries (XRBs) and supernova remnants (SNRs), can only be detected in nearby galaxies. Chandra and XMM-Newton can resolve hundreds of individual stellar-mass X-ray sources in Local Group galaxies, but outside of the Magellanic Clouds, the identification of counterparts for these stellar mass X-ray sources has been hampered by low spatial resolution X-ray data, difficulty separating background galaxies from stars in optical imaging, and stellar crowding.
Over the past decade, our ability to identify high-quality counterpart candidates for X-ray sources outside of the Galaxy and Magellanic Clouds has improved greatly due to the combination of high spatial resolution X-ray imaging with Chandra and resolved stellar photometry with the Hubble Space Telescope (HST). Populations of OB star and background galaxy counterpart candidates have been classified out to distances of 3 Mpc, in particular, M31 (770 kpc; Williams et al., 2005b, c, a; Hatzidimitriou et al., 2006; Williams et al., 2014a), NGC 300 (2 Mpc; Binder et al., 2012), NGC 2403 (3 Mpc; Binder et al., 2015), and NGC 404 (3 Mpc; Binder et al., 2013).
As the nearest massive spiral, M31 has been observed extensively in X-rays. Building on early surveys with the Einstein observatory (van Speybroeck et al., 1979) and ROSAT (Supper et al., 1997, 2001), XMM-Newton has mapped the entire interior of the isophotal contour (Pietsch et al., 2005; Stiele et al., 2011, hereafter S11), and Chandra has observed the inner disk with the HRC (Williams et al., 2004a), mapped portions of the disk with ACIS (Di Stefano et al., 2004; Vulic et al., 2016), and monitored the bulge and nuclear regions for over a decade (Kong et al., 2002; Kaaret, 2002; Garcia et al., 2010; Li et al., 2011). These surveys have detected dozens of transient X-ray sources, and thousands of persistent sources.
Most of the known X-ray sources are unidentified, but many are consistent with emission originating from background active galactic nuclei (AGNs). Others are clearly matched to bright Milky Way foreground stars. However, the most interesting sources are those that may truly be in M31. Pietsch et al. (2005) and S11 provided hundreds of source classifications based on variability and hardness ratios, and they identify dozens of SNRs and XRB candidates based on cross-matching with bright stars and star clusters from ground-based imaging and catalogs. With all of this work, only two strong high mass X-ray binary (HMXB) candidates were seen (sources 1579 and 1716 in S11), potentially because of the difficulties of identifying stellar counterparts in the crowded M31 with the spatial resolution available in these data. By comparing the XMM-Newton catalogs and ground-based photometry, Williams et al. (2014a) obtained spectra of dozens of optical counterpart candidates in the M31 field, finding few, if any HMXBs. Most of their spectra showed the counterparts to be background AGN, even though they were targeted to be blue point sources in ground based imaging.
While all of this work has significantly advanced our knowledge of M31’s X-ray source populations, at this point it remains unclear what fraction of the known X-ray sources actually belong to M31 and which of the sources are background galaxies being viewed through M31. It is also unclear what the nature of most M31 sources is.
The very recent HST survey of the northern half of M31, the Panchromatic Hubble Andromeda Treasury (PHAT; Dalcanton et al., 2012; Williams et al., 2014b), offers an opportunity to remedy this situation. PHAT is the largest HST mosaic ever assembled, covering a large fraction of the northern M31 disk in 6 HST filters from the near ultraviolet to the near infrared, supplying photometry for over 100 million stars. The high-resolution imaging provides the opportunity to find high-quality counterpart candidates for background galaxies and HMXBs. The resolved photometry allows us to determine the physical characteristics of the stellar populations surrounding the X-ray sources.
In addition to allowing us to optically identify background galaxies, we expect the PHAT (Dalcanton et al., 2012; Williams et al., 2014b) footprint to contain 20 HMXBs. Measurements of the star formation rate in M31 (Williams, 2003; Lewis et al., 2015) are 0.3 M⊙ yr-1 in the PHAT footprint. The scaling relation between SFR and HMXBs (Grimm et al., 2003) implies 20 HMXBs with L erg s-1 should be associated with that amount of star formation, and the relation scaling relation in the Magellanic Clouds (Antoniou et al., 2010) suggests 100 Be-XRBs, but only a fraction of these (20) are expected to have high X-ray luminosities, usually associated with accretion disk systems (i.e., fed by Roche-lobe overflow). Combining the catalogs of Binder et al. (2015) with the optical catalogs from the ANGST program (Dalcanton et al., 2009) suggests a scaling relation between the number of OB stars with M and the number of bright HMXBs (L erg s-1). There are 8104 such stars (, ) in the PHAT footprint, which implies 30 bright HMXBs. Finally, the summed spectra of sources with L(5–10)1035 ergs s-1 has a photon index consistent with neutron star HMXBs (see Figure 6 of Shaw Greening et al., 2009), consistent with this estimate.
So, where are the bright HMXBs in M31? Perhaps they are being missed due to stellar crowding in the M31 disk. To better localize the X-ray sources, we have undertaken a Chandra survey covering much of the PHAT survey area. We designed our survey to provide the largest number of precise positions for the least amount of Chandra time. Our final observations achieved a 0.358 keV depth of 310-15 erg cm-2 s-1 (assuming a power-law spectrum with an index of 1.7 and =71020 cm-2 (as in, e.g., S11), which corresponds to 31035 erg s-1 at the distance of M31 (770 kpc, McConnachie et al., 2005). This depth should allow us to detect dozens of HMXBs and provide a reliable test of the predicted numbers.
Low-mass X-ray binaries (LMXBs) are not as simple to identify, even with HST imaging, as their optical counterparts are too faint to be distinguished. However, based on the stellar mass maps from PHAT (Williams et al., 2017), there are 21010 M⊙ in the region covered by our X-ray data, suggesting a LMXB population with L31035 erg s-1 of 100 according to the LMXB X-ray luminosity function (XLF) from Lehmer et al. (2014). By identifying a large fraction of the other sources, we can test this prediction for consistency.
By combining Chandra positions with HST imaging, we simultaneously limit the number of potential counterpart candidates, identify the most likely counterpart to the X-ray source based on HST photometry, and easily resolve many background galaxies, which we expect to dominate the X-ray catalog. For the best X-ray binary candidates, the same data set can be used to constrain the progenitor age, physical characteristics of the secondaries, and provide targets for follow-up optical spectroscopy to measure orbital periods. Ideally, time-resolved spectroscopy of the resulting catalog will ultimately provide clean age and orbital period distributions for a sample of M31 X-ray binaries, which can also be tied to the properties of their local stellar populations. Such a sample will provide quantitative tests for predictions of HMXB production from binary evolution models.
In this paper, we present our initial catalog, counterpart candidates, and measure the age distribution of HMXB candidates. In Section 2, we describe the observations of our Chandra survey of the PHAT region, as well as our data reduction technique for measuring the X-ray sources and aligning the Chandra data to PHAT directly. In Section 3, we present our Chandra catalog, cross-matched with the XMM-Newton catalog of S11. We include the most likely optical counterparts in cases where a likely counterpart is present in the HST data. In Section 4, we describe some of the most interesting counterpart candidates, including the best HMXB candidates, and in Section 5 we summarize our work.
2. Observations and Reductions
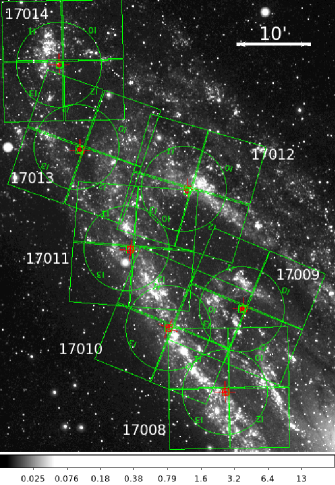
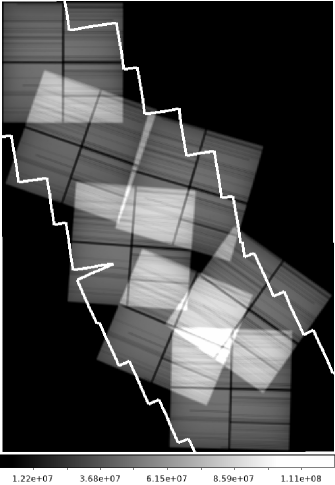
In October of 2015, we observed the PHAT footprint with Chandra with 7 pointings. The footprints are overlaid on a GALEX NUV image of M31, along with the corresponding HST coverage, in Figure 1. Using the S11 catalog, we found that by obtaining 25 counts for each 510-15 erg cm-2 s-1 source, we would achieve excellent efficiency in measuring positions, and we would detect fainter sources (down to a faint limit of 10-15 erg cm-2 s-1) near the field centers. Therefore, at each pointing we observed for about 50 ks in VF mode. These 7 observations are summarized in Table 1.
2.1. X-ray Photometry
We processed these observations independently using CIAO 4.7 with CALDB version 4.6.7 (Fruscione et al., 2006). We first generated exposure maps and images of the counts covering the full detector with 0.492′′ pixel resolution using the task fluximage. We made corresponding maps of the point spread function using mkpsfmap. These were put through the task wavdetect using the default parameters, and searching on scales of 1, 2, 3, 8, and 16. The output source regions were then overplotted on the images and inspected by eye to assure that no obvious sources were missed and that all sources appeared to correspond to true overdensities of counts. At the same time, we ensured that sources appearing in multiple observations were noted so that they would appear in our catalog only once, but their measurements in each observation were kept separate to assess variability and position uncertainty. This process resulted in a total of 373 unique detected sources.
Once we had measured the source positions using the initial Chandra astrometric solution that came with the data products, we used the ACIS-Extract (Broos et al., 2010) package (version 4994, 2016-09-22) to measure the positions and photometry at all of these locations in the data. We ran ACIS-Extract iteratively, including the task fit_positions, to ensure that the software converged on the position of each source on the ACIS-I detector. We looked at multiple possible source positions for each source (“data mean, correlation, and maximum-likelihood reconstruction”) in each iteration, and we found that the data mean position both appeared most centered on the sources and converged reliably for all but the faintest, most off-axis sources. We show the impact of our iterative technique in Figure 2, where we compare the difference in the data mean positions of the sources between the first two iterations in one panel and the last two iterations in another panel. Source names were generated by ACIS-Extract from the input X-ray source positions.
While most sources were observed in only one observation, many were in overlapping regions, allowing multiple measurements. In these cases, the position and position error are from the best (most on-axis) measurement, as are all of the other values in our final catalog.
This process resulted in a limiting flux of 310-15 erg cm-2 s-1.
2.2. Alignment to PHAT
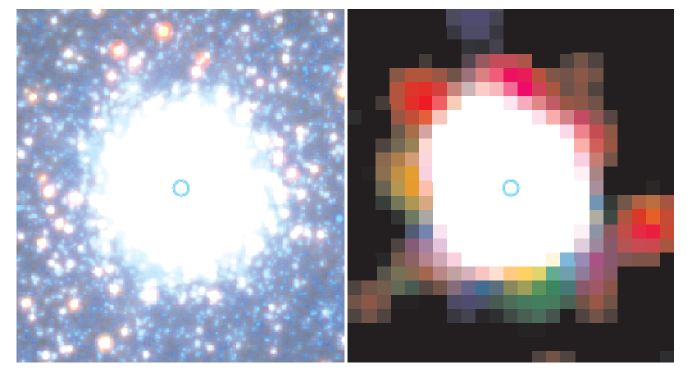
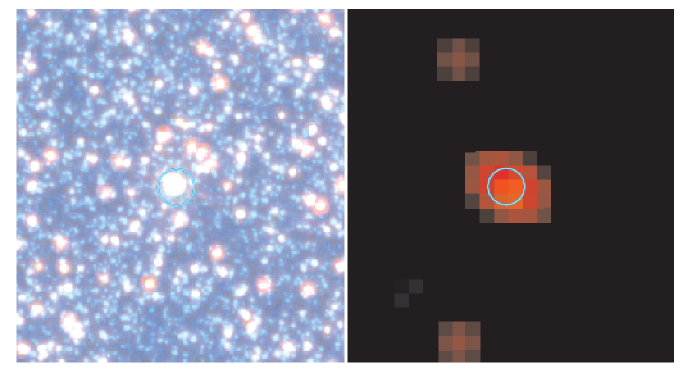
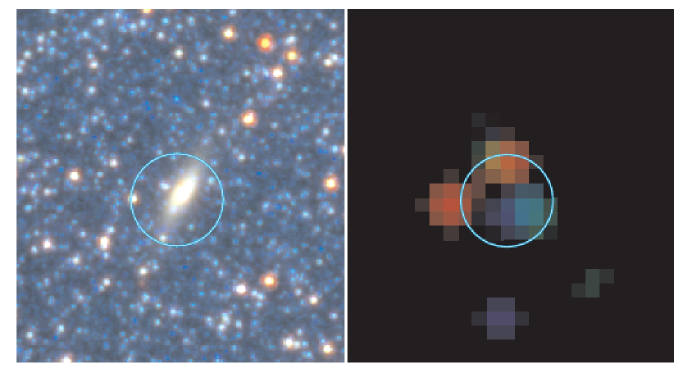
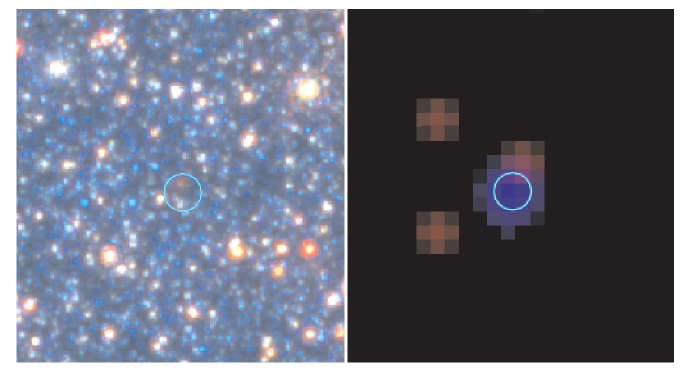
The PHAT data have astrometric accuracy of 10 milliarcsec (Williams et al., 2014b), while typical raw Chandra data have a 90% accuracy of 800 milliarcsec111http://cxc.harvard.edu/cal/ASPECT/celmon/. To greatly improve the astrometry of the Chandra data, we aligned the initial source catalog to the PHAT imaging data using the optimized Chandra centroids. We visually inspected all positions on the PHAT imaging data, making note of which sources corresponded to a clear foreground star, star cluster, or bright background galaxy. Examples of these objects are shown in Figure 3. We then used the IRAF task ccmap to reset the astrometric solution of the Chandra data to force these positions to align with their counterparts in the PHAT catalog. The 26 sources used for alignment are provided in Table 2 Chandra-PHAT Alignment Sources so that it is clear which sources were forced to match the PHAT positions. All Chandra observations had at least 3 alignment sources, and the corrections were all 1′′.
We fit the positions allowing for rotation, translation, and pixel scale adjustments. However, we checked that the solution recovered a pixel scale of 0.492′′ (the known Chandra plate scale). Since there is little chance that 0.492′′ in both the X and Y pixel direction would be the best-fit pixel scale if the matched sources were incorrect, our recovery of this pixel scale provided confirmation that the matched sources we used were correctly identified. For background galaxies, we assumed that the X-ray source corresponds to the center of the background galaxy. If the true positions of the X-ray sources were far off the galaxy center, the fit to the pixel grid would be poor (X and Y plate scales would not likely match). Smaller offsets from the center could go unnoticed, but they would contribute to the RMS scatter in the fit, which is included in the errors.
The RMS of the astrometric solution returned by ccmap, suggests that the Chandra sources are aligned to the PHAT imaging to a precision of better than 0.1′′ (see Table 1). We have used the position uncertainty formula of Kim et al. (2004) to calculate the positional uncertainty for the catalog, setting our floor term to the alignment uncertainty between Chandra and PHAT for each observation provided in Table 1.
2.3. Counterpart Candidate Identification
We plotted 1, 2 and 3 error circles for the Chandra X-ray sources on the PHAT mosaic images. These were plotted independently for each observation so that sources detected in multiple observations served as a consistency check on our positional alignment to PHAT, and counterpart candidate. We examined the X-ray image, color PHAT image, and UV-only PHAT image at each X-ray source location. We made a note of any interesting counterpart candidates, which included bright stars, blue stars, UV-bright stars, star clusters, or background galaxies.
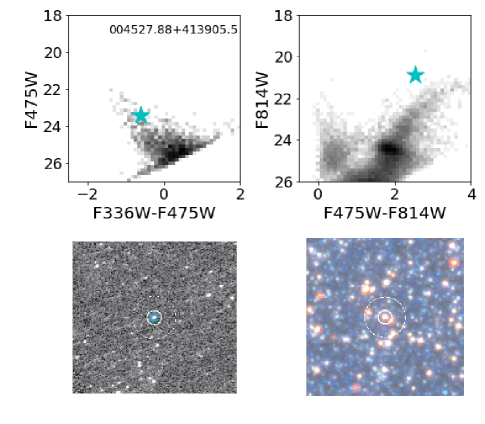
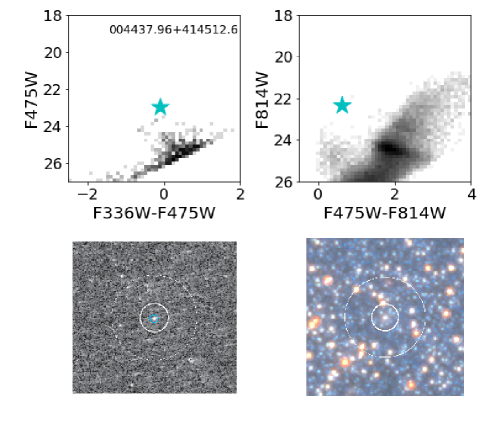
When searching for point source counterparts, we made color-magnitude diagrams (CMDs) and color-color diagrams of the stars in the PHAT catalog within 3 of the Chandra source position in F336W-F475W, F475W-F814W, and F110W-F160W. We inspected these diagrams to look for sources with colors that placed them off of the main CMD features of the survey, or on the upper-main sequence, where the optical counterparts of HMXBs would tend to reside. Because HMXBs have massive secondary stars, if the secondary dominates the optical light, they would reside on the main sequence in these CMDs; however, because the primary could have a bright accretion disk that may irradiate the secondary or produce emission lines, they could be pushed away from the stellar locus on such CMDs. Examples of these CMDs are shown in Figure 4, where we have plotted points for all sources in the error circle with measured F336W and F475W magnitudes and marked with a star the counterpart candidate we chose by eye. The color-color diagram of all of our final point source counterpart candidates is shown in Figure 5. Figure 4 shows and example of each category of point source counterpart candidate: those with upper-main sequence colors, those with unusual colors, and those not associated with a young population. The unusual colored source has a UV color (upper-left panel) that is typical of an upper-main sequence star, but its optical color is quite red, more like a red He-burning star or red supergiant. Such figures are available for all of the sources in the supplemental material, and point source counterpart candidates from the PHAT catalog are marked as in the Figure 4 example.
The selection of counterpart candidates was iterative. Two people searched the images and CMDs independently, compared notes, and re-examined the positions of sources where there was initial disagreement until the two lists converged on a set of candidates. Table 4 gives brief notes on the sources from this process. When the process was complete, each X-ray source either had one optical source that appeared to be a good candidate (bright star, star cluster, or blue star, UV-bright star, or background galaxy), or no such candidate. Objects with no such candidate could be either highly-extincted (e.g., embedded HMXB, or AGN behind M31 dust), or too faint in the optical to be detected (e.g., faint AGN or LMXB). While our error circles typically contained dozens or more M31 stars, these stars were nearly all similar to the red giant branch stars that are common throughout the galaxy. We chose only point source candidates that stood out as being brighter and bluer either in the UV or optical than the stars in the surrounding area of the field. The chances of such an object being within our rather small error circles by chance was relatively low. Objects of comparable colors and magnitudes have surface densities of 10-2 arcsec-2 in PHAT, and our error circles were typically 2 arcsec-2, leaving only about a 2% chance of false positives.
Resolved galaxies are difficult to find in an automated way, since they are faint and diffuse and are not properly detected or measured in point source optical catalogs of resolved stars such as that of Williams et al. (2014b). For example, we cross-correlated our by-eye background galaxies with those identified by the Andromeda Project (AP; Johnson et al., 2015), which was a crowd-sourcing project in which the public identified star clusters in the PHAT imaging data. As a secondary option, users could also mark background galaxies. They found thousands of relatively bright galaxies in the PHAT footprint visible in the F475W and F814W bands, 28 of which are in the 1 error circles of X-ray sources in the full sample. However, we have found that many of the other 79 background galaxies that coincide with X-ray source positions are very faint and would likely be missed by those not looking for something specifically at these locations. Furthermore, many of these galaxies have most of their flux in the F160W band, likely because of high absorption in the optical through the M31 disk. AP limited their search to the F475W and F814W imaging, and therefore has likely missed many of these very red background galaxies.
Example images of background galaxy candidates are provided in Figure 6, and all such images are included in the supplemental data. Figure 4 presents an example finding chart from the PHAT data; the supplemental data include these for all of the sources in the catalog. These finders allow catalog users to assess for themselves the veracity of any chosen counterpart candidate.
2.4. Catalog Cross-Matching
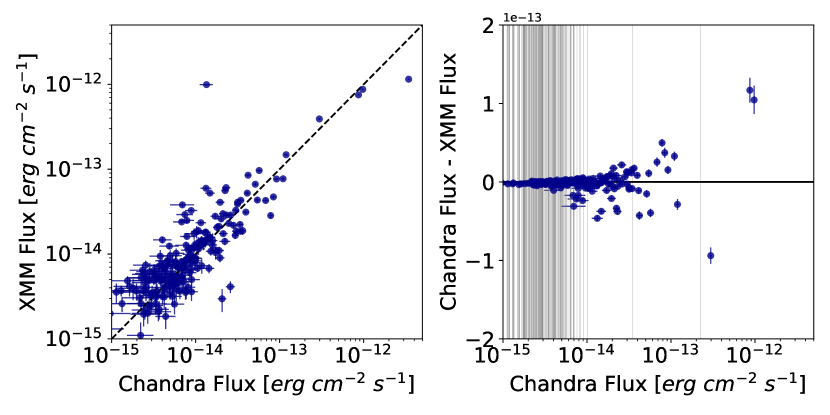
We cross-correlated all of these sources with the most recent XMM-Newton catalog (S11) for simple consistency comparisons. This catalog has a limiting sensitivity of 10-15 erg s cm-2 in the 0.2-4.5 keV band. We matched all sources within 5′′ of an XMM-Newton source to allow for the XMM-Newton PSF size. These matches are all included in our catalog. There were 311 S11 sources within our survey area. We matched 203 of the Chandra sources to 202 of the S11 sources (S11 1848 matched to both CXO J004648.19+420855.4 and CXO J004648.27+420851.1). To more directly compare our fluxes with previous data from XMM-Newton, we used WebPIMMS to determine conversion factors between ACIS-I count rates in our bands and the S11 0.2-4.5 keV band assuming a power-law spectrum with an index of 1.7 and =71020 cm-2.
A large fraction of fainter the sources in this M31 field vary in brightness on long timescales such that they are not detected in all observations. While we found excellent overall agreement for the 203 matched sources, as shown in Figure 7, the scatter is sometimes beyond the uncertainties due to intrinsic variability of sources. Moreover, most of the fainter sources were only detected in one set of observations. There are 170 sources in our catalog that are not in S11, and 168 of these have 0.35-8 keV fluxes below 1.510-14 erg cm-2 s-1 (1036 erg s-1). Many of these were likely fainter during the XMM-Newton observations, since the XMM-Newton observations were sensitive to sources of this brightness. In the other direction, there were 109 sources in the S11 catalog in our fields that were not detected by our observations, and 104 of these had 0.2-4.5 keV fluxes below 1.510-14 erg cm-2 s-1. The similar numbers suggest that variability on 10 year timescales (S11 observations were taken from 20002008) is the main cause for the differences. Such variability at the faint end is similar to that seen in a dedicated study of the variability of the XLF in NGC 300 (Binder et al., 2017), where a large fraction of the sources below 41036 erg s-1 varied significantly between epochs. X-ray binaries and AGNs are known to vary on such long timescales (e.g., Mushotzky et al., 1993; McHardy et al., 2005; Kotze & Charles, 2012); however, the photon statistics on the flux measurements are severely limited for these faint sources in M31, making it difficult to quantify their variability. These detections are faint, and only put a lower-limit on their amplitude. It is possible that some of these sources could be truly transient, and change in brightness by more than a factor of 100. More detailed variability analysis of sources in this region detected by XMM will be provided in Sasaki et al. (2018, A&A, submitted), as their more sensitive observations allow for more precise measurements of the X-ray flux.
Two of the brightest sources not seen by both surveys are previously-designated transient outbursts. The brightest source in S11 that is not in our catalog was S11 1416, which had a 0.2-4.5 keV flux of 8.5510-14 erg cm-2 s-1, and was shown by them to be a known transient associated with a nova. The brightest source in our catalog that was not in S11 (CXO J004420.54+413702.3) was designated a transient source by Swift (Henze et al., 2015). This source had a 0.2-4.5 keV flux of 3.510-13 erg cm-2 s-1 in our observations. We found no clear optical counterpart candidate for this source inside of its very small error circle, suggesting it is a low-mass X-ray binary.
The only other bright source that does not appear in both catalogs is CXO J004427.13+412258.2, which does not appear in any previous X-ray catalog of M31. This source has a good point source counterpart candidate. In this case, the counterpart candidate is a bright red star, undetected in the UV. The PHAT photometry places it above the tip of the red giant branch, and it is in a region with a high star formation rate. This could be a potential supergiant X-ray binary, and would be of particular interest for spectroscopic follow-up.
3. Results
Our final source catalog columns are described in Table 3, and the values are provided in Table 4, including all of the X-ray measurements for each source found in our 7 observations, the mean extinction at that location in M31, a one letter code for our best optical counterpart candidate determination, and descriptions from the visual inspection of the PHAT images. We discuss the characteristics of the sources in detail below.
3.1. X-ray Properties
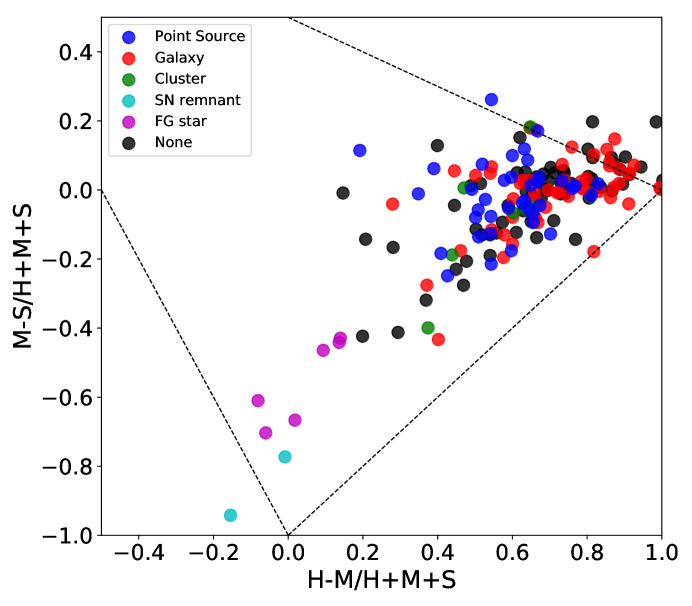
The main goal of this work was to provide exquisite astrometry for the X-ray sources. We did not acquire deep enough data for detailed spectral analysis of the sources. Much of this work is in a complementary XMM-Newton program (Sasaki et al. 2018, A&A, submitted). However, we did measure fluxes in many energy bands, allowing us to examine hardness ratios in the context of the counterpart candidate types. In Figure 8, we plot the hardness ratios of sources with 20 counts (0.35-8 keV, 1.2e-14 erg cm-2 s-1) in our data, color-coding the points by the candidate type. We use fluxes in: S=0.351 keV, M=12 keV, and H=28 keV. We see the well-known separation of SNRs and foreground stars which are soft (Pietsch et al., 2005; Tüllmann et al., 2011), congregating at or below (M-S)/(H+M+S) values of -0.25; however, we also see that all of the hardest sources ((H-M)/(H+M+S) 0.8) with counterpart candidates are background galaxy candidates. While the uncertainties in these ratios, which are0.2, make it difficult to reliably separate source types in this crowded part of the diagram, this distribution hints that sources with very high (H-M)/(H+M+S) ratios may be more likely to be background galaxies. More sensitive observations would be necessary to confirm such a possibility.
3.2. Optical Counterpart Candidates
We found optical counterpart candidates from the PHAT data for 188 sources. These include 6 SNRs, 5 star clusters, 12 foreground stars, 107 resolved background galaxies, and 58 point sources. There were also 185 sources with no clear PHAT counterpart candidate. Below we discuss each of these source types in turn.
3.2.1 Supernova Remnants, Star Clusters, and Foreground Stars
The SNRs and foreground stars are relatively easy to distinguish in our survey due to their soft X-ray spectra, and their clear detections in radio (e.g., Braun, 1990; Kong et al., 2003; Williams et al., 2004b; Galvin & Filipovic, 2014) and/or narrow-band optical wavelengths (Lee & Lee, 2014, e.g.,).
Six previously-known SNRs were detected in our survey. Table 5 lists the catalog name of the detected SNRs, the S11 source ID #, if the remnant was detected in the radio or the optical, the Lee & Lee (2014) identification number if it exists, the counts in the 0.35-8.0 keV band, the absorption-corrected luminosity in the 0.35-8.0 keV band, if the source shows extent beyond that expected for a point source and if there is any evidence of hard emission (¿2.0 keV). The source extraction region created by ACIS-Extract was examined and adjusted to be larger for these six objects if there was flux outside of the extraction region. As SNRs are not point sources, the measurements in Table 5 are much more reliable for these sources than those in the point source catalog.
Our survey was conducted with the ACIS-I array to maximize the field-of-view. Thus the sensitivity to soft sources such as SNRs is lower than with the S3 CCD on ACIS-S. However, the high angular resolution of the Chandra data enables a search for emission extended beyond that expected for a point source and a search for hard emission that might indicate the presence of a central compact object or pulsar wind nebula. Given that the detected counts range from 5 to 36, a spectral analysis is not feasible. However, the spatial distribution of the counts was examined for evidence of extended emission and the counts above 2.0 keV were examined for evidence of hard emission.
The sources CXO J004513.88+413615.7, CXO J004413.49+411954.1, and CXO J004451.06+412906.6 show evidence for extended emission, but given the limited number of counts it is difficult to estimate the size of the SNR in X-rays. A deeper observation close to on-axis would be required to characterize the spatial distribution as “shell-like” or “center-filled”.
Given that the detected counts range from to 83 counts, the luminosities were determined by assuming an APEC model in XSPEC with a temperature of , neutral hydrogen column density of N, and solar abundances. We fit this model to the data with the only free parameter being the normalization. Two of the SNRs, CXO J004513.88+413615.7 and CXO J004451.06+412906.6, appear in more than one observation, such that the spectral data were combined from the two observations and weighted response files were created using specextract in CIAO. Of the six SNRs detected, only CXO J004451.06+412906.6 shows evidence for hard emission, there is a clear excess at high energies that can not be well fitted by an APEC model with . Therefore a power-law component was added to the spectral model with a fixed index of and a variable normalization. The hard counts appear to be centrally concentrated, whereas the soft counts appear around the periphery of the hard counts. A much deeper observation would be required to confirm this morphology. CXO J004451.06+412906.6 is a promising candidate for a central compact object and/or pulsar wind nebula.
The 5 star clusters were well known globular clusters. Two of our sources match to S11 sources that were globular cluster candidates in their survey, but do not appear as clusters in the PHAT data. Source 004343.00+412850.0, which matches to S11 source 1289, had a tentative S11 classification as a globular cluster, but the HST image shows a well-resolved background galaxy at the source location. Source 004353.65+411655.4, which matches to S11 source 1327 had a tentative S11 classification as a globular cluster, but the PHAT data shows no globular cluster at the X-ray source location. This source is particularly interesting as it is very bright in X-rays but has no outstanding optical source in the error circle. These traits may make this source an X-ray binary candidate.
The 12 foreground stars we detected have mostly been previously identified. These are easily seen from the ground as they appear very bright in the optical. Thirteen of the objects in our field matched to S11 are foreground stars. Eleven of the sources classified as foreground by S11 were independently matched to foreground stars by us. In 2 cases, sources that were classified as foreground stars in S11, were not classified as foreground stars by us. One of these (CXO J004541.06+412752.7) was outside of the PHAT footprint. The other (CXO J004532.11+414527.4) is extended in the PHAT data, suggesting a background galaxy. In one case, CXO J004604.55+414943.7, we see a foreground star, but S11 classified this object as a SNR candidate. The source is very far off axis, where the point spread function is 8′′, so the position uncertainty is large and we cannot determine if the source is extended. The foreground star is just outside of the one-sigma position uncertainty, so this source classification is still quite uncertain.
One source was near a foreground star, but the small Chandra uncertainties show that it is unlikely to be associated. Source CXO J004427.13+412258.2 is just 1′′ away from of foreground star, but the star is clearly outside of our Chandra error circle, and the hardness ratio is harder than those of typical foreground stars. This source is a newly detected transient by our survey, and the PHAT data show a bright M31 star in the error circle, making it likely to be an X-ray binary in M31.
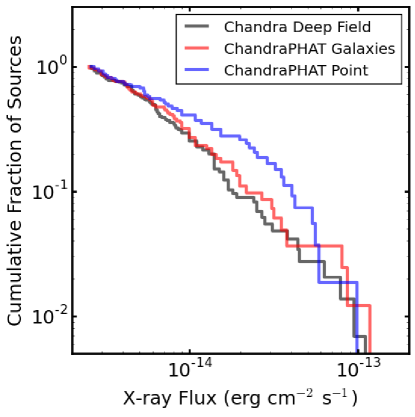
3.2.2 Background Galaxies
Figure 9, compares the 0.5-7 keV flux distribution of our galaxies (90% of the 0.35-8 keV flux) to the 0.5-7 keV flux distribution of the Luo et al. (2017) Chandra Deep Field catalog for fluxes 310-15 erg cm-2 s-1. The distribution has been normalized so that both samples have a total of 1. The remarkable similarity suggests that our counterpart candidates are correct for these sources, and they are indeed background. Our high fraction of background galaxies (57% of our counterpart candidates) is consistent with statistical estimates for the background contamination in the M31 field. The 107 background galaxies we have identified can now be removed from studies attempting to obtain a cleaner sample of M31 X-ray sources. After removing the 188 sources with counterpart candidates from the sample, there are 185 sources without candidates. Based on scaling relations (e.g., Lehmer et al., 2014), we expect 100 LMXBs in this region based on the stellar mass. Thus, it is likely that about another hundred sources in our catalog are still unidentified background galaxies, which is also consistent with expectations from the Chandra Deep Field, as discussed below.
The by-eye search of the PHAT data identified resolved background galaxies for roughly half of the total number expected from deep field statistics. Because of the uncertain impact of the presence of M31 on the detection of background sources, we can only make sensible estimates of the total number to expect as a sanity check. Based on the Chandra Deep Field (Luo et al., 2017), we expect about half of our survey area (roughly 0.2 deg2) to be sensitive to background sources down to 0.35-8 keV fluxes of 310-15 erg cm-2 s-1. Luo et al. (2017) measured 1000 sources deg-2 down a 2-7 keV flux level of 10-15 erg cm-2 s-1, suggesting that roughly 200 of the sources we detected are background galaxies. If there are another 90 background galaxies in our sample (200-107), their host galaxies were too faint or too absorbed to be seen in the PHAT images. The AV distribution of the source locations (see Section 3.3) does not appear to have many areas of high extinction, so optical counterpart intrinsic faintness may be more to blame for non-detections than absorption. Some fraction of our point source candidates could also be AGN where the host galaxy was too faint in the optical for us to detect. In any case, the number of unidentified sources appears to be consistent with a combination of the expected number of LMXBs given the M31 stellar mass and the expected number of additional background galaxies from the Chandra Deep Field.
Among the large number of high-quality new galaxy candidates behind M31 we have found, one of our AGN had been previously identified by Williams et al. (2014a) as an HMXB candidate. In that study, spectra were obtained for blue sources detected in ground based images within the error circles of the XMM-Newton catalogs of M31. One of these was the strong S11 HMXB candidate 1716, which is our source CXO J004556.98+414832.0. The blue star was spectroscopically determined to be a high mass star in M31; however, in this case, the Chandra position and HST imaging reveals a red background galaxy at the position of the X-ray source, while the bright blue M31 star is about 2′′ away from the Chandra position. Here is a case where the improved image quality revealed a complex location that was over-simplified with lower resolution X-ray and ground-based optical data.
3.2.3 Point Sources
In Table Comparing Chandra and Hubble in the Northern Disk of M31, we list the subset of sources with stellar counterpart candidates in the PHAT survey, along with the PHAT positions and photometry. Three of our sources (CXO J004537.84+414856.7, CXO J004537.67+415124.4, and CXO J004502.33+414943.1) contained both a UV point source and a background galaxy in the Chandra error circle. In these cases, we made a note of the galaxy in the notes column; however, we take the UV emission as the strongest sign of the counterpart. Thus, these sources received “p” designations in the catalog, and we included these in our point source analysis. Figure 9 shows that the flux distribution of these sources differs from that of galaxies in that the point sources tend to be brighter, consistent with this sample is probing a separate population that contains a larger fraction of sources in M31.
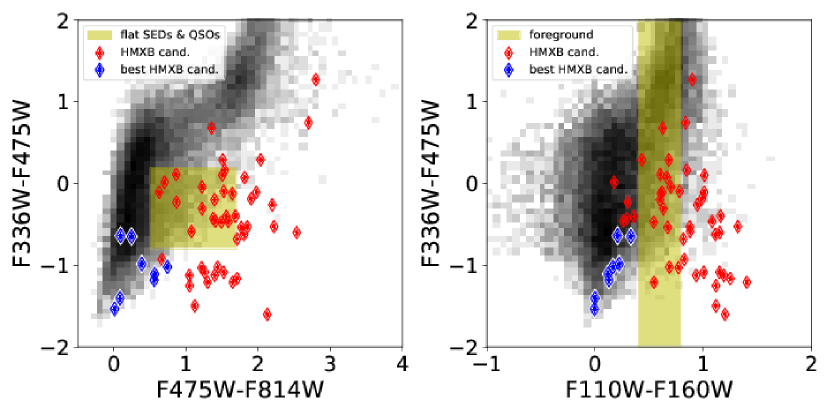
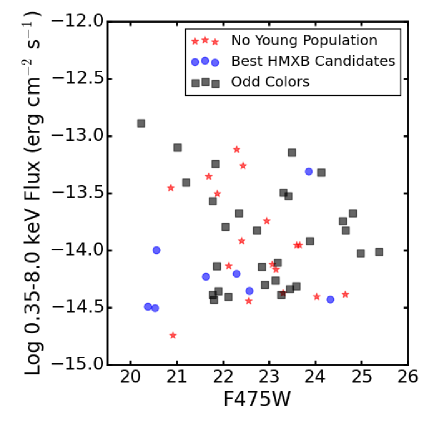
The PHAT point source counterpart candidates mostly have non-standard colors. These colors made them stand out in the PHAT imaging allowing us to identify them as very good counterpart candidates because any contribution from an accretion disk or irradiation from the X-ray source may cause non-standard colors. As shown in Figure 5, some of the colors are consistent with the relatively flat spectral energy distributions expected for AGN, which argues against these objects belonging to M31. However, since these colors may also be due to a hot X-ray source in a binary system and these counterpart candidates are too optically bright to be low-mass X-ray binaries, we include all of these sources as potential high-mass X-ray binaries. We plot the X-ray fluxes vs. the optical (F475W) magnitudes of these sources in Figure 9, and the best HMXB candidates generally fall at lower X-ray fluxes than the other candidates.
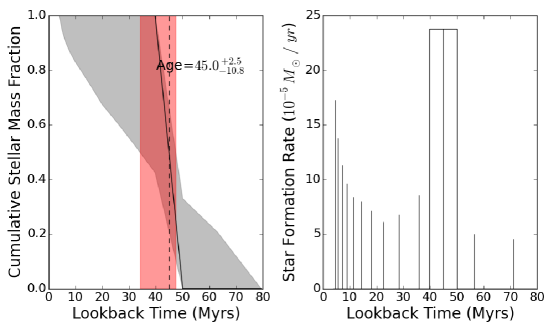
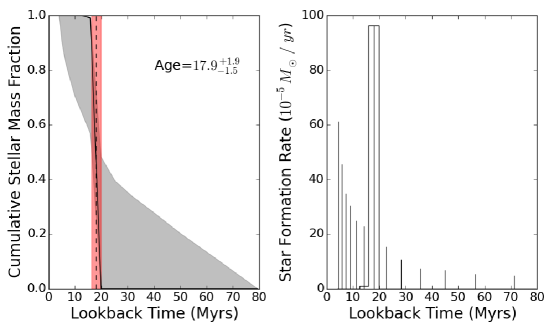
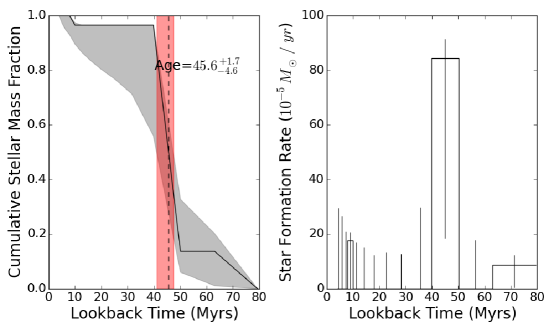
For these PHAT point sources that were not clearly foreground stars (i.e. saturated sources with bright diffraction spikes), we studied the local stellar populations to shed light on their nature. In particular, we would expect HMXBs to reside in young regions. Thus, we used the star formation history results of Lewis et al. (2015) to constrain the age distribution of any co-located population of stars younger than 80 Myr. We then take the dominant age to be the most likely age of the HMXB system. Note that this is not the time since the binary began producing X-rays, but the time since the binary itself was formed. Source CXO J004339.06+412117.6 falls in the portion of the PHAT footprint that was considered too crowed to measure a reliable SFH, leaving 54 sources with local SFH measurements.
Using the local SFHs, we calculate an age probability distribution function. We limit the age as older ages can be significantly contaminated by unassociated stars, which could swamp the signal. In addition, neutron star and black hole primaries likely come from core-collapse SNe, which are produced by stars in this age range. Thus, the main assumptions are that the source is an HMXB and that mass transfer onto the compact object began shortly after the compact object formed. We show a few examples of these star formation histories and age distributions in Figure 10.
HMXB ages, as inferred from their surrounding populations, provide sensitive tests of binary formation and evolution models. The theoretical work of Belczynski et al. (2008) shows the luminosity distribution to be sensitive to star formation history, and Linden et al. (2010) predict that higher metallicity populations of bright HMXBs will have a younger distribution than lower metallicity populations. These predictions have been qualitatively consistent with observations; for example, Antoniou et al. (2010) and Williams et al. (2013) both find that HMXBs have preferred ages at 40-60 Myr, and Antoniou & Zezas (2016) find evidence for a younger HMXB population (6-25 Myr) in the higher metallicity LMC. In M31, we probe the highest metallicity (roughly solar; Venn et al., 2000; Gregersen et al., 2015) extragalactic HMXB sample yet, putting these predictions to an even stronger observational test. If HMXB ages are strongly influenced by metallicity then, since M31 generally has a higher metallicity than the LMC, we should see that in M31, HMXBs are very young (compared to the SMC and LMC).
From these stellar age distributions, we then calculated the stellar mass in each 0.1 dex wide age bin 80 Myr and divided it by the total amount of stellar mass 80 Myr old. This calculation provides the fraction of young stars in each bin, which is a proxy for the probability that the HMXB has that age. The result is a probability distribution function for the age of each HMXB candidate living in a population of stars with ages 80 Myr. These probabilities are provided in Table b. If the counterpart is correct, then this result is our best estimate of the age of the progenitor of the compact object, and the X-ray source is likely an HMXB. In cases lacking a young population (denoted with a “c” in Table Comparing Chandra and Hubble in the Northern Disk of M31), the source is less likely to be an HMXB; however, the counterpart candidate is not ruled out, as it may be a background AGN with a very faint host, a more evolved lower-mass star, or a runaway massive star.
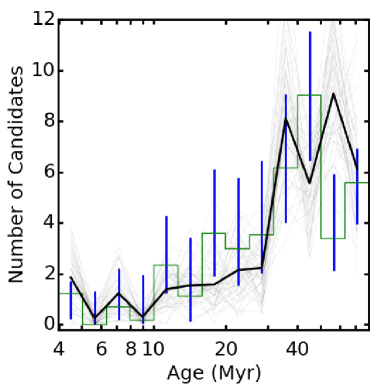
To investigate the age distribution of the HMXB candidates, we added the probability distributions together. Forty of the stellar candidates have a significant detection of a young (80 Myr) population in the Lewis et al. (2015) maps. The sum of the probabilities provides an estimate of the age distribution of our HMXB candidates. We show this distribution for the full sample of point source counterpart candidates, as well as our subsample of the best HMXB candidates in Figure 11. In each panel, the histogram shows the age distribution of the HMXB candidates, and the black lines show 50 draws of SFHs from random draws from the locations of X-ray sources associated with background galaxies in our catalog. We do not include LMXBs as a separate set of candidates here, as they are not distinguishable from undetected background galaxies in our data.
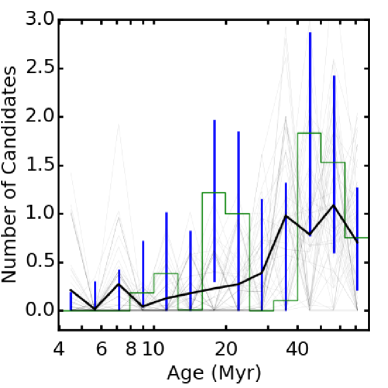
All random background galaxy locations show a higher probability of being older than 30 Myr than being younger. This result suggests that these slightly older populations spread over larger areas than the younger ones. There is a hint that the full point source counterpart sample has a higher fraction of areas with 20 Myr old populations than the control. If we are more conservative in our choice of candidates, choosing only candidates that looked particularly stellar or relatively blue in the PHAT images (marked with blue diamonds in Figure 5), we find the 8 marked with an ‘a’ in Table Comparing Chandra and Hubble in the Northern Disk of M31. Six of these have local SFH measurements, and all 6 are in regions with recent star formation. Their age distribution (right panel of Figure 11) has 2 ages: one at 15-20 Myr, and one at 40-50 Myr.
The 40-50 Myr peak is similar to that found for other samples of HMXB candidates in nearby galaxies, and may be attributable to the characteristic timescale for neutron star formation and B-star activity (Antoniou et al., 2010; Williams et al., 2013). The 15-20 Myr peak is observed in the Large Magellanic Cloud (Antoniou & Zezas, 2016), and appears to coincide with a star formation episode 6-25 Myr ago. These results could be hinting that the star formation rate in M31 has been more continuous than in the much smaller SMC and LMC, allowing HMXBs to form at multiple ages, perhaps through multiple channels. Seeing both ages in M31 suggests that both formation timescales occur at high metallicity, which would point to differences between the Magellanic Cloud populations being more attributable to star formation history than to metallicity.
3.3. Extinction
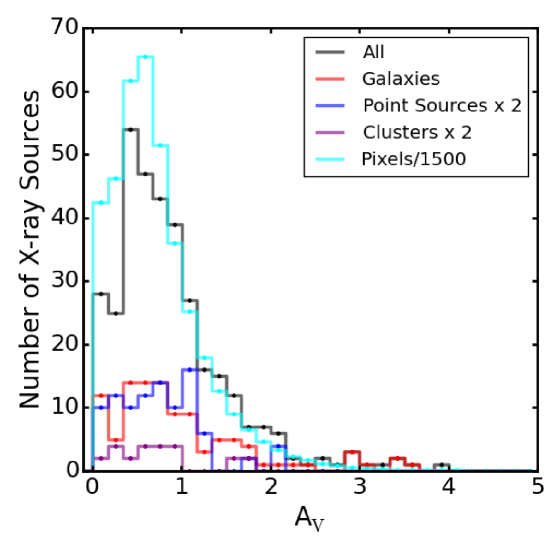
In our catalog, 341 of the sources are located inside the area of the PHAT footprint covered by the Dalcanton et al. (2015) extinction map. For all of these locations, we found the of the 3.3′′ pixel on the Dalcanton et al. (2015) map covering the location. This value is the mean extinction of the M31 stars in that 3.3 region. We report this value in our catalog. However, we note that any individual source may not actually experience the mean extinction depending on its position along the line of sight in the M31 disk. We note that Sasaki et al. (2018, A&A, submitted) has performed spectral fits to the XMM data of many of these sources, finding higher values for the background galaxies, confirming that the mean extinction in M31 does not reflect the full absorption column toward background objects.
We plot histograms of these extinction values in Figure 12 for the complete map, the total sample, and for subsamples broken down by counterpart candidate. Overall, the distributions do not show strong differences. There is no evidence that the X-ray sources or their counterpart candidates are preferentially found in regions of low extinction, as might be expected if dust were strongly inhibiting our ability to detect sources or counterpart candidates. Several of the sources in the highest extinction locations are associated with resolved background galaxies, but the background galaxy distribution has similar extinction values as the full sample distribution.
These distributions all suggest that counterpart candidate determination is not strongly correlated with extinction in M31. Thus, extinction does not appear to be a limiting factor in finding counterpart candidates for X-ray sources in M31. The displaced colors of many of the sources shown in Figure 5 do not appear to be due to dust, which is not surprising since dust would make them much redder than observed in F336W-F475W. Apparently, intrinsic faintness of the counterparts, whether background galaxies or M31 stars, is limiting our ability to find more counterpart candidates. We note that we do not find any good stellar or star cluster counterpart candidates in regions of M31 with mean , but there are very few X-ray sources detected in these dusty regions, and perhaps the X-ray sources in such regions are continuing to go undetected. Such regions are also very rare in M31, which is consistent with the ease of identifying background galaxies through modest dust columns.
4. Conclusions
We have obtained Chandra imaging covering a large fraction of M31 with Hubble Space Telescope imaging obtained by the Panchromatic Hubble Andromeda Treasury (PHAT) survey. Combining these data sets, we have produced a catalog of X-ray sources along with their most likely optical counterparts from HST. These optical counterpart candidate identifications allow background galaxies and high-mass X-ray binaries to be separated from other potential hard sources, such as low-mass X-ray binaries.
-
•
We find that most counterpart candidates are resolved background galaxies, and that there are over 100 of these, which is consistent with the majority of X-ray sources in the M31 disk field being background contaminants if we assume a similar fraction of the sources with no counterpart candidate are undetected fainter background galaxies. This assumption is consistent both with the expected number of background galaxies estimated from the Chandra Deep Field and with the expected number of LMXBs estimated from the PHAT stellar mass.
-
•
We find about a third of the point source counterpart candidates are not associated with any young stellar populations.
-
•
The number of optical point source candidates (58) is larger than the expected number of bright HMXBs in this region, but it is similar to expectations if about half of the 40 candidates in regions with young stellar populations are indeed HMXBs.
-
•
We find 8 of the point source counterpart candidates have colors typical of single stars, suggesting that many of the point sources in this sample are background galaxies. The number of good HMXB candidates is somewhat below the number expected from the star formation rate and number of OB stars in the region surveyed; however, some of the other point source candidates could be HMXBs with odd colors due to binarity. Further observations will be necessary to determine if M31 actually has as many bright HMXBs as predicted by scaling relations.
-
•
We find that the age distribution of the young populations surrounding the point source counterpart candidates (including the 8 with typical star colors), is peaked at 15-20 Myr and 40-50 Myr in agreement with previous studies in other nearby galaxies (Antoniou et al., 2010; Williams et al., 2013; Antoniou & Zezas, 2016), but at higher metallicity.
-
•
Based on the extinction results here, dust does not appear to be significantly impeding the searches for optical counterparts.
The production of this catalog is only the beginning of the Chandra-PHAT program. We are currently working to perform and study MCMC fits to the spectral energy distribution from the PHAT photometry of all of the sources within 3- of X-ray sources using the Bayesian Extinction and Stellar Tool (BEAST Gordon et al., 2016) similar to those done for the NuSTAR sources in Lazzarini et al. (2018). These fits will likely provide further confirmation of our original classifications presented here, and may result in a few new classifications in cases where there were no obvious candidates in our CMDs or images. Furthermore, the SED fits should allow us to provide physical parameters for the secondaries. Finally, follow-up spectroscopy of our optical point source candidates will help identify more HMXBs, type their secondaries, and measure orbital periods. In turn, we can use all of these measurements in addition to the local star formation histories to place new constraints on X-ray binary formation and evolution models by improving the statistics on their age and mass distributions which the models should reproduce.
Support for this work was provided by Chandra Award Number GO5-16085X issued by the Chandra X-ray Observatory Center, which is operated by the Smithsonian Astrophysical Observatory for and on behalf of the National Aeronautics and Space Administration under contract NAS8-03060. M.S. acknowledges support by the Deutsche Forschungsgemeinschaft (DFG) through the Heisenberg fellowship SA 2131/3-1 and the Heisenberg professor grant SA 2131/5-1. B.W., M.S. & P.P. acknowledge partial support for this research through the Chandra Research Visitors Program.
References
- Antoniou & Zezas (2016) Antoniou, V., & Zezas, A. 2016, MNRAS, 459, 528
- Antoniou et al. (2010) Antoniou, V., Zezas, A., Hatzidimitriou, D., & Kalogera, V. 2010, ApJ, 716, L140
- Belczynski et al. (2008) Belczynski, K., Kalogera, V., Rasio, F. A., Taam, R. E., Zezas, A., Bulik, T., Maccarone, T. J., & Ivanova, N. 2008, ApJS, 174, 223
- Binder et al. (2017) Binder, B., Gross, J., Williams, B. F., Eracleous, M., Gaetz, T. J., Plucinsky, P. P., & Skillman, E. D. 2017, ApJ, 834, 128
- Binder et al. (2013) Binder, B., Williams, B. F., Eracleous, M., Gaetz, T. J., Kong, A. K. H., Skillman, E. D., & Weisz, D. R. 2013, ApJ, 763, 128
- Binder et al. (2012) Binder, B., et al. 2012, ApJ, 758, 15
- Binder et al. (2015) Binder, B., et al. 2015, AJ, 150, 94
- Braun (1990) Braun, R. 1990, ApJS, 72, 761
- Broos et al. (2010) Broos, P. S., Townsley, L. K., Feigelson, E. D., Getman, K. V., Bauer, F. E., & Garmire, G. P. 2010, ApJ, 714, 1582
- Dalcanton et al. (2015) Dalcanton, J. J., et al. 2015, ApJ, 814, 3
- Dalcanton et al. (2012) Dalcanton, J. J., et al. 2012, ApJS, 200, 18
- Dalcanton et al. (2009) Dalcanton, J. J., et al. 2009, ApJS, 183, 67
- Di Stefano et al. (2004) Di Stefano, R., et al. 2004, ApJ, 610, 247
- Fruscione et al. (2006) Fruscione, A., et al. 2006, Proc. SPIE, 6270
- Galvin & Filipovic (2014) Galvin, T. J., & Filipovic, M. D. 2014, Serbian Astronomical Journal, 189, 15
- Garcia et al. (2010) Garcia, M. R., et al. 2010, ApJ, 710, 755
- Gordon et al. (2016) Gordon, K. D., et al. 2016, ApJ, 826, 104
- Gregersen et al. (2015) Gregersen, D., et al. 2015, AJ, 150, 189
- Grimm et al. (2003) Grimm, H.-J., Gilfanov, M., & Sunyaev, R. 2003, MNRAS, 339, 793
- Hatzidimitriou et al. (2006) Hatzidimitriou, D., Pietsch, W., Misanovic, Z., Reig, P., & Haberl, F. 2006, A&A, 451, 835
- Henze et al. (2015) Henze, M., Sasaki, M., Haberl, F., & Hatzidimitriou, D. 2015, The Astronomer’s Telegram, 8227
- Johnson et al. (2015) Johnson, L. C., et al. 2015, ApJ, 802, 127
- Kaaret (2002) Kaaret, P. 2002, ApJ, 578, 114
- Kim et al. (2004) Kim, D.-W., et al. 2004, ApJS, 150, 19
- Kong et al. (2002) Kong, A. K. H., Garcia, M. R., Primini, F. A., Murray, S. S., Di Stefano, R., & McClintock, J. E. 2002, ApJ, 577, 738
- Kong et al. (2003) Kong, A. K. H., Sjouwerman, L. O., Williams, B. F., Garcia, M. R., & Dickel, J. R. 2003, ApJ, 590, L21
- Kotze & Charles (2012) Kotze, M. M., & Charles, P. A. 2012, MNRAS, 420, 1575
- Lazzarini et al. (2018) Lazzarini, M., Hornschemeier, A. E., Williams, B. F., et al. 2018, arXiv:1806.03305
- Lee & Lee (2014) Lee, J. H., & Lee, M. G. 2014, ApJ, 786, 130
- Lehmer et al. (2014) Lehmer, B. D., Berkeley, M., Zezas, A., et al. 2014, ApJ, 789, 52
- Lewis et al. (2015) Lewis, A. R., et al. 2015, ApJ, 805, 183
- Li et al. (2011) Li, Z., Garcia, M. R., Forman, W. R., Jones, C., Kraft, R. P., Lal, D. V., Murray, S. S., & Wang, Q. D. 2011, ApJ, 728, L10
- Linden et al. (2010) Linden, T., Kalogera, V., Sepinsky, J. F., Prestwich, A., Zezas, A., & Gallagher, J. S. 2010, ApJ, 725, 1984
- Luo et al. (2017) Luo, B., et al. 2017, ApJS, 228, 2
- McConnachie et al. (2005) McConnachie, A. W., Irwin, M. J., Ferguson, A. M. N., Ibata, R. A., Lewis, G. F., & Tanvir, N. 2005, MNRAS, 356, 979
- McHardy et al. (2005) McHardy, I. M., Gunn, K. F., Uttley, P., & Goad, M. R. 2005, MNRAS, 359, 1469
- Mushotzky et al. (1993) Mushotzky, R. F., Done, C., & Pounds, K. A. 1993, ARA&A, 31, 717
- Pietsch et al. (2005) Pietsch, W., Freyberg, M., & Haberl, F. 2005, A&A, 434, 483
- Shaw Greening et al. (2009) Shaw Greening, L., Barnard, R., Kolb, U., Tonkin, C., & Osborne, J. P. 2009, A&A, 495, 733
- Stiele et al. (2011) Stiele, H., Pietsch, W., Haberl, F., Hatzidimitriou, D., Barnard, R., Williams, B. F., Kong, A. K. H., & Kolb, U. 2011, A&A, 534, A55
- Supper et al. (2001) Supper, R., Hasinger, G., Lewin, W. H. G., Magnier, E. A., van Paradijs, J., Pietsch, W., Read, A. M., & Trümper, J. 2001, A&A, 373, 63
- Supper et al. (1997) Supper, R., Hasinger, G., Pietsch, W., Truemper, J., Jain, A., Magnier, E. A., Lewin, W. H. G., & van Paradijs, J. 1997, A&A, 317, 328
- Tüllmann et al. (2011) Tüllmann, R., et al. 2011, ApJS, 193, 31
- van Speybroeck et al. (1979) van Speybroeck, L., Epstein, A., Forman, W., Giacconi, R., Jones, C., Liller, W., & Smarr, L. 1979, ApJ, 234, L45
- Venn et al. (2000) Venn, K. A., McCarthy, J. K., Lennon, D. J., Przybilla, N., Kudritzki, R. P., & Lemke, M. 2000, ApJ, 541, 610
- Vulic et al. (2016) Vulic, N., Gallagher, S. C., & Barmby, P. 2016, MNRAS, 461, 3443
- Williams (2003) Williams, B. F. 2003, AJ, 126, 1312
- Williams et al. (2013) Williams, B. F., Binder, B. A., Dalcanton, J. J., Eracleous, M., & Dolphin, A. 2013, ApJ, 772, 12
- Williams et al. (2017) Williams, B. F., Dolphin, A. E., Dalcanton, J. J., et al. 2017, ApJ, 846, 145
- Williams et al. (2004a) Williams, B. F., Garcia, M. R., Kong, A. K. H., Primini, F. A., King, A. R., Di Stefano, R., & Murray, S. S. 2004a, ApJ, 609, 735
- Williams et al. (2005a) Williams, B. F., Garcia, M. R., McClintock, J. E., Kong, A. K. H., Primini, F. A., & Murray, S. S. 2005a, ApJ, 628, 382
- Williams et al. (2005b) Williams, B. F., Garcia, M. R., McClintock, J. E., Primini, F. A., & Murray, S. S. 2005b, ApJ, 632, 1086
- Williams et al. (2005c) Williams, B. F., Garcia, M. R., Primini, F. A., McClintock, J. E., & Murray, S. S. 2005c, ApJ, 631, 832
- Williams et al. (2014a) Williams, B. F., et al. 2014a, MNRAS, 443, 2499
- Williams et al. (2014b) Williams, B. F., et al. 2014b, ApJS, 215, 9
- Williams et al. (2004b) Williams, B. F., Sjouwerman, L. O., Kong, A. K. H., Gelfand, J. D., Garcia, M. R., & Murray, S. S. 2004b, ApJ, 615, 720
| ObsID | RA_NOM (deg) | DEC_NOM (deg) | ROLL_NOM (deg) | Date (YYYY-MM-DD) | Exptime (s) | RMS (′′) |
|---|---|---|---|---|---|---|
| 17008 | 11.06541197 | 41.38758162 | 181.58 | 2015-10-06 | 49141 | 0.08 |
| 17009 | 11.01739502 | 41.57751223 | 215.29 | 2015-10-26 | 49405 | 0.08 |
| 17010 | 11.24607031 | 41.53432975 | 202.70 | 2015-10-19 | 49423 | 0.07 |
| 17011 | 11.37564751 | 41.72352482 | 184.29 | 2015-10-08 | 49429 | 0.07 |
| 17012 | 11.19575165 | 41.86086452 | 196.22 | 2015-10-11 | 48440 | 0.05 |
| 17013 | 11.53451858 | 41.95795668 | 199.11 | 2015-10-17 | 44790 | 0.08 |
| 17014 | 11.58803371 | 42.15469119 | 180.22 | 2015-10-09 | 49139 | 0.08 |
17009 & 004345.50+413657.5 10.9395926 41.6160038 Globular Cluster
17009 004350.29+413248.8 10.9595925 41.5468718 Background galaxy
17008 004356.43+412203.0 10.9851124 41.3674795 Globular Cluster
17008 004407.44+412500.0 11.0310358 41.4166779 Bright Star
17009 004425.57+413633.6 11.1065203 41.6093377 Foreground Star
17008 004429.57+412135.7 11.1231821 41.3599211 Globular Cluster
17012 004442.71+415340.8 11.1779661 41.8946660 Background galaxy
17012 004443.43+415231.1 11.1809490 41.8753160 Background galaxy
17012 004444.88+415154.0 11.1870083 41.8650016 Background galaxy
17011 004525.63+414315.4 11.3567486 41.7209178 Background galaxy
17010 004525.67+413158.2 11.3569586 41.5328505 Background galaxy
17010 004526.81+413217.4 11.3616871 41.5381725 Background galaxy
17010 004527.30+413254.1 11.3637671 41.5483491 Background galaxy
17010 004528.24+412943.9 11.3676874 41.4955348 Background galaxy
17011 004533.35+414330.5 11.3889692 41.7251433 Background galaxy
17011 004545.57+413942.1 11.4398766 41.6617307 Globular Cluster
17011 004556.98+414832.0 11.4874508 41.8088835 Background galaxy
17013 004559.39+415835.9 11.4974523 41.9766692 Background galaxy
17014 004608.29+421054.6 11.5345977 42.1818576 Background galaxy
17013 004609.61+415440.1 11.5400766 41.9111281 Background galaxy
17014 004625.31+420938.0 11.6054444 42.1605639 Background galaxy
17013 004625.71+415526.2 11.6071068 41.9239372 Background galaxy
17013 004627.00+420152.7 11.6125292 42.0313229 Globular Cluster
17014 004627.00+420152.7 11.6125292 42.0313229 Globular Cluster
17013 004630.89+420115.2 11.6286647 42.0208819 Background galaxy
17014 004630.99+420956.1 11.6291078 42.1655802 Background galaxy
. Column Description Src Source number in this catalog ObsID Observation in which the source was measured Catalog Name (CXO J) Unique source identifier from coordinates. Prefix for all is CXO J. RA J2000 Right Ascension DEC J2000 Declination [′′] X-ray position uncertainty in arcsec [′] Off-axis angle in the Chandra observation in arcmin Cts 0.35-8.0 Source Net Counts in the 0.35-8.0 keV band Cts 0.35-1.0 Source Net Counts in the 0.35-2.0 keV band Cts 0.5-8.0 Source Net Counts in the 0.5-8.0 keV band Cts 0.5-1.0 Source Net Counts in the 0.5-1.0 keV band Cts 1.0-2.0 Source Net Counts in the 1.0-2.0 keV band Cts 2.0-4.0 Source Net Counts in the 2.0-4.0 keV band Cts 2.0-8.0 Source Net Counts in the 2.0-8.0 keV band Cts 4.0-8.0 Source Net Counts in the 4.0-8.0 keV band Rate 0.35-8.0 ARF-corrected Count Rate in the 0.35-8.0 keV band Rate 0.35-1.0 ARF-corrected Count Rate in the 0.35-2.0 keV band Rate 0.5-8.0 ARF-corrected Count Rate in the 0.5-8.0 keV band Rate 0.5-1.0 ARF-corrected Count Rate in the 0.5-1.0 keV band Rate 1.0-2.0 ARF-corrected Count Rate in the 1.0-2.0 keV band Rate 2.0-4.0 ARF-corrected Count Rate in the 2.0-4.0 keV band Rate 2.0-8.0 ARF-corrected Count Rate in the 2.0-8.0 keV band Rate 4.0-8.0 ARF-corrected Count Rate in the 4.0-8.0 keV band PNS 0.35-8.0 The probability that no source was at this location in the 0.35-8.0 keV band Flux 0.35-8.0 Energy flux (erg cm-2 s-1) in the 0.35-8.0 keV band (Count Rate * 1.313E-11) Flux 0.35-1.0 Energy flux (erg cm-2 s-1) in the 0.35-1.0 keV band (Count Rate * 1.767E-11) Flux 0.5-8.0 Energy flux (erg cm-2 s-1) in the 0.5-8.0 keV band (Count Rate * 1.272E-11) Flux 0.5-1.0 Energy flux (erg cm-2 s-1) in the 0.5-1.0 keV band (Count Rate * 1.438E-10) Flux 1.0-2.0 Energy flux (erg cm-2 s-1) in the 1.0-2.0 keV band (Count Rate * 5.620E-12) Flux 2.0-4.0 Energy flux (erg cm-2 s-1) in the 2.0-4.0 keV band (Count Rate * 1.443E-11) Flux 2.0-8.0 Energy flux (erg cm-2 s-1) in the 2.0-8.0 keV band (Count Rate * 2.138E-11) Flux 4.0-8.0 Energy flux (erg cm-2 s-1) in the 4.0-8.0 keV band (Count Rate * 3.487E-11) Flux 0.2-4.5 Energy Flux (erg cm-2 s-1) in the 0.2-4.5 keV band (0.35-8.0 keV Count Rate * 9.416E-12) XMM ID Matched source identifier in S11 XMM Class Source classification in S11 PHAT Single letter PHAT counterpart code: n (none), g (galaxy), p (point/star), f (foreground), s (SNR), c (cluster) Mean extinction from Dalcanton et al. (2015) maps Notes Notes from visual inspection of the PHAT images
| Src | ObsID | Catalog Name | RA | DEC | [′′] | [′] | Cts 0.35-8.0 | Cts 0.35-1.0 | Cts 0.5-8.0 | Cts 0.5-1.0 | |
|---|---|---|---|---|---|---|---|---|---|---|---|
| 1 | 17009 | 004320.03+413645.8 | 10.833453 | 41.612731 | 3.7 | 8.51 | 12.0 | 2.3 | 12.0 | 2.5 | |
| 2 | 17009 | 004323.63+413144.8 | 10.848449 | 41.529103 | 1.1 | 8.12 | 73.0 | 1.7 | 73.0 | 1.8 | |
| 3 | 17009 | 004325.01+413554.6 | 10.854213 | 41.598498 | 2.2 | 7.42 | 15.0 | 0.56 | 15.0 | 0.73 |
| Cts 1.0-2.0 | Cts 2.0-4.0 | Cts 2.0-8.0 | Cts 4.0-8.0 | Rate 0.35-8.0 | Rate 0.35-1.0 | Rate 0.5-8.0 | Rate 0.5-1.0 | |
|---|---|---|---|---|---|---|---|---|
| 6.9 | 1.6 | 2.8 | 1.2 | 2.4e-04 | 2.3e-04 | 2.3e-04 | 2.1e-04 | |
| 28.0 | 29.0 | 43.0 | 14.0 | 1.5e-03 | 2.5e-04 | 1.5e-03 | 2.3e-04 | |
| 6.1 | 2.0 | 8.5 | 6.5 | 3.2e-04 | 5.3e-05 | 3.1e-04 | 5.9e-05 |
| Rate 1.0-2.0 | Rate 2.0-4.0 | Rate 2.0-8.0 | Rate 4.0-8.0 | PNS 0.35-8.0 | Flux 0.35-8.0 | Flux 0.35-1.0 | |
|---|---|---|---|---|---|---|---|
| 1.5e-04 | 4.1e-05 | 9.6e-05 | 3.1e-05 | 1.1e-04 | 3.2e-15 | 4e-15 | |
| 6.6e-04 | 7.4e-04 | 1.5e-03 | 3.5e-04 | 0.0e+00 | 2e-14 | 4.5e-15 | |
| 1.3e-04 | 5.3e-05 | 3.1e-04 | 1.8e-04 | 6.3e-08 | 4.2e-15 | 9.4e-16 |
| Flux 0.5-8.0 | Flux 0.5-1.0 | Flux 1.0-2.0 | Flux 2.0-4.0 | Flux 2.0-8.0 | Flux 4.0-8.0 | Flux 0.2-4.5 |
|---|---|---|---|---|---|---|
| 3e-15 | 3e-15 | 8.2e-16 | 5.9e-16 | 2e-15 | 1.1e-15 | |
| 1.9e-14 | 3.3e-15 | 3.7e-15 | 1.1e-14 | 3.2e-14 | 1.2e-14 | |
| 4e-15 | 8.5e-16 | 7.6e-16 | 7.7e-16 | 6.5e-15 | 6.1e-15 |
| S11 | S11 Class | PHAT | Notes | |
|---|---|---|---|---|
| 1197 | hard | n | ||
| 1213 | hard | g | 0.63 | AP galaxy (XMM-Newton HR agrees) |
| 1217 | hard | n |
| Catalog Name | SPH11 # | Optical/Radio | L&L# | Counts | L(0.35-8.0 keV) | Minimum off-axis | Extended | Hard |
|---|---|---|---|---|---|---|---|---|
| (0.35-8.0 keV) | angle (arc min) | |||||||
| 004624.58+415543.5 | 1793 | Radio (Braun, 1990) | 13.6 | 3.51 | Unclear | No | ||
| 004452.84+415459.7 | 1539 | Optical | 112 | 19.2 | 3.51 | Unclear | No | |
| 004513.88+413615.7 | 1599 | Optical | 124 | 83.1 | 5.03 | Yes | No | |
| 004339.24+412653.2 | 1275 | Optical | 70 | 24.8 | 7.74 | Unclear | No | |
| 004413.49+411954.1 | 1410 | Optical | 87 | 40.5 | 3.39 | Yes | No | |
| 004451.06+412906.6 | 1535 | Optical | 111 | 76.8 | aafootnotemark: | 3.31 | Yes | Yes |
-
a
a Spectral model is APEC plus a power-law.
| Name (CXO J) | CXO RA | CXO Dec | bbfootnotemark: (′′) | PHAT RA | PHAT Dec | F275W | F336W | F475W | F814W | F110W | F160W | Flux 0.35-8.0 |
| 004339.06+412117.6aafootnotemark: | 10.912737 | 41.354885 | 0.66 | 10.912961 | 41.354867 | 23.84 | 23.23 | 23.87 | 23.63 | 23.60 | 23.27 | |
| 004420.18+413408.2aafootnotemark: | 11.084068 | 41.568957 | 0.55 | 11.084035 | 41.568901 | 21.60 | 21.59 | 22.58 | 22.19 | 21.89 | 21.67 | |
| 004445.88+413152.3aafootnotemark: | 11.191148 | 41.531182 | 4.6 | 11.191047 | 41.531859 | 21.58 | 21.28 | 22.30 | 21.55 | 21.17 | 21.00 | |
| 004514.76+415034.5aafootnotemark: | 11.311509 | 41.842926 | 0.77 | 11.311492 | 41.842875 | 18.94 | 19.17 | 20.57 | 20.49 | 99.999 | 99.999 | |
| 004536.13+414702.5aafootnotemark: | 11.400529 | 41.784043 | 0.81 | 11.400650 | 41.784065 | 19.31 | 19.27 | 20.38 | 19.81 | 19.76 | 19.64 | |
| 004537.67+415124.4aafootnotemark: | 11.406964 | 41.856792 | 2.3 | 11.407024 | 41.856355 | 20.60 | 20.46 | 21.64 | 21.08 | 20.95 | 20.82 | |
| 004637.22+421034.5aafootnotemark: | 11.655092 | 42.176248 | 0.75 | 11.655076 | 42.176184 | 18.63 | 19.00 | 20.54 | 20.53 | 20.70 | 20.70 | |
| 004639.47+420649.2aafootnotemark: | 11.664470 | 42.113665 | 0.89 | 11.664686 | 42.113558 | 23.70 | 23.69 | 24.33 | 24.24 | 25.71 | 25.50 | |
| 004350.76+412118.1ccfootnotemark: | 10.961516 | 41.355033 | 0.45 | 10.961508 | 41.355045 | 22.78 | 21.16 | 21.69 | 19.84 | 19.13 | 18.25 | |
| 004352.37+412222.8ccfootnotemark: | 10.968197 | 41.372997 | 0.9 | 10.968015 | 41.373104 | 24.50 | 23.10 | 23.30 | 21.90 | 21.43 | 20.83 | |
| 004356.78+413410.9ccfootnotemark: | 10.986584 | 41.569705 | 0.4 | 10.986615 | 41.569631 | 99.999 | 24.75 | 24.65 | 23.15 | 22.33 | 21.32 | |
| 004402.02+414028.8ccfootnotemark: | 11.008427 | 41.674679 | 1.1 | 11.008576 | 41.674590 | 22.10 | 21.10 | 22.13 | 20.69 | 20.05 | 19.36 | |
| 004404.55+413159.4ccfootnotemark: | 11.018958 | 41.533179 | 0.52 | 11.018864 | 41.533169 | 25.89 | 24.14 | 24.03 | 23.17 | 22.34 | 21.74 | |
| 004407.44+412460.0ccfootnotemark: | 11.031002 | 41.416662 | 0.64 | 11.031037 | 41.416678 | 24.86 | 23.06 | 20.93 | 17.31 | 16.20 | 15.49 | |
| 004437.96+414512.6ccfootnotemark: | 11.158149 | 41.753505 | 0.85 | 11.158152 | 41.753489 | 22.95 | 22.84 | 22.95 | 22.32 | 21.45 | 20.45 | |
| 004452.51+411710.7ccfootnotemark: | 11.218808 | 41.286303 | 1.2 | 11.218816 | 41.286414 | 23.15 | 19.75 | 20.88 | 19.83 | 19.42 | 18.48 | |
| 004454.75+411918.3ccfootnotemark: | 11.228112 | 41.321761 | 1.5 | 11.228090 | 41.321657 | 21.11 | 20.92 | 22.41 | 21.29 | 20.62 | 19.50 | |
| 004525.67+413158.2ccfootnotemark: | 11.356948 | 41.532845 | 1.1 | 11.356959 | 41.532850 | 23.26 | 22.47 | 22.56 | 21.04 | 20.25 | 19.47 | |
| 004542.25+420817.9ccfootnotemark: | 11.426039 | 42.138318 | 1.2 | 11.426153 | 42.138378 | 25.84 | 23.30 | 23.60 | 22.38 | 22.01 | 21.38 | |
| 004552.94+420234.0ccfootnotemark: | 11.470589 | 42.042780 | 0.86 | 11.470609 | 42.042771 | 26.52 | 23.84 | 23.67 | 22.14 | 21.32 | 20.48 | |
| 004558.04+420302.9ccfootnotemark: | 11.491829 | 42.050818 | 0.7 | 11.491873 | 42.050830 | 21.00 | 20.97 | 21.89 | 21.23 | 20.59 | 19.76 | |
| 004612.67+421027.8ccfootnotemark: | 11.552784 | 42.174382 | 0.39 | 11.552790 | 42.174390 | 24.12 | 22.55 | 23.08 | 21.31 | 20.76 | 20.09 | |
| 004640.59+415422.8ccfootnotemark: | 11.669118 | 41.906343 | 0.6 | 11.669103 | 41.906427 | 23.59 | 22.18 | 22.44 | 20.25 | 19.43 | 18.49 | |
| 004652.18+421505.8ccfootnotemark: | 11.717403 | 42.251599 | 2.1 | 11.716865 | 42.251591 | 22.42 | 22.03 | 23.15 | 21.75 | 21.38 | 20.19 | |
| 004703.82+420453.0ccfootnotemark: | 11.765906 | 42.081385 | 0.84 | 11.765933 | 42.081374 | 21.56 | 21.14 | 22.30 | 20.59 | 19.90 | 18.65 | |
| 004336.08+413320.4 | 10.900328 | 41.555683 | 0.87 | 10.900361 | 41.555726 | 23.67 | 22.16 | 21.87 | 20.37 | 19.50 | 18.82 | |
| 004357.54+413055.8 | 10.989765 | 41.515488 | 0.49 | 10.989700 | 41.515450 | 24.79 | 22.80 | 23.88 | 22.36 | 22.20 | 21.05 | |
| 004359.83+412435.6 | 10.999304 | 41.409889 | 0.68 | 10.999142 | 41.410006 | 25.81 | 23.47 | 23.59 | 21.95 | 21.50 | 20.89 | |
| 004412.04+413217.4 | 11.050183 | 41.538170 | 0.8 | 11.050257 | 41.538157 | 26.05 | 23.94 | 21.77 | 18.24 | 17.00 | 16.26 | |
| 004412.17+413148.4 | 11.050698 | 41.530100 | 0.36 | 11.050679 | 41.530036 | 22.34 | 21.30 | 21.77 | 20.28 | 19.97 | 19.42 | |
| 004413.18+412911.4 | 11.054915 | 41.486508 | 0.89 | 11.054808 | 41.486368 | 26.49 | 24.06 | 99.999 | 21.33 | 20.66 | 19.91 | |
| 004422.57+414506.5 | 11.094057 | 41.751798 | 0.68 | 11.094097 | 41.751878 | 20.80 | 20.43 | 21.01 | 19.94 | 19.25 | 18.38 | |
| 004424.80+413201.4 | 11.103325 | 41.533731 | 0.41 | 11.103325 | 41.533695 | 25.50 | 24.87 | 24.13 | 21.43 | 19.95 | 19.11 | |
| 004425.73+412242.4 | 11.107221 | 41.378442 | 0.33 | 11.107175 | 41.378477 | 26.06 | 24.94 | 24.65 | 22.62 | 21.88 | 21.45 | |
| 004431.82+415217.2 | 11.132597 | 41.871441 | 0.55 | 11.132547 | 41.871387 | 22.27 | 21.44 | 21.90 | 20.49 | 20.10 | 19.83 | |
| 004448.13+412247.9 | 11.200545 | 41.379973 | 0.71 | 11.200584 | 41.380057 | 23.48 | 23.39 | 24.59 | 22.95 | 21.85 | 20.45 | |
| 004453.33+415159.5 | 11.222218 | 41.866543 | 0.34 | 11.222263 | 41.866515 | 25.05 | 23.09 | 23.19 | 21.22 | 20.47 | 19.85 | |
| 004455.72+415334.6 | 11.232187 | 41.892939 | 0.53 | 11.232176 | 41.892884 | 24.75 | 23.22 | 23.26 | 22.04 | 21.20 | 20.50 | |
| 004459.11+414005.1 | 11.246280 | 41.668081 | 0.9 | 11.246206 | 41.668054 | 26.14 | 22.74 | 22.06 | 20.70 | 19.94 | 19.32 | |
| 004500.89+414309.8 | 11.253707 | 41.719385 | 0.78 | 11.253848 | 41.719425 | 27.47 | 25.15 | 25.38 | 24.51 | 24.42 | 24.11 | |
| 004502.33+414943.1 | 11.259688 | 41.828654 | 0.61 | 11.259761 | 41.828766 | 24.07 | 23.46 | 23.44 | 22.74 | 22.66 | 22.48 | |
| 004510.96+414559.2 | 11.295681 | 41.766440 | 0.43 | 11.295651 | 41.766412 | 23.71 | 22.78 | 23.30 | 21.08 | 20.35 | 19.03 | |
| 004526.67+415631.0 | 11.361109 | 41.941936 | 1.4 | 11.361074 | 41.942056 | 23.01 | 22.34 | 22.74 | 21.05 | 20.62 | 19.46 | |
| 004527.88+413905.5 | 11.366179 | 41.651539 | 0.43 | 11.366180 | 41.651542 | 24.34 | 22.81 | 23.41 | 20.87 | 19.97 | 18.82 | |
| 004528.24+412943.9 | 11.367681 | 41.495538 | 0.42 | 11.367687 | 41.495535 | 19.76 | 19.20 | 20.23 | 19.01 | 18.53 | 17.75 | |
| 004537.84+414856.7 | 11.407660 | 41.815743 | 1.4 | 11.408020 | 41.815702 | 22.74 | 21.69 | 22.12 | 20.74 | 20.43 | 20.14 | |
| 004543.15+415519.4 | 11.429790 | 41.922042 | 1.4 | 11.429859 | 41.922029 | 22.14 | 21.40 | 21.80 | 20.24 | 19.72 | 19.36 | |
| 004550.83+415835.1 | 11.461787 | 41.976427 | 0.58 | 11.461834 | 41.976518 | 22.06 | 21.88 | 23.13 | 22.08 | 21.32 | 20.20 | |
| 004607.50+420855.7 | 11.531257 | 42.148817 | 0.41 | 11.531258 | 42.148852 | 27.37 | 24.31 | 24.98 | 23.27 | 22.69 | 21.88 | |
| 004611.38+415903.9 | 11.547414 | 41.984406 | 0.31 | 11.547478 | 41.984419 | 99.999 | 24.19 | 24.81 | 23.01 | 22.29 | 21.18 | |
| 004611.85+420827.9 | 11.549374 | 42.141082 | 0.28 | 11.549385 | 42.141077 | 99.999 | 24.77 | 23.50 | 20.70 | 19.21 | 18.31 | |
| 004613.49+415043.3 | 11.556209 | 41.845353 | 0.71 | 11.556171 | 41.845410 | 20.34 | 20.12 | 21.20 | 19.94 | 19.60 | 18.60 | |
| 004617.57+415913.6 | 11.573194 | 41.987108 | 0.42 | 11.573203 | 41.987150 | 22.54 | 21.65 | 22.85 | 21.55 | 21.03 | 20.48 | |
| 004630.46+421028.7 | 11.626900 | 42.174642 | 0.43 | 11.626948 | 42.174642 | 24.37 | 22.99 | 22.91 | 21.10 | 20.56 | 19.90 | |
| 004630.68+420947.0 | 11.627815 | 42.163055 | 0.39 | 11.627821 | 42.163064 | 25.10 | 24.55 | 26.15 | 24.02 | 22.66 | 21.45 | |
| 004648.19+420855.4 | 11.700785 | 42.148718 | 0.42 | 11.700789 | 42.148730 | 22.34 | 21.65 | 21.84 | 19.93 | 19.28 | 18.29 | |
| 004648.27+420851.1 | 11.701118 | 42.147536 | 0.55 | 11.701051 | 42.147534 | 22.75 | 21.88 | 22.35 | 20.76 | 20.32 | 19.24 |
-
a
Included in the “best candidate” sample. CXO J004339.06+412117.6 is considered such a candidate, but no SFH is available.
-
b
X-ray source position uncertainty in arcseconds from Table 4.
-
c
No local young population detected.
| Catalog Name | Low Age (Myr)aafootnotemark: | High Age (Myr) | Prob.bbfootnotemark: | err err | |
| 004425.73+412242.4, | 4.0 | 5.0 | 0.000 | 0.077 | 0.000 |
| 004425.73+412242.4, | 5.0 | 6.3 | 0.000 | 0.127 | 0.000 |
| 004425.73+412242.4, | 6.3 | 7.9 | 0.000 | 0.182 | 0.000 |
| 004425.73+412242.4, | 7.9 | 10.0 | 0.000 | 0.254 | 0.000 |
| 004425.73+412242.4, | 10.0 | 12.6 | 0.795 | 0.000 | 0.760 |
| 004425.73+412242.4, | 12.6 | 15.8 | 0.000 | 0.506 | 0.000 |
| 004425.73+412242.4, | 15.8 | 20.0 | 0.000 | 0.460 | 0.000 |
| 004425.73+412242.4, | 20.0 | 25.1 | 0.021 | 0.406 | 0.021 |
| 004425.73+412242.4, | 25.1 | 31.6 | 0.000 | 0.403 | 0.000 |
| 004425.73+412242.4, | 31.6 | 39.8 | 0.000 | 0.409 | 0.000 |
| 004425.73+412242.4, | 39.8 | 50.1 | 0.000 | 0.414 | 0.000 |
| 004425.73+412242.4, | 50.1 | 63.1 | 0.000 | 0.405 | 0.000 |
| 004425.73+412242.4, | 63.1 | 79.4 | 0.184 | 0.136 | 0.184 |
| 004448.13+412247.9, | 4.0 | 5.0 | 0.000 | 0.098 | 0.000 |
| 004448.13+412247.9, | 5.0 | 6.3 | 0.000 | 0.160 | 0.000 |
| 004448.13+412247.9, | 6.3 | 7.9 | 0.000 | 0.232 | 0.000 |
| 004448.13+412247.9, | 7.9 | 10.0 | 0.000 | 0.304 | 0.000 |
-
a
Low and high ages refer to the edges of the age bin. For example, if low age is 4.0 and high age is 5.0, then the Prob. column refers to the probability that the HMXB candidate has an age between 4.0 and 5.0 Myr.
-
b
Probability that the HMXB system has an age in this interval. There are uncertainties on this probability, given by the +err and -err columns.