Resistivity of high pressure phosphorus phases
Abstract
Simple cubic (sc) “black phosphorus” (denoted “BP”), stable at 10GPa, seems an ordinary metal. It has electron-phonon-driven superconductivity at 5-10 K. The A17 phase, stable at atmospheric pressure, has a narrow gap, becomes semimetallic at =1 GPa, and has a smooth transition to topological metal behavior at 5 GPa. The A7 phase, stable for GPa, is metallic, superconducting, and less conventional than the sc phase. Some insights are extracted from analysis of resistivity at various pressures. A surprising order-of-magnitude disagreement between theory and experiment is discussed.
I Introduction
Black phosphorus (BP) becomes metallic under pressure () Bridgman (1914); Jamieson (1963). The absolute resistivity was recently measured by Li et al. Li et al. (2018) at pressures up to 15 GPa, from 1.5K to 300K. The simple cubic phase (stable from =10 to 137 GPa Akahama et al. (1999)) seems a normal metal, and superconducts, at least in the lower range, at K. Analysis of resistivity, with input from density-functional (DFT) band theory, provides a way to extract the electron-phonon coupling constant Poole et al. (2000); Allen (1987).
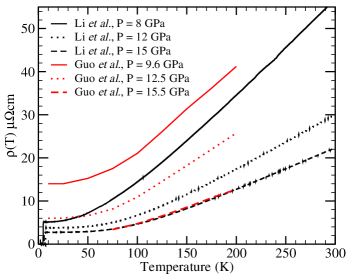
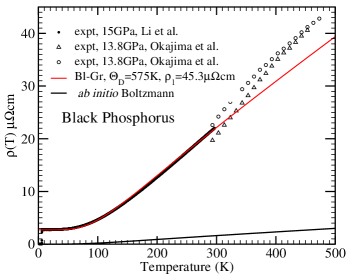
Our analysis for black phosphorus, reported here, indicates that this goes seriously wrong. Therefore it is important to ask how reliable are resistivity measurements at such pressures. The paper by Guo et al. Guo et al. (2017) gives relative resistivities at various pressures. These are compared with the absolute resistivites of Li et al. in Fig. 1. There is general agreement about the shape of the dependence. Higher measurements at 13.8 GPa were published by Okajima et al. Okajima et al. (1984). These are shown in Fig. 2. The data are encouragingly similar to the recent results of Li et al. Li et al. (2018). One can tentatively accept Li’s data as a realistic standard.
The Bloch-Grüneisen formula Bloch (1929); Ziman (1960) for electrical resistivity of a metal is a variational approximation for the solution of the Bloch Boltzmann equation Bloch (1929) for electrons scattering from phonons in metals. It uses a Debye model. The formula is
| (1) |
where is the residual resistivity from impurity scattering, is the Debye temperature, and is given by
| (2) |
The factor from DFT computations will be explained shortly. The term is a normalization factor for the scattering lifetime ; is times a dimensionless factor that, in Bloch-Grüneisen theory is . The equations are
| (3) |
where is the transport version of the dimensionless electron-phonon coupling constant . The dimensionless function is
| (4) |
This assumes a three-dimensional Debye spectrum for the phonons. At large , the factor in parentheses in Eq. 4 goes to 1 and , giving the familiar high linear resistivity. At low , the function becomes times the integral . This gives the familiar temperature dependence. Finally, the factor is
| (5) |
The index is short for , the wavevector, band index, and spin needed to label a state. The derivative of the Fermi function is accurately replaced by a delta function, , so , where is the density of states (per unit volume) at the Fermi level , and is the Fermi surface average of the squared component of the electron’s group velocity. In an anisotropic material, a first guess would be that the conductivity tensor is given by the same formula, except is replaced by . The older terminology “optical mass” is still sometimes used for the mass in the denominator of . The reason for abandoning this terminology is that and are not separately definable except in semiconductors with small carrier densities in a parabolic band. For phosphorus, the choice electrons per atom works fairly well for the sc phase, but not so well for lower phases, or for high phases where electron states start to be occupied.
A more complete theory is also available, using a variational solution of the Bloch-Boltzmann equation Allen (1971) which avoids the Deybe approximation of Bloch-Grüneisen theory:
| (6) | |||||
Here is a modified version Allen (1971) of the function used in Eliashberg theory of electron-phonon superconductors Eliashberg (1960); Scalapino (1969). The additional information in will not overcome the discrepancy between theory and experiment.
Mass renormalization by interactions is another worry. Coulomb renormalization is usually well incorporated in the DFT band masses. Electron-phonon renormalization is seen in ac conductivity Allen (2015), , but drops out in the dc limit.
II fitting experimental resistivity
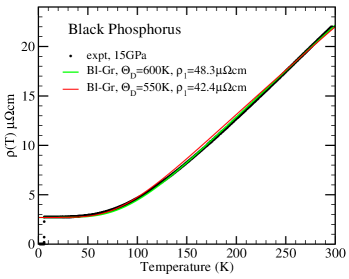
Resistivity measurements by Li et al. Li et al. (2018) cover K, and up to 15 GPa. The sc phase at GPa is the most conventional. Resistivity , and Bloch-Grüneisen fits, are shown in Fig. 3. The fits is as good as normally expected. An even better fit is shown in Fig. 2. In principle there should be deviations from Bloch-Grüneisen because of deviations of the phonon spectrum from Debye. The deviations are particularly small, probably because the sc crystal structure has simple and rather Debye-like phonons.
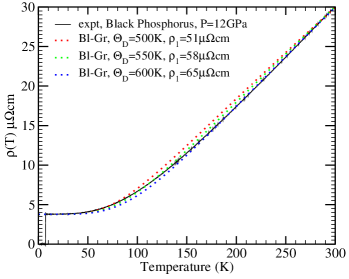
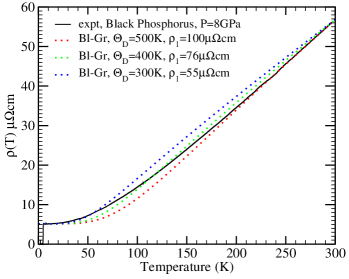
At 12 GPa, the Bloch-Grüneisen fit, shown in Fig 4, is not as good as normally expected, but not totally bad. In the A7 phase at 8 GPa, shown in Fig. 5, the fit doesn’t work. The choice =300K fits at low but fails at higher . The choice =500K fits near room temperature but fails at low . The choice =400K does not work well at either end. What is the reason? Coulomb or impurity scattering would not help. Chan et al. Chan et al. (2013) find the sc structure unstable in harmonic approximation for 20GPa. This suggests the importance of anharmonicity to dynamically stabilize the sc phase at 10GPa20GPa. This anharmonicity probably persists in the lower A7 phase. Perhaps anharmonic phonon-phonon interactions change or even invalidate the Boltzmann quasiparticle theory.
III testing the interpretation
The fitting factor used in Eq. 4 can be written, using Eqs. 2 and 3 as
| (7) |
where is the square of the Drude plasma frequency. For the =15 GPa data of Li et al. Li et al. (2018), values of cm and K give good fits to data. This requires =51.5 (eV)2. The value of can be estimated from the superconducting to be . Chan et al. Chan et al. (2013) compute and diminishing as increases, for 20GPa. Flores-Livas et al. Flores-Livas et al. (2017) and Wu et al Wu et al. (2018) compute . These numbers are well in line with the measured superconducting ’s. If such values are used to fit data, they require a Drude plasma frequency eV. The next section tests this by band calculations. The results for the 15 GPa sc phase are similar to free electron values, with eV. Then should be higher by 16, i.e. 10, an unphysically large value.
IV Electronic structure calculations
Electronic structure calculations have been done for the simple cubic phase by Aoki et al. Aoki et al. (1987), Rajagopalan et al. Rajagopalan et al. (1989), Chan et al. Chan et al. (2013), Flores-Livas et al. Flores-Livas et al. (2017), and Wu et al. Wu et al. (2018). Their results show that a free electron gas model describes the general features of the bands. This is illustrated in Fig. 6. Numerical results are in Table I. These show that sc black phosphorus is reasonably well modeled as a free electron gas. The density of electrons is 5 per atom, with one atom per cell of lattice constant . Values of near at 15 GPa were measured by many authors Akahama et al. (1999); Kikegawa and Iwasaki (1983); Clark and Zaug (2010); Guo et al. (2017).
Density functional theory (DFT) calculations were performed on the sc phase with the projector augmented wave method Blöchl (1994); Kresse and Joubert (1999), as implemented in the Vienna Ab Initio simulation package VASP Kresse and Hafner (1994); Kresse and Furthmüller (1996). A 474747 -point mesh, a plane wave cutoff of 500 eV, and a force convergence tolerance of 2.5 meV/ were employed in structural relaxation and density of states calculations. The sc phases were simulated under pressures of 12 and 15 GPa. The values were calculated using the code BoltzTrap Madsen and Singh (2006) based on band structure from VASP calculations.
| parameter | free electrons | DFT |
|---|---|---|
| 5/ | ||
| 2.23 | ||
| 1.62 | ||
| 2.58m/s | 2.75m/s | |
| 18.9 eV | 17.6 eV | |
| 0.397/eV atom | 0.283/eV atom | |
| 4.13/kg m3 | 3.35/kg m3 | |
| 1.06ms | 0.86ms | |
| 22.8 eV | 20.5 eV | |

If we choose a reasonable value , then the BoltzTraP result 20.5 eV predicts at =300K, using the high limit, resistivity . This is about 8 times smaller than the measured value shown in Figs. 2 and 3. The small theoretical resistivity is a result of the large theoretical value of . Alternatively, if we use the experimental of Figs. 2 and 3, and the BoltzTrap value of , then , an unrealistic range. All known values of are close to Poole et al. (2000); Allen (1987) which has never been observed greater than 2. Large may reflect small phonon frequencies, driven toward lattice instability, as is indeed found in computations Chan et al. (2013) for sc BP when the pressure decreases toward 10GPa. Large would cause the superconducting to be much larger than seen in BP.
Agreement in shape between measured and Bloch-Grüneisen theory is usually a good confirmation of the applicability of the theory. This would suggest that the measured value of is somehow too large by a factor 8. But the similarity in magnitude and shape of the Li et al. data to other experiments argue against this. Also the downward curvature of (seen by Okajima et al. and shown in Fig. 2 at higher ) would be very unusual if the actual were 8 times smaller than reported. It should be mentioned that Wu et al. Wu et al. (2018) compute from first principles. The numerical values shown in Fig. 12 of their paper are only a factor smaller than experiment. However, they apparently use a free electron choice of , and values of similar to those used here. Therefore the plotted magnitude of seem to have been incorrectly enhanced by a factor .
V speculations
Electronic structure calculations Chan et al. (2013); Li et al. (2018) show that in the sc phase, harmonic phonons are not stable unless 20GPa. This can have two interpretations. Either there is a DFT problem, and a correct harmonic theory would have stable phonons, or else, more likely, DFT is correct about the instability of harmonic phonons, and the sc phase is stabilized by anharmonic interactions when 10GPa20GPa. The sc phase is rare in nature. P atoms have small masses and loose packing in the sc phase.. Thus one expects large zero-point vibrations. These factors likely require anharmonic interactions to be included in a correct zeroth order theory. In such a situation, the large displacements can not only stabilize a harmonically unstable phase, but also alter the electron-phonon coupling. Coupling beyond first-order will affect in a way that alters the Bloch-Boltzmann theory from Bloch-Grüneisen form. Then probably one needs to invent a “strongly coupled” theory of lattice vibrations and their interaction with electrons. Numerous thoughts in this direction are available, for example, refs. Kim et al., 2018; Ravichandran and Broido, 2018.
VI acknowledgements
We thank Jianshi Zhou for stimulation, and Jinguang Cheng for help. This work was supported by DOD-ARMY grant W911NF-16-1-0559.
References
- Bridgman (1914) P. W. Bridgman, “Two new modifications of phosphorus.” J. Am. Chem. Soc. 36, 1344–1363 (1914).
- Jamieson (1963) J. C. Jamieson, “Crystal structures adopted by black phosphorus at high pressures,” Science 139, 1291–1292 (1963).
- Li et al. (2018) X. Li, J. P. Sun, P. Shahi, M. Gao, A. H. MacDonald, Y. Uwatoko, T. Xiang, J. B. Goodenough, J.G. Cheng, and J. S. Zhou, “Pressure-induced phase transitions and superconductivity in a black phosphorus single crystal,” in press at PNAS, DOI 10.1073/pnas.1810726115 (2018).
- Akahama et al. (1999) Y. Akahama, M. Kobayashi, and H. Kawamura, “Simple-cubic–simple-hexagonal transition in phosphorus under pressure,” Phys. Rev. B 59, 8520–8525 (1999).
- Poole et al. (2000) C. P. Poole, J. F. Zasadzinski, R. K. Zasadzinski, and P. B. Allen, “Chapter 9 - characteristic parameters,” in Handbook of Superconductivity, edited by Charles P. Poole (Academic Press, San Diego, 2000) pp. 433 – 489.
- Allen (1987) P. B. Allen, “Empirical electron-phonon values from resistivity of cubic metallic elements,” Phys. Rev. B 36, 2920–2923 (1987).
- Guo et al. (2017) Jing Guo, Honghong Wang, F. von Rohr, Wei Yi, Yazhou Zhou, Zhe Wang, Shu Cai, Shan Zhang, Xiaodong Li, Yanchun Li, Jing Liu, Ke Yang, Aiguo Li, Sheng Jiang, Qi Wu, Tao Xiang, R. J. Cava, and Liling Sun, “Electron-hole balance and the anomalous pressure-dependent superconductivity in black phosphorus,” Phys. Rev. B 96, 224513 (2017).
- Okajima et al. (1984) M. Okajima, S. Endo, Y. Akahama, and S. Narita, “Electrical investigation of phase transition in black phosphorus under high pressure,” Jpn. J. Appl. Phys. 23, 15 (1984).
- Wu et al. (2018) Xianxin Wu, H. O. Jeschke, D. Di Sante, F. O. von Rohr, R. J. Cava, and R. Thomale, “Origin of the pressure-dependent valley in superconducting simple cubic phosphorus,” Phys. Rev. Materials 2, 034802 (2018).
- Bloch (1929) F. Bloch, “Über die quantenmechanik der elektronen in kristallgittern,” Zeitschrift für Physik 52, 555–600 (1929).
- Ziman (1960) J. Ziman, Electrons and Phonons (Oxford University Press, New York, 1960).
- Allen (1971) P. B. Allen, “Electron-phonon effects in the infrared properties of metals,” Phys. Rev. B 3, 305–320 (1971).
- Eliashberg (1960) G. M. Eliashberg, “Interactions between electrons and lattice vibrations in a superconductor,” Soviet Physics JETP 11, 696–702 (1960), Russian original - ZhETF, Vol. 38, No. 3, p. 966, September 1960.
- Scalapino (1969) D. J. Scalapino, “Chapter 10 - the electron-phonon interaction and strong-coupling superconductors,” in Superconductivity, edited by R. D. Parks (Marcel Dekker, New York, 1969) pp. 449 – 560.
- Allen (2015) P. B. Allen, “Electron self-energy and generalized Drude formula for infrared conductivity of metals,” Phys. Rev. B 92, 054305 (2015).
- Chan et al. (2013) K. T. Chan, B. D. Malone, and M. L. Cohen, “Pressure dependence of superconductivity in simple cubic phosphorus,” Phys. Rev. B 88, 064517 (2013).
- Flores-Livas et al. (2017) J. A. Flores-Livas, A. Sanna, A. P. Drozdov, L. Boeri, G. Profeta, M. Eremets, and S. Goedecker, “Interplay between structure and superconductivity: Metastable phases of phosphorus under pressure,” Phys. Rev. Materials 1, 024802 (2017).
- Aoki et al. (1987) M. Aoki, N. Suzuki, and K. Motizuki, “Electronic band structure and superconductivity in simple-cubic phosphorus,” J. Phys. Soc. Jpn. 56, 3253–3264 (1987).
- Rajagopalan et al. (1989) M. Rajagopalan, M. Alouani, and N. E. Christensen, “Calculation of band structure and superconductivity in the simple cubic phase of phosphorus,” J. Low Temp. Phys. 75, 1–13 (1989).
- Kikegawa and Iwasaki (1983) T. Kikegawa and H. Iwasaki, “An x-ray diffraction study of lattice compression and phase transition of crystalline phosphorus,” Acta Cryst. B39, 158–164 (1983).
- Clark and Zaug (2010) S. M. Clark and J. M. Zaug, “Compressibility of cubic white, orthorhombic black, rhombohedral black, and simple cubic black phosphorus,” Phys. Rev. B 82, 134111 (2010).
- Blöchl (1994) P. E. Blöchl, “Projector augmented-wave method,” Phys. Rev. B 50, 17953–17979 (1994).
- Kresse and Joubert (1999) G. Kresse and D. Joubert, “From ultrasoft pseudopotentials to the projector augmented-wave method,” Phys. Rev. B 59, 1758–1775 (1999).
- Kresse and Hafner (1994) G. Kresse and J. Hafner, “Ab initio molecular-dynamics simulation of the liquid-metal–amorphous-semiconductor transition in germanium,” Phys. Rev. B 49, 14251–14269 (1994).
- Kresse and Furthmüller (1996) G. Kresse and J. Furthmüller, “Efficient iterative schemes for ab initio total-energy calculations using a plane-wave basis set,” Phys. Rev. B 54, 11169–11186 (1996).
- Madsen and Singh (2006) G. K.H. Madsen and D. J. Singh, “Boltztrap. a code for calculating band-structure dependent quantities,” Comp. Phys. Commun. 175, 67 – 71 (2006).
- Kim et al. (2018) D. S. Kim, O. Hellman, J. Herriman, H. L. Smith, J. Y. Y. Lin, N. Shulumba, J. L. Niedziela, C. W. Li, D. L. Abernathy, and B. Fultz, “Nuclear quantum effect with pure anharmonicity and the anomalous thermal expansion of silicon,” 115, 1992–1997 (2018).
- Ravichandran and Broido (2018) N. K. Ravichandran and D. Broido, “Unified first-principles theory of thermal properties of insulators,” Phys. Rev. B 98, 085205 (2018).