Seeding the second star: Enrichment from population III, dust evolution, and cloud collapse
Abstract
We investigate the formation of extremely metal-poor (EMP) stars that are observed in the Galactic halo and neighboring ultra-faint dwarf galaxies. Their low metal abundances () indicate that their parent clouds were enriched by a single or several supernovae (SNe) from the first (Pop III) stars. In this study, we perform numerical simulations of the entire formation sequence of a EMP star through the feedback effects of photo-ionization and metal-enrichment by a Pop III SN. We for the first time employ a metal/dust properties calculated consistently with the progenitor model, and solve all relevant radiative cooling processes and chemical reactions including metal molecular formation and grain growth until the protostar formation. In a minihalo (MH) with mass , a Pop III star with mass forms at redshift . After its SN explosion, the shocked gas falls back into the central MH internally enriching itself. The metallicity in the recollapsing region is (). The recollapsing cloud undergoes cooling by HD, CO, and OH molecules and heating along with H2 formation. Eventually by grain growth and dust cooling, knotty filaments appear in the central 100 au region with the help of turbulence driven by the SN, leading to the formation of low-mass EMP stars surviving until the present day.
keywords:
galaxies: evolution — ISM: abundances — stars: formation — stars: low-mass — stars: Population III — stars: Population II1 INTRODUCTION
The properties of early-generation stars are crucial to determine structure formation in the first billion years from Big Bang including the first galaxy formation and cosmic reionization. The typical mass scale and initial mass function (IMF) of first-generation metal-free stars (Pop III stars) determine the degrees of photoionization and the metal enrichment in the ambient interstellar medium (ISM) through their supernova (SN) explosions. Conversely, the metal content in collapsing clouds affects the mass range of stars formed (Omukai, 2000; Bromm & Loeb, 2003). Such co-evolution determines the star formation history of the ISM in high-redshift galaxies (see a recent review of Dayal & Ferrara, 2018, and references therein).
In the next decade, instruments such as James-Webb Space Telescope (JWST), SPICA, and Thirty-Meter Telescope (TMT) are planned to directly observe high-redshift galaxies to extend our knowledge of their IMFs and metal content. The prediction of the observational features of high-redshift galaxies and even the first generation of galaxies is an urgent task (see a review of observational features of JWST in Kalirai, 2018). On the theoretical side, cosmological simulations of the first stars and galaxies, including massive star feedback, provide valuable insight of their origin and evolution (Tumlinson, 2007; Salvadori et al., 2007; Wise et al., 2012; Barrow et al., 2017, 2018; Magg et al., 2017; Dayal et al., 2018).
In this work, we focus on another constraint on IMFs in the early Universe. In the halo and bulge regions in the Milky Way galaxy and the neighboring ultra-faint dwarf (UDF) galaxies, ancient stars with metallicities lower than the solar value, so-called metal-poor stars, have been observed. In particular, ones with iron abundances of are called extremely metal-poor (EMP) stars (Beers & Christlieb, 2005). Due to their small metal content, they should inherit the nucleosynthetic features of a single or several parent Pop III SN(e) (Ryan et al., 1996; Cayrel et al., 2004; Chiaki et al., 2018). Constraining the mass scale and explosion mechanism of Pop III stars indirectly through the elemental abundance ratios and metallicities of metal-poor stars is called near-field cosmology or Galactic archaeology (Ishigaki et al., 2018).
The second generation of star formation is the very first matter cycle in the ISM. It begins with Pop III star formation in small gravitationally-bound dark matter (DM) haloes, so-called minihaloes (MHs), with masses at redshift . The first light is emitted during its main sequence, and the first metals are then synthesized and released by its SN if it is massive (– and –; Heger & Woosley, 2002). Metals are incorporated into later star-forming regions, where the cloud collapses and fragments into low-mass clumps (–) by gas cooling of dust thermal emission into the embryos of observed long-lived EMP stars (Omukai, 2000; Schneider et al., 2003; Bromm, 2014).
There are two processes of metal enrichment. One is called external enrichment (EE), where the gas shocked by a Pop III SN reaches a neighboring clump and triggers star formation. The other is called internal enrichment (IE), in which the metal-enriched gas falls back into the DM potential having hosted the Pop III star. Chiaki et al. (2018, C18) showed that both processes occur through a balance between the radiation/supernova energy by a Pop III star and binding energy of MH, and that the latter is the major process for the formation of EMP stars.
The whole process has only been investigated by Smith et al. (2015). They show that an externally enriched clump with metallicity contracts to fragment by dust cooling. Although IE is the major process for the formation of EMP stars (C18), its whole process has not been explicitly followed by three-dimensional numerical simulations in the cosmological context. Machida et al. (2005) and Chiaki et al. (2013) studied the low-mass star formation in the partially enriched SN shell with one-zone and one-dimensional calculations. However, because the propagation of SN shells is highly anisotropic, three-dimensional simulations are required to properly follow the process of metal mixing and gas fragmentation (Ritter et al., 2012). The works of Ritter et al. (2012, 2015, 2016), Sluder et al. (2016), and C18 are limited in the sense that they only consider the recollapse of the shocked gas, i.e., the succeeding protostar formation and cloud fragmentation are not followed.
In low-metallicity clouds, various heating/cooling processes are present. Chiaki et al. (2016, C16) followed the cloud collapse with metallicities –. They showed that rapid gas heating along with H2 molecular formation prevents fragmentation in the most cases even though the dust cooling is efficient later. In other cases where OH/H2O molecular cooling operates, fragmentation along the filamentary structure appears. In C16, metals are uniformly added in static clouds. In the shock-driven cloud collapse, the dynamical timescale becomes shorter so that the efficiencies of these heating/cooling processes might be suppressed. Furthermore, the turbulence driven by SN shocks will enhance the fragmentation (Dopcke et al., 2011, 2013). To properly know how the hydrodynamic evolution is coupled with the chemical processes, it is required to follow the cloud collapse with full calculations of chemistry and gas heating/cooling in these shock-driven star-forming clouds.
The metal and dust properties produced from a Pop III SN are a key ingredient in these calculations (Bovino et al., 2016; Grassi et al., 2017). In the recollapsing region, the metal and dust compositions and dust size distribution are assumed to directly inherit the nucleosynthesis and nucleation in Pop III SN ejecta (Tanaka et al., 2017). Type-II SNe yield more abundant alpha elements () than measured in the present-day including the contribution of Type-Ia SNe (Umeda & Nomoto, 2002). This elemental abundance enhances O i fine-structure cooling and OH/H2O molecular cooling. Although dust grains are formed in expanding ejecta, they are partly destroyed by reverse shock, and return to the gas phase (Bianchi & Schneider, 2007; Nozawa et al., 2007). Consequently, the condensation efficiency of metal (dust to metal mass ratio) is smaller (a few %) than in the present-day (50%), where all refractory elements (Mg, Si, and Fe) are locked up into grains (Pollack et al., 1994). On the other hand, grains can grow by accreting the gas-phase metal (grain growth) in a molecular clouds, which enhances the dust cooling efficiency (Chiaki et al., 2015, C15).
In this work, we for the first time to follow the full process from Pop III to Pop II star formation via IE in a three-dimensional cosmological simulation with all relevant chemistry and heating/cooling processes. We calculate the metal and dust models employed in this study with accurate nucleosynthesis and nucleation models of a Pop III SN. We describe our numerical models in Sec. 2 and the results in Sec. 3. Then, we discuss importance of physical processes included in this work and caveates (Sec. 4). The application of our results to Galactic Archaeology is discussed in Sec. 5. Finally, we provide summary and conclusion of this work in Sec. 6.
2 Numerical models
2.1 Simulation setup
We use the -body/adaptive mesh refinement (AMR) cosmological hydrodynamics simulation code enzo (Bryan et al., 2014).111http://enzo-project.org/ To follow the evolution of shocks with high Mach numbers, a grid-based code is useful relative to smoothed particle hydrodynamics (SPH) codes by which the spurious surface tension affects the hydrodynamics (also see Saitoh & Makino, 2013; Hopkins, 2013; Rosswog, 2015). The code solves the hydrodynamics equations with the Piecewise Parabolic Method (PPM) in an Eulerian frame while using a two-shock Riemann solver. In the hydrodynamics equations of enzo PPM solver, the fixed adiabatic index has been imposed. At densities , the gas becomes fully molecular at low metallicities , and approaches 7/5. If remains 5/3 in the molecular regime, this causes spurious heating. To avoid this, we have modified the hydrodynamics solver to consider a variable value.
For the study of star formation and expansion of dense cooling shells, the AMR technique can capture the inherently wide dynamic range of length and density of this problem. We adopt the following cosmological parameters in the simulation: , , , and (Planck Collaboration et al., 2016). We initialize the periodic simulation volume with a side length of 300 comoving kpc at redshift with MUSIC (Hahn & Abel, 2011). We initially perform a small pathfinder simulation with only dark matter to identify the most massive halo at that has a mass of . We then reinitialize and recenter the simulation by resampling its Lagrangian volume at increasing the mass and spatial resolution by a factor of 64 and 4, respectively, i.e. two additional initial AMR levels. The Lagrangian volume considered is a sphere centered on the target halo with a radius of five times the virial radius. In the “zoom-in” region, we have an effective initial resolution of and a mass resolution of , resolving the halo by approximately 50,000 particles. Although this simulation size is smaller than most cosmological simulations of metal-free and metal-poor star formation, it was necessary to reduce its computational size because of the expense of the solving a detailed chemical network that includes a live dust model. In the end, the full simulation required 33 days on 224 cores, consuming 177,000 core-hours. We terminate the simulations when the first metal-enriched hydrostatic core forms at a density of . We perform all of the analysis in this paper with the yt toolkit (Turk et al., 2011).
Computational cells satisfying criteria below are progressively refined by a factor of two in space up to 33 refinement levels, resulting in a maximal spatial resolution of 0.01 au. We smooth the dark matter density field at scales below 1 comoving pc (AMR level 12). At these scales, the gas density dominates, and by smoothing the dark matter density, we remove any artifacts, i.e. heating in the wake of individual massive particles, associated with the discrete representation of the dark matter mass distribution (e.g. Abel et al., 2002). We employ the following refinement criteria:
-
(i)
the baryon mass in a cell on a refinement level exceeds times the mean baryon mass on the root grid,
-
(ii)
the DM particle mass in a cell exceeds three times the initial mass,
-
(iii)
the local Jeans length is less than 64 times the cell size.
We allow Pop III star formation in regions where a cell satisfying the following criteria (Wise et al., 2012):
-
(i)
the physical gas density exceeds ,
-
(ii)
the gas flow is convergent (),
-
(iii)
the cooling time is less than the dynamical time,
-
(iv)
the metallicity is less than the critical value (),
-
(v)
the H2 fraction exceeds a critical value () that is typical for the collapsing primordial cloud at the critical density (i).
Because we focus on the feedback effects of a single Pop III star in this work, the formation of secondary Pop III stars is artificially prohibited. The mass of a Pop III star is sampled from the IMF of
| (1) |
where is the characteristic mass of Pop III stars, and . We regard the star particle as a radiation point source, and solve the radiative transfer equation with Moray (Wise & Abel, 2011) during the lifetime of the star. Then the supernova energy of erg and metal is added within the radius of 10 pc. Although the stellar core is stratified just before the explosion, where heavier elements such as iron reside inner region, we assume uniform i.e. fully-mixed ejecta, considering hydrodynamical instabilities (Chen et al., 2017). Metals are initially contained in the ejecta surrounded by the ambient medium through a contact discontinuity (CD) that is placed at a radius of 7.5 pc, which is appropriate for the energy-conserving phase. The metals can penetrate through this barrier into the ambient gas when the shock undergoes Rayleigh-Taylor (RT) instabilities on the CD.
2.2 Chemistry and cooling
We use the chemistry/cooling library grackle, generalized to adopt simulation codes with various schemes (Smith et al., 2017).222https://grackle.readthedocs.io/ The original version presented by Smith et al. (2017) solved the chemical reactions of at most 12 primordial species and radiative cooling of the relevant species. The metal cooling rates were interpolated from tables calculated by cloudy (Smith et al., 2008). The dust temperature and cooling efficiency were solved based on the dust model in the interstellar medium (ISM) in the vicinity of the solar system (Pollack et al., 1994; Omukai, 2000). grackle is well-designed to supplement the default chemical reactions and cooling functions with user-defined ones. In order to follow the abundances and cooling efficiencies of 48 chemical species of metal elements and dust as well as primordial elements for a wide range of density () and gas temperature ( K), we add the corresponding chemical reactions, cooling functions, and opacities described in the subsequent sections. We also modified the scheme to solve the ordinary differential equations of reaction rates from the backward differential formula (Anninos et al., 1997) to an implicit scheme.
2.2.1 Primordial chemistry and cooling
We extend grackle’s chemical network of primordial species to include 49 reactions for 15 primordial species: , , , , , , , , , , , , , , and (C18) by adding , , and , which are important in the high-redshift intergalactic medium (; Galli & Palla, 2013). The reactions include the collisional ionization/recombination and formation/destruction of H2 via H-/H processes and three-body reactions.
We include gas heating along with H2 molecular formation, which is important to suppress the gas elongation and fragmentation (C16). For K, we consider bremsstrahlung, inverse Compton cooling, ionization/recombination and transition line cooling of H- and He-bearing species. For K, we calculate the molecular cooling rates by H2 and HD. The radiative cooling rate of H2 molecules are calculated for each line transition between 20 rotational and 3 vibrational levels. For HD, we consider 3 vibrational levels.
For molecular cooling, the emission rate is reduced by the corresponding photon escape fraction , where is the optical depth for each transition line. In this formula, is the absorption coefficient including stimulated emission, and is the shielding length as the minimum between the Sobolev length, where the relative velocity of the fluid becomes equivalent to line width of the order of thermal velocity , and the Jeans length (Takahashi et al., 1983). For simplicity, we here estimate the velocity gradient as under the one-zone approximation (Omukai, 2000). We will present the formulation of continuum opacity in Section 2.2.3.
Throughout the simulation, hydrogen mass fraction is a constant . Although the helium fraction is enhanced just around a SN ejecta, the He-rich gas is diluted by the ambient pristine gas. The density is expressed as the number density of hydrogen nuclei with mass density throughout this paper.
2.2.2 Metal chemistry and cooling
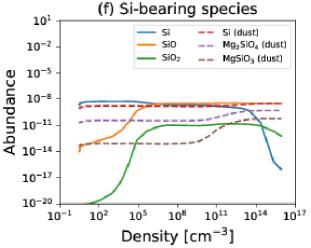
The metal cooling is important to determine the fragmentation properties of low-metallicity gas in the early stage of collapse (Bromm & Loeb, 2003). In particular, metal molecules such as OH and H2O can overcome heating associated with H2 formation to enhance fragmentation (C16).333Although CO is important in the present-day ISM, not in the low-metallicity ISM affected only by massive Pop III SNe (; C16, ). We for the first time follow the abundances of their different phases (ions, atoms, and molecules) in three-dimensional simulations of Pop III SNRs, considering 40 reactions for the 19 species: C+, C, CH, CH2, CO+, CO, CO2, O+, O, OH+, OH, H2O+, H2O, H3O+, O, O2, Si, SiO, and SiO2. We solve recombination of C+ and formation of molecules CH, CH2, CO, and CO2. For O-bearing species, recombination/charge transfer of O+ and OH, O2, and H2O formation is included. Atoms of Si are oxidized into SiO and SiO2 molecules in the course of collapse (C16).
The fine-structure level transition line cooling of C+, C and O for the systems of 2, 3, and 5 levels are considered, respectively (Santoro & Shull, 2006). The photon escape fractions are estimated in the same manner as H2 and HD. We calculate the cooling rates by rotational level transition of OH, H2O, and CO by interpolating the tables of Neufeld & Kaufman (1993), Neufeld et al. (1995), and Omukai et al. (2010), respectively.
2.2.3 Dust physics
Dust grains play a crucial role in determining the final fate of a cloud by enhancing gas cooling efficiency and thus inducing fragmentation (e.g. Smith et al., 2015; Safranek-Shrader et al., 2016, C16). They modify the thermodynamics of gas in the four aspects:
-
(1) H2 molecular formation on grain surfaces,
-
(2) continuum opacity,
-
(3) gas cooling by dust thermal emission, and
-
(4) accretion of gas-phase metal onto grains (grain growth: C15, ).
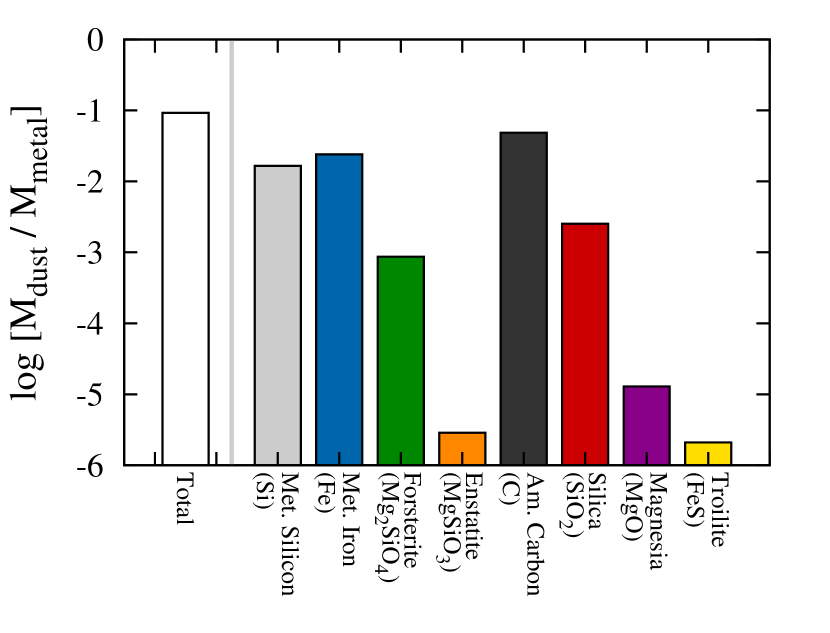
To self-consistently consider the properties of dust grains released by Pop III SNe, we derive these efficiencies separately with grain radii Å– with 0.1 dex interval for eight grain species: metallic silicon (Si), metallic iron (Fe), forsterite (), enstatite (), amorphous carbon (C), silica (), magnesia (), and troilite ().
The continuum opacity is estimated as , where and are the Planck mean opacity of the primordial gas (Mayer & Duschl, 2005) and a grain species (Nozawa et al., 2008), and is the mass density of a grain species . We use the Jeans length as the shielding length for simplicity. The continuum cooling rates such as collision-induced emission (CIE) and dust thermal emission are reduced by a factor of under the diffusion approximation.
For densities , grain growth is present and can enhance cloud fragmentation (C16). We simultaneously compute the loss of elements Mg, Al, S, and Fe, assuming that they all are in the form of atoms. Carbon grains grow through impact of carbon atoms. Since C atoms are rapidly oxidized to form CO molecules at density , growth of carbon grains can occur if the number abundance ratio . Silicate grains grow by accreting Mg, SiO, and H2O molecules. Since the dominant Si-bearing species at is SiO, we expect that silicate grains grow in the Pop III SN dust models.
The formulation of the rates of (1)–(4) explicitly described in our previous paper (C15) depends on the grain temperature. To calculate it, many iterations are required to solve the energy balance equation between gas-dust heat transfer rate and dust thermal emission rate for each grain species and size bin. In order to reduce the computational costs, these rates have been tabulated for each grain species, and are interpolated from density (), gas temperature (), density of a grain species (), and density of the corresponding key element () of a fluid cell at each timestep. In this strategy, we successfully include the effect of grain growth (See Appendix A for the detailed description).
2.3 Pop III supernova yields
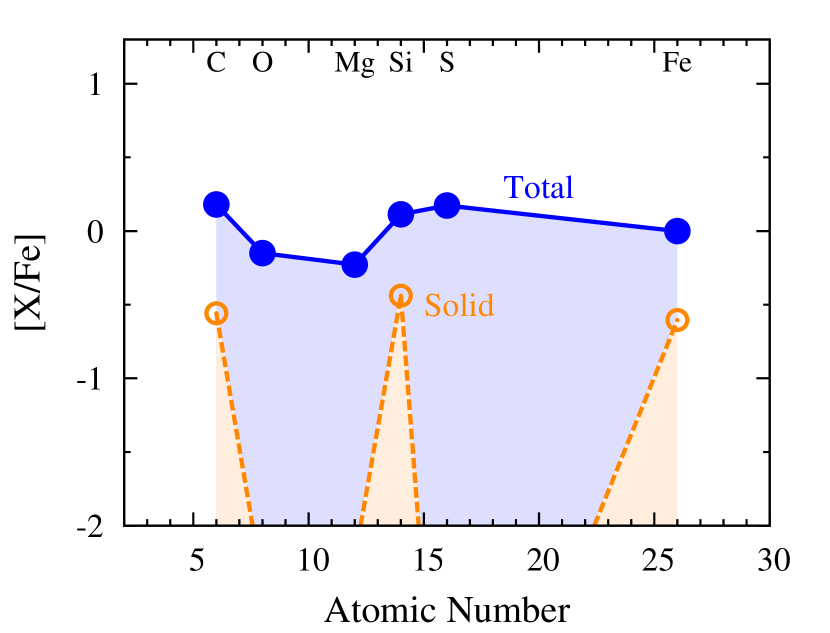
In this paper, we employ the Pop III SN model in a hydrodynamic evolution of a SN remnant and star-forming clouds self-consistently. In this simulation, a Pop III star with mass forms. Metal and dust abundances and dust size distribution are taken from Umeda & Nomoto (2002) and Nozawa et al. (2003, 2007) for the progenitor mass , explosion energy erg, and ambient gas density . The progenitor model is tailored to be consistent with the averaged elemental abundances of EMP stars presented by Cayrel et al. (2004).
The blue solid curve of Fig. 1 show metal abundances. We briefly summarize the different and common points of them with respect to those in the present-day ISM. In general, Pop III SN models show the alpha-element abundance enhancement relative to the solar abundance ratio (). In a model with a mass of , however, O and Mg are slightly underabundant relative to solar ( and , respectively). Instead, Si and S are slightly overabundant ( and , respectively). We here focus on the progenitor model with a C-normal abundance (). Note that there are another classification of EMP stars with C-enhanced abundance ratio (; see Sec. 5).
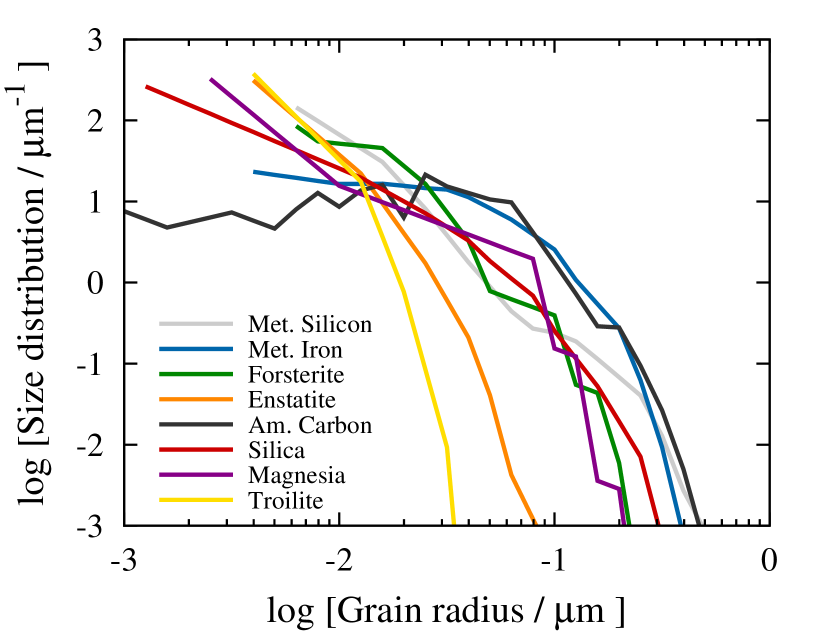
The orange dotted curve of Fig. 1 shows the condensation efficiency of each element. Figs. 2 and 3 show dust abundances and size distribution. The mass ratio of dust relative to metal (condensation ratio) is only 9.3%, which is less than that in the present-day ISM by a factor of five. The major species are initially metallic silicon and amorphous carbon. Silicate grains (forsterite and enstatite) are less abundant before grain growth occurs (see C15, ). The size distribution is proportional to (Nozawa et al., 2007) as in the present-day (Pollack et al., 1994).
Throughout this paper, metallicity is normalized by the solar metallicity and the solar elemental abundance ratio is taken from Asplund et al. (2009).
3 Results
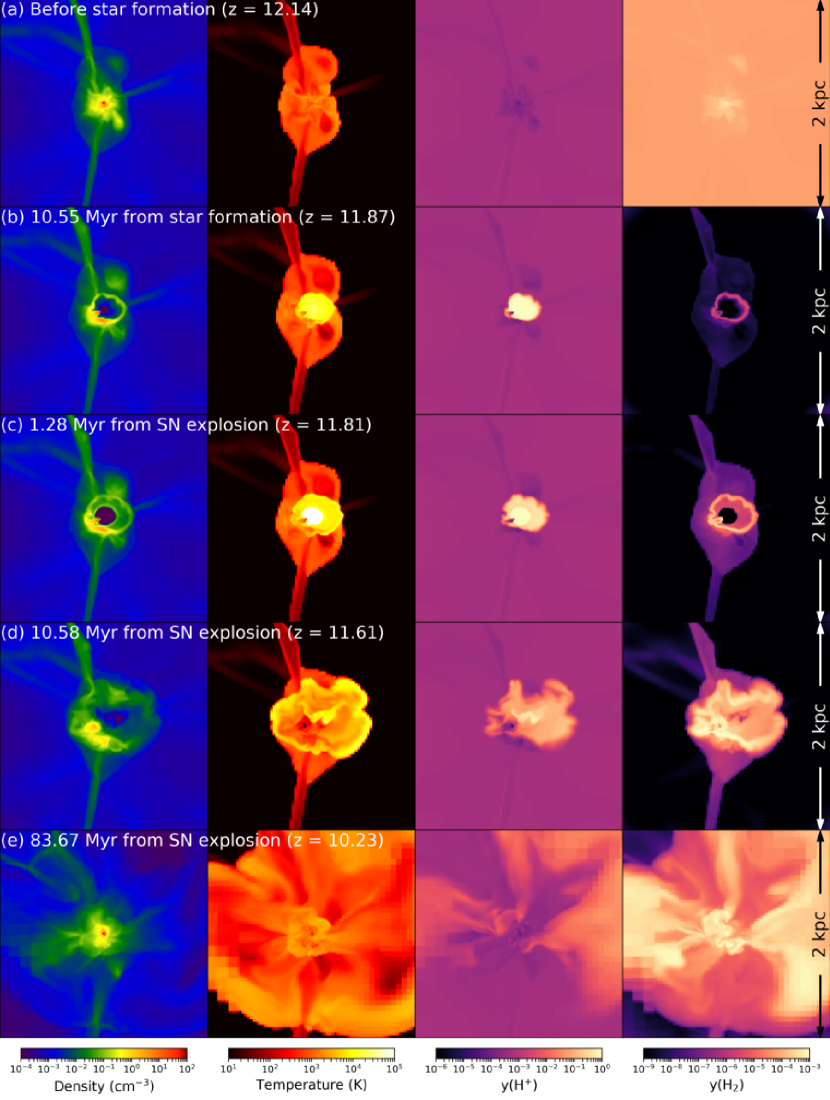
We follow the entire formation sequence from Pop III star formation to the near birth of a second-generation star in a cosmological context. Fig. 4 shows the slice of density, temperature, H+, and H2 fractions at four characteristic epochs. First, a MH with a mass of virializes at the center of the simulation box at redshift , in which the gas begins to collapse through hydrogen molecule cooling, forming a Pop III star with a mass of (Fig. 4a). We follow the evolution of H ii region formed around the Pop III star by solving the radiative transfer equation. During the lifetime of Myr, the ionization and D-type fronts expand to 40 pc, smaller than the virial radius 287 pc of the host MH. This is the condition for an ensuing SN shock to fall back to the host MH (Kitayama & Yoshida, 2005, C18).
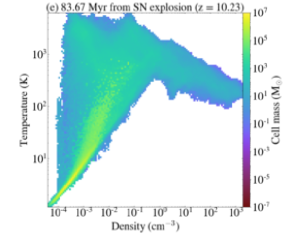
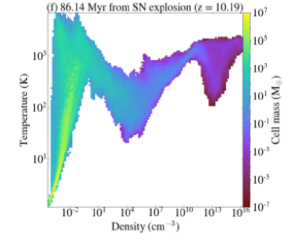
At the time , a SN explosion occurs, and metal and dust are released into the immediate environment (Fig. 4b–d). We add metal and dust to the ejecta with the mass, abundances of each gas-phase element and dust species, and dust size distribution that have been consistently calculated by hydrodynamics evolution of Pop III SN with progenitor mass . About 80 Myr after the SN, the enriched gas falls back into the host MH as predicted, and then begin to recollapse (Fig. 4e). The metallicity of the recollapsing region is , corresponding to , indicating that a EMP star will form there. We calculate all relevant chemical reactions and grain growth to investigate the thermal evolution and fragmentation properties of the low-metallicity collapsing cloud. Finally, a protostellar core forms in the optically thick region. Knotty filamentary structures appear around the protostar, where gas becomes unstable through dust cooling. This indicates that the cloud fragmentation occurs and a low-mass stellar cluster would form if we extended the simulations.
3.1 Pop III star formation and feedback
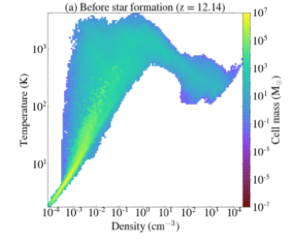
Our zoom-in simulation focuses on a MH with mass and radius pc that virializes at redshift . Fig. 4a shows the slices of density, temperature, the abundances of and just before star formation, while Fig. 5a shows gas temperature as a function of density at that same epoch. The gas accreting into the halo collapses adiabatically until the density reaches . Then radiative cooling by H2 molecules becomes effective, and temperatures drop down to K at a density . Cloud fragmentation does not occur at higher densities due to the lack of coolants, and at these scales, the mass range of the forming stars is determined (Omukai, 2000). The typical mass of the system is the order of the Jeans mass – at this scale (Omukai, 2000). Prior work have shown disk fragmentation in the accretion disk of the subsequently formed protostar and a lower mass range in the eventually formed stellar cluster (Clark et al., 2011; Greif et al., 2011; Stacy et al., 2012). In this MH, a Pop III star particle is created with a mass that was randomly sampled from the assumed IMF (Eq. 1).
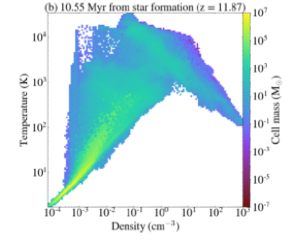
The star emits hydrogen ionizing photons and H2 dissociation photons at the rate of and , respectively during its lifetime of Myr (Schaerer, 2002). Fig. 4b shows the snapshot at 10.6 Myr after the star formation. A clump close to the Pop III star is partially disrupted but remains dense. Also, the gas at the connecting point between the cloud and filament is compressed. Fig. 6 shows one-dimensional profiles of density, temperature, and H+ abundance during the Pop III main sequence from the star toward the clump and filament. A D-type shock front forms and eventually expands to 40 and 100 pc in the directions of the clump and filament, respectively, at . Within it hydrogen is fully ionized, and temperature of the H ii region reaches 20,000 K from the balance between ionization heating and Ly cooling. The large gas pressure causes the central density tone almost uniform with . Fig. 5b shows that a diffuse () and warm ( K) phase appears. The density is smaller than that of previous result (Jeon et al., 2014, C18). The lifetime of Pop III star with in our case is slightly longer than with in Jeon et al. (2014), and D-type front is expanded to larger radius, resulting in more diffuse H ii region. Also, compared with the same progenitor mass model of our previous SPH simulation (C18), the spatial resolution in the central evacuated region around the Pop III star is higher, better capturing the density structures in the H ii region. In C18 the mass resolution was , corresponding to the spatial resolution of 28 pc for while it is 3 pc in this work.
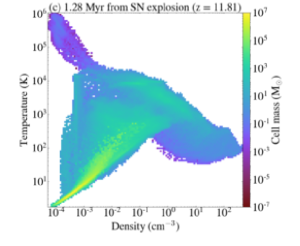
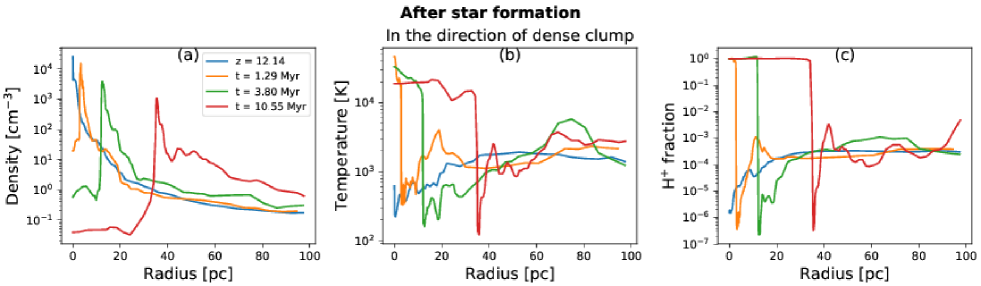
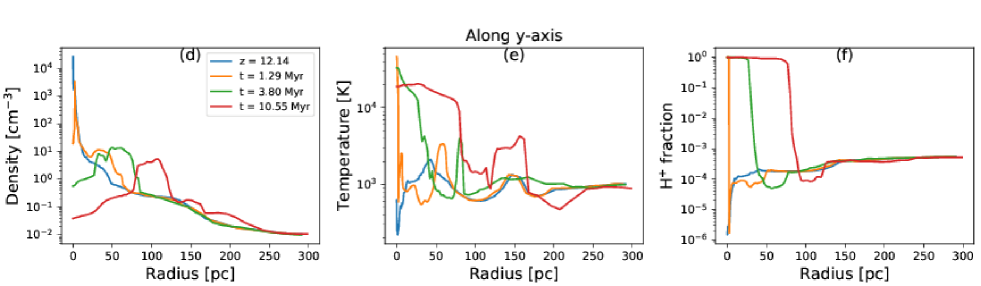
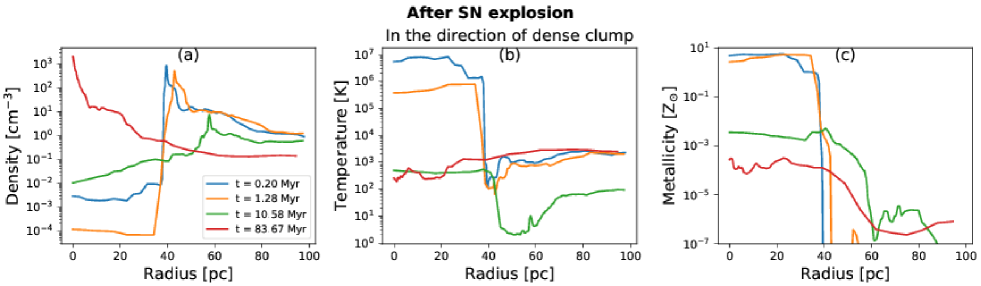
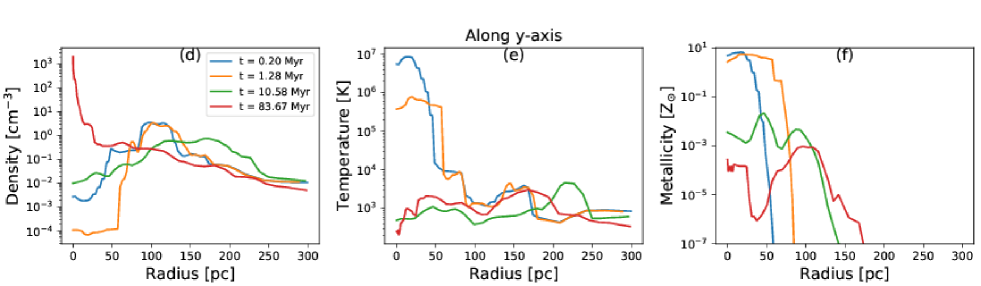
The SN explosion occurs afterwards, and the blastwave propagates through the H ii region. In the direction of the dense clump (Fig. 7a–c), the SN shock interacts with the clump of density that is 40 pc from the Pop III stellar remnant. The clump is partly disrupted and is forced outward from the SN shock pressure (green curve). Its density decreases and the clump eventually falls back into the recollapsing region (red curve). In the direction of filament (Fig. 7d–f), the SN shock merges with the D-type shock just after the transition from the Sedov-Taylor phase to pressure-driven snowplough phase (orange curve). The shell becomes thicker (green curve) and eventually falls back (red curve).
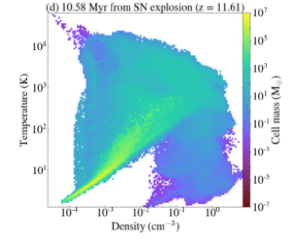
Finally, 80 Myr after explosion, which is approximately the dynamical time of the central MH, the diluted shell begins to fall back into the central MH. The clumps near the Pop III remnant and at the connecting point between the halo and filament form the subsequent star-forming cloud (Fig. 4e) as previous works have found (Ritter et al., 2016; Chiaki et al., 2018). The density of the halo center increases again to at 84 Myr after the Pop III star forms, and a runaway collapse begins (red curve in Fig. 7), which is exactly the scenario of internal enrichment. At that time the dark matter halo mass increases to , 1.69 times larger than at the time of Pop III star formation. Assuming that the turbulent velocity is the order of the circular velocity proportional to , it increases by 1.30 times, which affects the fragmentation properties of the enriched cloud as well as SN driven shocks.
3.2 Metal-poor star formation
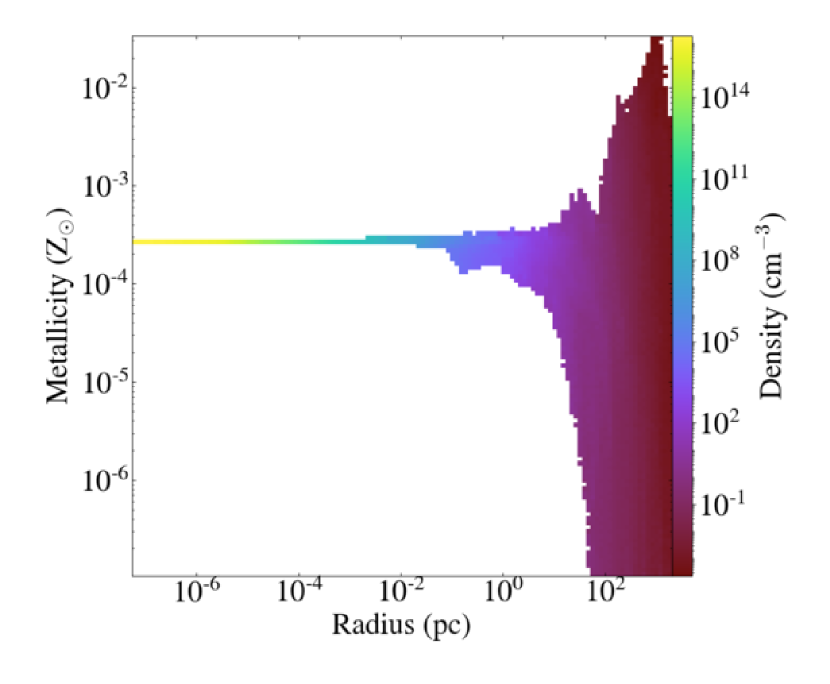
The metallicity in the recollapsing region is , corresponding to iron abundance of , indicating that EMP stars will form in the cloud. The abundances of the other elements are determined according to the elemental abundance ratio shown in Fig. 1. In our previous study (C18), we terminated simulation when the maximum density of the recollapsing region becomes to measure its metallicity range. In this work, we follow the subsequent chemical and thermal evolution to study the fragmentation properties of the cloud until the maximum density reaches , when the primordial component of gas becomes optically thick. Fig. 8 shows the metallicity distribution as a function of the distance from the peak of the recollapsing cloud. While there are both regions with large metallicity up to and with pristine gas in the adjacent cosmological voids (radius pc and density ), the metallicity is uniform within pc because only the inner part of fluid (Smith et al., 2015), whose metallicity fluctuations are progressively reduced, experiences a run-away collapse (Larson, 1969; Penston, 1969) faster than the metal mixing timescales.
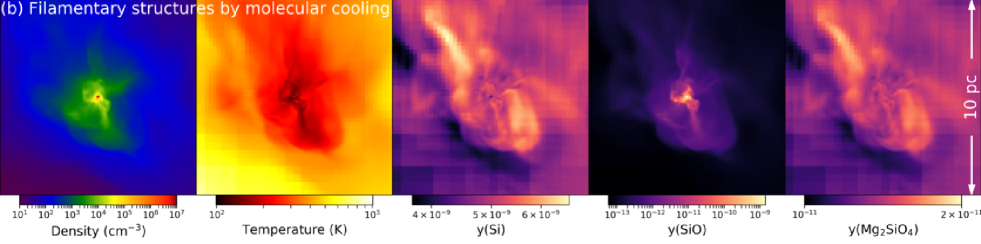
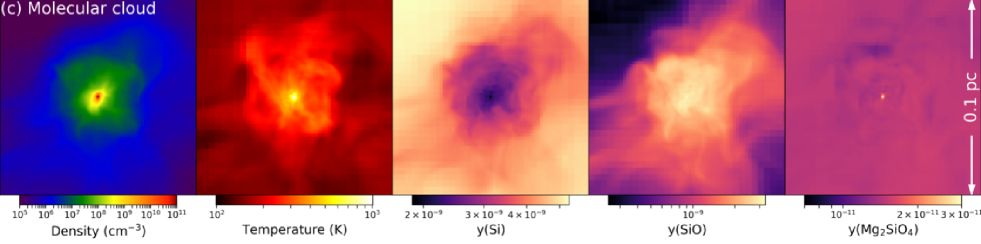
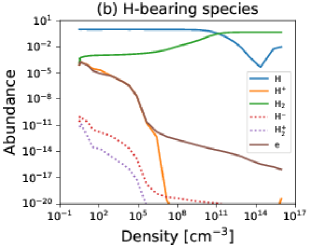
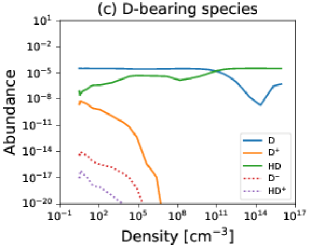
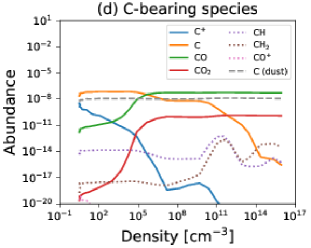
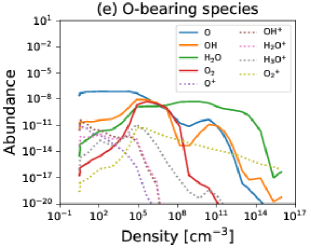
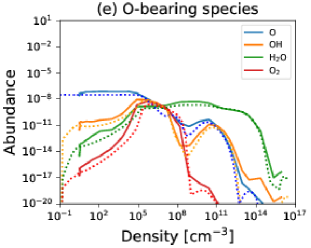
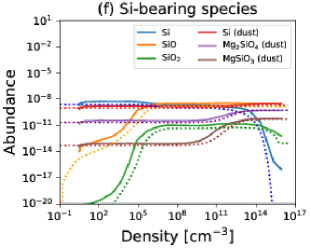
In Fig. 9, we show a sequence of zoom-in images focused on the recollapsing cloud. Because of the adaptive nature of our simulation, we can resolve the cosmological volume with a side of kpc (physical scale at redshift ) down to 0.010 au, corresponding to 33 levels of refinement. Fig. 10 shows the evolution of temperature and chemical abundances as a function of the central density. Our detailed chemical network allows us to calculate the reactions including formation of metal molecules such as CO, OH, and H2O and growth of each grain species such as silicates for the first time. The corresponding radiative cooling and chemical heating processes determine the evolution of temperature, which affects the fragmentation properties of the gas cloud.
We here briefly summarize the chemo-thermal evolution of the recollapsing cloud step-by-step. At densities less than , hydrogen molecules are formed via the H- process:
| (2) | |||||
| (3) |
catalyzed by free electrons. In gas with a metallicity of , H2 formation on grain surfaces is marginally dominant. The H2 fraction is that is slightly higher than in the primordial gas (Fig. 10b). Their ro-vibrational cooling is dominant at that stage, and temperature declines to 150 K. At this low temperature, HD molecules form through the reactions
| (4) | |||||
| (5) |
(Fig. 10c). At , due to HD cooling, temperature further drops down to 70 K. This is shown as the green-yellow region in the density map of Fig. 9b, where filamentary structures start to form. Along the filaments, the temperature reaches a minimum value K, suggesting that HD cooling induces the deformation of the gas cloud.
At this metallicity, metal fine-structure cooling is sub-dominant. However, the transition discriminant introduced by Frebel & Norris (2013) in our simulation, above the critical value of where fine-structure cooling is efficient. We find that O atoms are converted into OH molecules primarily through the reaction
| (6) |
at (Fig. 10e). At the same time, C atoms are oxidized into CO molecules by
| (7) |
(Fig. 10d). At , OH and CO molecules are the dominant coolants instead of C and O atoms, and temperature remains around 100 K.
Because adiabatic compressional heating overcomes these cooling processes, the gas slowly heats up. The cloud becomes stable against deformation, and thus forms a hydrostatic spherical core as shown by the red-colored region in density plot of Fig. 9b. Here a molecular cloud forms with a size of pc, which is depicted in Fig. 9c as the region where SiO molecules are abundant at a fraction . Si atoms are oxidized into SiO by the impact of OH and O2 molecules (Fig. 10f). At densities , gas heating along with H2 formation through the three-body reactions
| (8) | |||||
| (9) |
become efficient, and deformation of the molecular cloud is further suppressed.
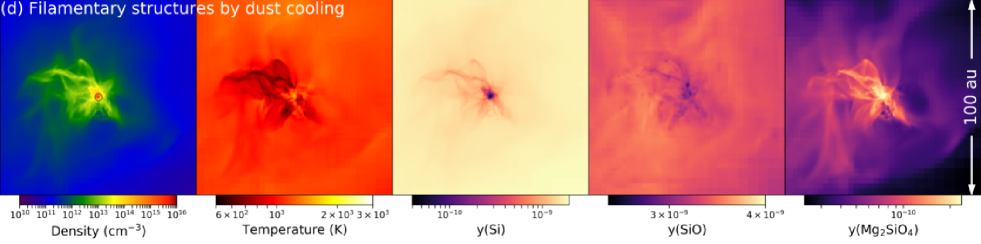
Finally, at , grain growth occurs. Fig. 10f shows that forsterite (red dotted curve) and enstatite (purple dotted curve) grows by accreting gas-phase Mg, SiO, and H2O. Fig. 10e shows that H2O molecules are totally depleted by grain growth because the abundance of available H2O molecules are less () than that of Mg or SiO (, ) just before grain growth. Since oxygen is less abundant than carbon in the assumed progenitor model (), most of oxygen has been depleted into CO molecules at before the onset of H2O molecule formation (). In Fig. 9d, we can see that the forsterite () abundance is enhanced while SiO molecules are slightly depleted along the dense filaments (). A fraction of silicon has remained in its atomic form avoiding oxidization, but Si atoms are eventually depleted into metallic silicon grains. Fig. 9d shows the absence of Si atoms in the very center of the cloud ().
The phase plot (Fig. 10a) shows that dust cooling operates at densities , and the cloud again becomes unstable to deformation. Fig. 9d shows that filamentary structures (yellow region in density map) appears along the cool region (black region in temperature map) with length of a few 10 au. At density , dust cooling become ineffective at which point dust and gas are thermally coupled and the gas becomes optically thick through the dust opacity. The gas evolves adiabatically, forming a hydrostatic core (red region in Fig 9d), the so-called first core (Larson, 1969; Penston, 1969). Hereafter, we call it a “protostar”.444Strictly speaking, a protostar forms at a later stage. At , cooling by H2 dissociation will make the equation of state softer, after which a second collapse occurs. After H2 molecules are fully dissociated, the gas again collapses adiabatically. The hydrostatic core embedded in the first core is called a protostar. Here we define the radius of the protostar to be where the thermal energy balances the gravitational energy. The mass and radius of the protostar are and 1.8 au, respectively. These are consistent with the Jeans mass at density and temperature 500 K, where gas becomes optically thick due to absorption of continuum photons by dust grains. The black circle in the density map of Fig. 9d denotes the radius of the protostar. This result suggests that dust cooling induces the formation of the low-mass star.
We should note that the stellar mass is eventually determined when the accretion onto the protostar halts. Also, we do not see any fragmentation that would be the precursor of further low-mass star formation. It is still possible that the filaments around the protostar will fragment into low-mass protostars. Several knotty structures appears along the filaments, and these are expected to be separately self-gravitating. Because of computational limitations, we can only follow the initial dynamics of the primal protostar. Since the dynamical time is proportional to , the necessary numerical timestep to follow the stable and accurate evolution of the dense () primary protostar is too short to fully follow the accretion history of the less-dense () filaments. There are other approaches to extend the physical time for the simulation. In the sink-particle method, dense regions that determine the computational time are artificially masked. The gas within a given radius around a density peak is accreted onto an artificial particle mimicking a star (Stacy et al., 2012; Safranek-Shrader et al., 2014). Another technique introduces a stiff equation of state to halt the further gas accretion into protostars (C16; Hirano & Bromm, 2017). We will extend our simulation with one of these methods to follow the evolution of filamentary structures induced by dust cooling to determine their fragmentation properties and final stellar masses in a future work.
4 Discussion
4.1 Effect of turbulence induced by SN shock
In our previous work (C16), we followed the chemo-thermal evolution of collapsing clouds from Pop III star-forming MHs with in the case of uniform metal distribution. The conclusion was that the cloud fragmentation induced by dust cooling halted in most cases because of preceding H2 formation heating, which generally occurs in low-metallicity clouds with –. We did not include any SN shock-driven turbulence. Dopcke et al. (2013) and Safranek-Shrader et al. (2016) found that shocks added manually and driven by a halo merger, respectively, drive density perturbations in the collapsing clouds. These perturbations can become the seeds of fragments in the filamentary structures induced by dust cooling.
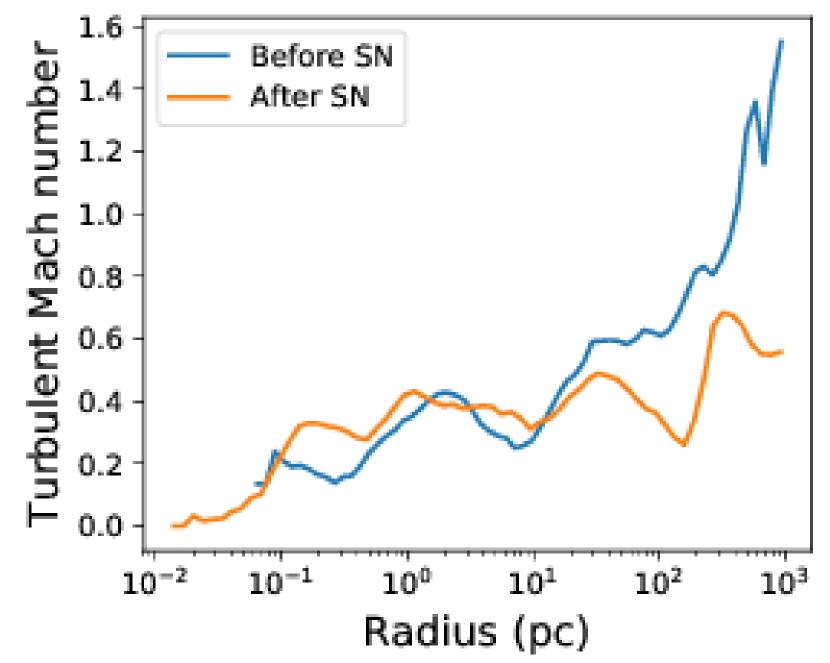
In this work, we explicitly include the SN explosion and follow the subsequent shock. Fig. 11 shows the turbulent Mach number as a function of distance from the density peak for the Pop III star-forming cloud and the recollapsing cloud, where is velocity dispersion and is sound speed. The velocity dispersion is enhanced by gas accretion onto the halo and by the SN-driven shock by a factor of at most two within 10 pc from the density peak. We measure the energy fraction of turbulence to the total energy in this region as as and , respectively, where and are mass weighted average of velocity magnitude and sound speed in the core region with a radius of 10 pc. The fraction increases in the latter by a factor of three. As a result, multiple filamentary structures appear in our simulation with SN shock-driven turbulence (Fig. 9) while only a single filament is seen in our previous work (Fig. 5 in C16, ).
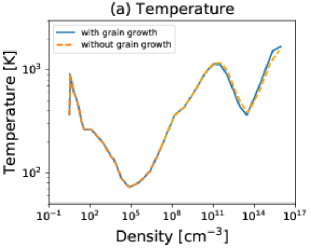
4.2 Effect of grain growth
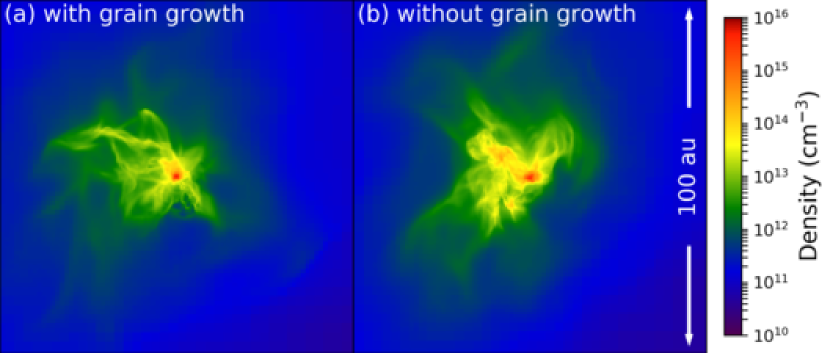
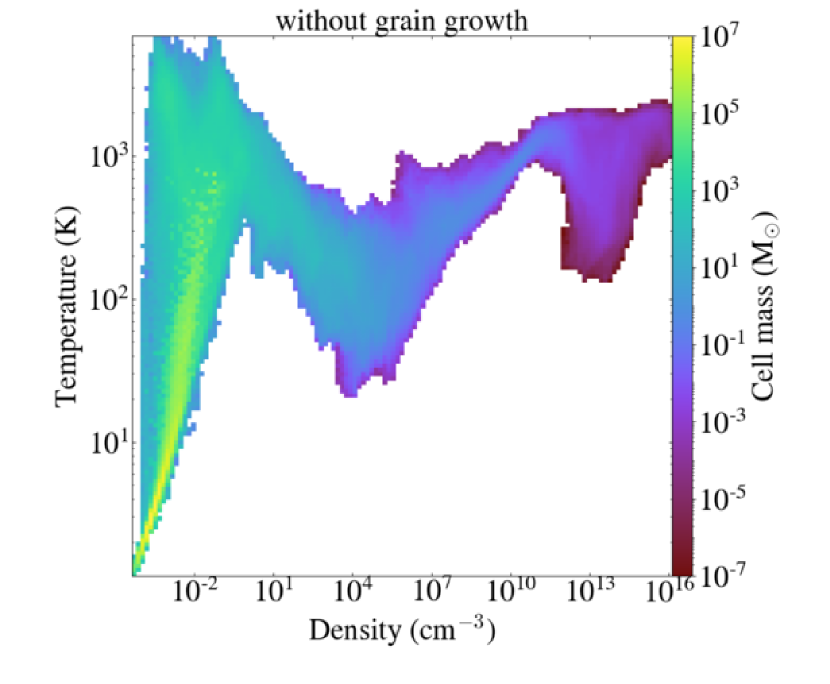
To study how grain growth affects the thermal evolution of metal-poor collapsing clouds, we here also run a reference simulation without grain growth and overplot the thermal evolution of the run in Fig. 10a with the orange dashed curve. We find that the depth of the “trough” of temperature at densities –, where dust cooling operates, is not so enhanced by grain growth. Fig. 12 shows the snapshots of the central 100 au region in the runs with and without grain growth. These show the similar filamentary structures, and fragmentation notably appears even in the latter case opposite to our expectation. Fig. 13 shows the two-dimensional histogram of the density and temperature in the run without grain growth when the maximum of gas density reaches . We find that no significant difference is seen compared with Fig. 5f for the run with grain growth. The difference of the fragmentation properties could stem from the minute differences in the chemo-thermal evolution during the collapse, altering its timing and filamentary structures.
In the simulation with a metal and dust model with a progenitor mass , the growth of silicates, which are the major species for gas cooling, is suppressed because oxygen has been depleted into CO molecules at . If , a fraction of oxygen is reduced into H2O molecules, which are accreted onto silicates without being depleted into CO molecules. This scenario occurs for progenitor masses of as we show that silicates grow sufficiently to affect the thermal evolution in C16.
4.3 Simplified enrichment model
We can further understand the chemical enrichment through a simplified model from a single event. The recollapsing cloud in the simulation has a metallicity of . We define the cloud as a sphere with a mass of the Jeans mass at a density of and temperature of 100 K that has been uniformly enriched in the simulation within a radius of pc (see Fig. 8). We can estimate the average metallicity of the cloud by assuming that all of the ejecta metal mass is reincorporated into the cloud, giving a metallicity
| (10) |
However, in reality, most of the metal escapes from the halo along with the shocked gas into the adjacent voids. The rest recollapses into the cloud, being blocked by the cosmic filaments and a neighboring gas clump.
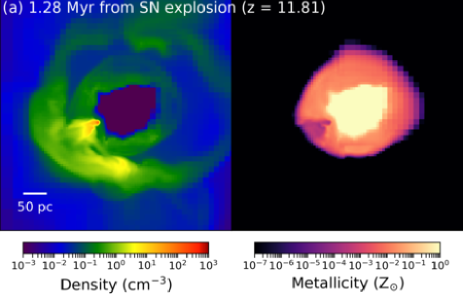
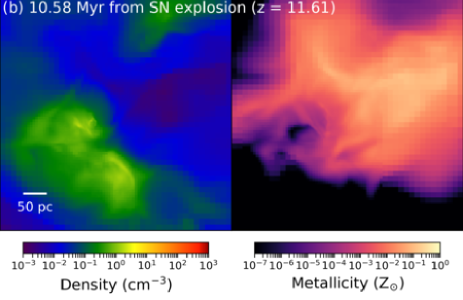
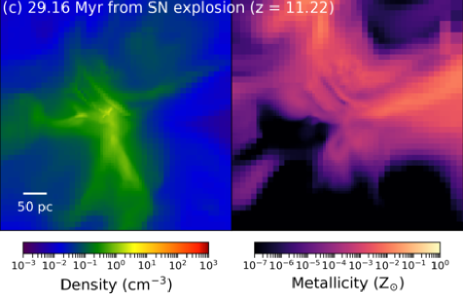
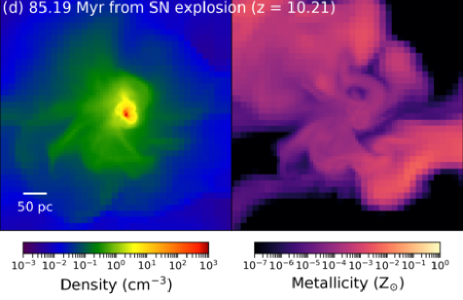
Fig. 14 shows the process of metal dispersion along with the SN shock propagation and fall-back into the central MH. At 1.3 Myr after explosion (panel a), the SN shock with radius 40 pc is still inside the D-type shock with radius 100 pc, and begins to interact with the neighboring clump. The initial enriched gas does not mix with the interior gas at regions with densities (yellow-orange colored region) and passes around the clump. The partially destroyed clump and two connecting regions between the MH and cosmic filaments remains dense, and the SN shock stalls out at 10.6 Myr after the SN (panel b). The shock does not escape the halo’s gravitational potential well, and these three regions accrete back into the MH (panel c). The metals are then incorporated into the recollapsing cloud and mixed by the turbulence driven by the SN and virialization (panel d).
With this picture, we can estimate a fraction of metals which fall-back as Ritter et al. (2015) did. The fraction of metals that is blocked by the clump is the ratio of solid angles of neighboring clumps with radius at a distance from the SN is . The radius of the region with densities is pc and the distance is pc (Fig. 14b). There are of clumps that interrupt the propagation of metals. We can thus estimate the metallicity in the recollapsing region as
| (11) |
which is consistent with our simulation result.
4.4 Minihalo and Pop III star mass
In this work, we investigate the metal enrichment in the case of a particular scenario: an initial MH mass and Pop III stellar mass . The subsequent dynamics and metal enrichment heavily depend on these two characteristic properties, where the ratio of the halo binding energy and the radiation/explosion energies is the key quantity. However, we can categorize this spectrum of initial parameters and associated outcomes into two scenarios: internal enrichment and external enrichment. In our previous work (C18), we found that the external enrichment occurs when ionizing region expands beyond the halo virial radius with MH masses below the critical mass:
| (12) | |||||
In this case, because the SN shell expands through the low-density region (), it does not sufficiently lose thermal energy due to the low cooling rate (proportional to density squared) and continues to expand.
In the simulated mass range of (Hirano et al., 2014), the main enrichment process is internal enrichment for core-collapse SNe (). In the most energetic case, metals can escape from the host MH and external enrichment occurs for pair-instability supernovae (–; Heger & Woosley, 2002). Therefore, to fully investigate the metal distribution function in the Universe, it is required to follow the metal dispersion from a multitude of host halos and Pop III stars with a wider sampling of their initial masses and thus stellar endpoints. However by focusing on individual cases, we can further understand the detailed dynamics and mixing during the transition from Pop III to metal-enriched star formation.
4.5 Isolation of minihaloes
Our simulation focuses on an isolated MH in a cosmological setting. Particularly in large-scale overdense regions, MHs can be clustered enough so that their SN remnants will overlap. The mixing of nucleosynthetic products from multiple events will partially wash out any unique feature from each explosion (de Bennassuti et al., 2014, 2017; Hartwig et al., 2018).
It has been shown that metal-free stars generally form in halos of mass (Bromm, 2013). For a large-scale region with a typical overdensity, such as the one that eventually forms the Milky Way, the average MH separation can be calculated with (elliposidal) Press-Schetcher formalism (Press & Schechter, 1974; Sheth et al., 2001) to be comoving kpc at redshift . This is comparable with the simulation side length (300 comoving kpc), justifying our choice of considering a single enrichment event. We should note that, however, some fraction of MHs will be clustered in the Milky Way progenitor environment. In such regions, EMP stars should be enriched by multiple progenitors. This suggests that EMP stars, especially for C-normal ones, are not the only second-generation stars which we investigate in this work. To capture the statistical feature of first stars and EMP stars, simulations in a larger cosmological volume are required with a special focus on progenitors of Milky Way like galaxies (Tumlinson, 2007; Salvadori et al., 2007; Sarmento et al., 2017).
4.6 Shell instability
When the SN shock interacts with the D-type shock, there is a possibility that the shell becomes sufficiently thick to become unstable against fragmentation. In the dense clump neighboring the SN, its density is when the shocks interact (Fig. 7a). However, the clump is partly desrupted by the pressure of SN shock before it collapses. Also, in the direction of cosmic filament (Fig. 7d), the gas falling into the MH collide with the SN shock, forming a dense shell. The intability criterion of an expanding shell with velocity at distance from the SN can be written as
| (13) |
where , are the surface density and effective sound speed of the shell (see Chiaki et al., 2013). For the dense shell with km/s, pc, , and km/s, the left and right hand sides are and , respectively, showing that the shell is also marginally stable.
5 Comparison with observed EMP stars
Recent observational campaigns have covered a large sample of EMP stars (Yoon et al., 2018; Placco et al., 2018). Although we restrict our focus on a single metal-poor star-forming cloud enriched by a single Pop III SN, this study gives a general insight for the chemo-thermal evolution of metal-poor clouds and their prior enrichment. We expect that the chemical/thermal processes such as metal molecular cooling, H2 formation heating, and dust thermal emission cooling as well as grain growth will be commonly crucial for cloud formation and collapse because the thermal evolution of those clouds is nearly insensitive to their initial conditions (see discussion around Fig. 2 in Omukai, 2000). Although our study shows that cloud fragmentation is hardly seen until we terminate the simulation, it is possible that knotty filamentary structure will fragment in later phases. However, these filaments can still accrete onto the central initial protostar, and if this accretion flow remains intact until the protostellar radiation starts to sweep up the ambient gas, low-mass EMP star formation will be suppressed (Hosokawa et al., 2011). The simple chemical evolution model of Hartwick (1976) suggests that the metallicity distribution of stars is proportional to , while observations have shown that the number of stars deviates below this prediction (Frebel & Norris, 2013), which is consistent with our results in that low-mass EMP stars are rarely formed.
Our study, where we follow the advection of each element and chemical reactions, can also be applied to the explanation of the existence of different classifications among EMP stars. Observations have revealed that EMP stars are classified into two major groups, C-normal and C-enhanced populations (Beers & Christlieb, 2005). The vast majority of EMP stars with have carbon enhancement (Placco et al., 2018; Yoon et al., 2018). Although we here restrict our focus on the C-normal EMP stars, the evolution of C-enhanced EMP star-forming clouds is also followed with progenitor models consistent with their elemental abundance ratio such as faint SN (Umeda & Nomoto, 2003; Marassi et al., 2014, 2015; Chiaki et al., 2017).
Lastly, we restrict our focus to a single EMP star-forming cloud enriched by a single Pop III SN. To study the nucleosynthesis and mass distribution of Pop III stars and the first metal enrichment process indirectly from the metallicity and elemental abundance ratios of EMP stars, it is preferable to isolate stars that are enriched by a single event (Ishigaki et al., 2018; Hartwig et al., 2018). However, some EMP stars could be enriched by multiple progenitors (de Bennassuti et al., 2014, 2017; Hartwig et al., 2018). In our simulation, the recovery time during which the ejected gas returns to the MH and ensuing star formation occurs is Myr. In the case where other explosions in neighboring halos occur during this delay time, the stars could be enriched by multiple progenitors, and the metallicity and elemental abundances will be some combination of the progenitors’ explosion characteristics. Furthermore, a single halo might host multiple Pop III stars caused by fragmentation (Turk et al., 2009; Clark et al., 2011; Greif et al., 2011; Stacy et al., 2012; Susa et al., 2014). To statistically compare with the large observational sample of EMP stars, we plan to extend our simulation temporally and spatially to follow the effects of multiple Pop III stars and formation of a population of EMP stars in future work.
6 Summary and conclusion
We follow the entire formation sequence of an EMP star in a cosmological context. In this simulation, we for the first time solve all relevant chemical reactions and grain growth in a low-metallicity molecular cloud, considering nucleosynthesis and nucleation models of Pop III SN in a consistent manner. In the targeted minihalo, metal-free gas contracts through hydrogen molecule cooling, where a Pop III star forms with a mass . We compute the radiation hydrodynamics of the system and follow the formation of an ionized region around the Pop III star. At the end of its lifetime, the ionization and D-type shock fronts reaches a radius of 40 pc, still contained within the MH that has a virial radius of 287 pc. This containment is one of the conditions for the self-enrichment of host MHs (C18). This Pop III star explodes as a normal core-collapse SN with explosion energy erg. In the ejecta, we uniformly add metal and dust models calculated for a Pop III SN with mass . The ejected gas falls back into the central MH 80 Myr after the SN explosion. In the recollapsing cloud, the metallicity is nearly uniform within 1 pc. We follow the further evolution of recollapsing cloud until the first protostellar core forms, at which time the spatial resolution reaches a value of 0.01 au, sufficient to resolve the protostellar core. We finally find that gas around the protostar deforms to multiple knotty filamentary structures by dust thermal emission cooling. Although we do not follow the further evolution of these filaments due to the computational limits, the filaments will fragment into a multiple protostellar system.
We show that a single SN event can reproduce a collapsing cloud with a metallicity in a range of observed EMP stars through the internal enrichment process. The mass of the primary protostar is when we terminate the simulation. The protostar will continue to accrete the ambient gas, and the stellar mass will ultimately be determined when accretion is halted. If this mass is less than , it will survive until the present-day. If such an object formed in the Milky Way progenitor halos, it would be observed as an EMP star in the Galactic halo or neighboring dwarf galaxies. This work is the very first step to seek the chemical enrichment and star formation in the early universe. By applying our strategy and results to larger simulations both in time and volume, we will continue to clarify their entire formation sequence and connection to EMPs in the local universe, strengthening the insights gained from near-field cosmology.
ACKNOWLEDGMENTS
We thank the anonymous referee for their constructive comments, improving our paper. We also thank T. Nozawa, who kindly give us the SN models, and V. Bromm and T. Hartwig for fruitful discussions. We also thank B. Smith, who helped us with the yt clump finding method. GC is supported by Research Fellowships of the Japan Society for the Promotion of Science (JSPS) for Young Scientists. JHW acknowledges support from NSF grants AST-1614333 and OAC-1835213, Hubble Theory grant HST-AR-14326, and NASA grant NNX-17AG23G. The numerical simulations in this work are carried out on PACE cluster in the Georgia Institute of Technology. The freely available plotting library matplotlib (Hunter, 2007) was used to construct numerous plots within this paper. Computations and analysis described in this work were performed using the publicly-available Enzo and yt codes, which is the product of a collaborative effort of many independent scientists from numerous institutions around the world.
Appendix A Dust cooling rates with grain growth
Dust grains have an effect on the chemo-thermal evolution of collapsing clouds, depending on the density , gas temperature , density of a grain species , and of a key element . To reduce the computational cost, we have calculated the following quantities:
-
(1)
H2 formation rate on grain surfaces from Eq. (4) of C15
-
(2)
dust opacity from Eq. (8) of C15
-
(3)
dust cooling rate from Eq. (7) of C15
-
(4)
grain growth rate (see below)
for each species , and tabulated them.
As a result of grain growth, these rates are enhanced. If the growth rate depends on the grain radius, it would be almost impossible to tabulate these rates for each grain species because the size distribution is deformed over the course of time. We pay attention to the convenient nature of grain growth in that the size increment is independent of the grain radius. Although the rate at which a gas-phase species sticks to grain surfaces is proportional to , it is converted to the increasing rate of grain radius with divided by a grain surface area () for the impactor to cover the entire area of a grain surface. Because the size distribution function is just shifted to larger radii without changing its shape, we can estimate the rates from the initial size distribution and dust amount at a given time.
In C15, the rates (1)–(4) are formulated with the size increment for a grain species at the time .555The origin of time should be the time at which grain size distribution is fixed. Here we set it the time of SN explosion. Note that it takes yr that dust size distribution is fixed (Nozawa et al., 2007). When we create the lookup table, we convert the given fluid quantities into in the following manner. In the relevant density and temperature range, metals are accreted onto pre-existing seed grains, i.e., seeds are not newly formed. Therefore, the ratio of number density of grain particles666In Eq. (14), is the bulk density of grain species . is the average of a physical quantity weighted by the size distribution function normalized as .
| (14) |
to that of nuclei of the key element is constant:
| (15) |
Since is independent on grain radii, is expanded as
using the moments of the grain radii () weighted by the initial size distribution function . Then, is derived as the root of the cubic equation (LABEL:eq:size_increment).
We should note that is independent of unless grain sublimation is considered. In our chemistry model, we ignore it because grains sublimate only after the gas becomes opaque in the continuum (Omukai, 2000). Also, grain collisional cross-sections with gas-phase species depend on when grains interact with ions and electrons (Draine & Sutin, 1987).
Next, we describe how to estimate grain growth rate. It is treated as a set of chemical reactions. The grain growth rate is written as
| (17) |
where and are the thermal velocity and number density of a reactant bearing the corresponding element , respectively. For species with multiple reactants (e.g., Mg, SiO, and H2O for forsterite), we take the minimum rate among them (Kozasa & Hasegawa, 1987). Then, the growth rate of number density of nuclei of the key element locked up into grain species and the depletion rate of number density of gas-phase species are
| (18) |
The number density is converted into the mass density of grain species as
| (19) |
where is the molecular weight of a monomer of .
Appendix B Comparison of chemistry with one-zone calculation
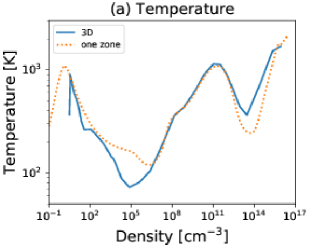
We compare our simulation results with a semi-analytic one-zone collapse calculation, in which the thermal evolution of a collapse center is followed with the same chemical reaction network and radiative cooling as the simulation (see also Omukai, 2000). The density is assumed to increase at the rate of nearly a free-fall time :
| (20) |
In this equation, is the collapse timescale as
| (21) |
where is the ratio of gas thermal energy to gravitational energy as
| (22) |
is the specific heat ratio of the gas with density and pressure (Larson, 1969; Omukai et al., 2005). Then, specific energy is calculated as
| (23) |
where and is the gain and lost of the energy, respectively.
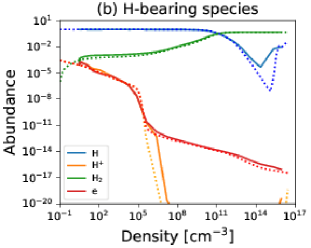
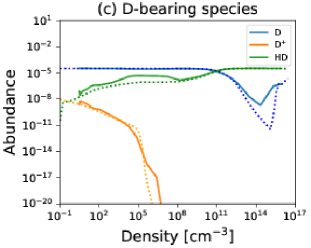
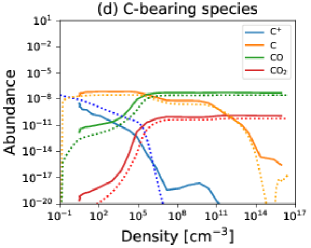
Fig. 15 shows the evolution of temperature and chemical abundances with a metallicity , the same as the recollapsing region in our simulation. We find that our three-dimensional results match very well with the one-zone model. However, there is the discrepancy at densities and . This difference occurs because the one-zone calculation does not include any hydrodynamic effects. In our simulation, the collapse timescale is longer than the one in Eq. (21). At , the collapse time is slower than in Eq. (21) because of the gravitational potential of the dark matter MH whose distribution is more spread than gas (see also C16, ). Since the adiabatic compressional heating rate is smaller and thus the chemical timescale for H2 formation is relatively longer, the gas temperature is lower than the one-zone calculation. Also, when temperature decreases below 150 K, HD molecule formation is enhanced, and the gas further cools down to 70 K. Conversely, at , the temperature in our simulation is higher than one in the one-zone calculation. The collapse timescale is shorter than the one in the one-zone calculation (Eq. (21)) because of the rapid gas accretion into the hydrostatic core formed by H2 formation heating (see Sec. 3.2).
References
- Abel et al. (2002) Abel, T., Bryan, G. L., & Norman, M. L. 2002, Science, 295, 93
- Anninos et al. (1997) Anninos, P., Zhang, Y., Abel, T., & Norman, M. L. 1997, New Astron., 2, 209
- Asplund et al. (2009) Asplund, M., Grevesse, N., Sauval, A. J., & Scott, P. 2009, ARA&A, 47, 481
- Barrow et al. (2017) Barrow, K. S. S., Wise, J. H., Norman, M. L., O’Shea, B. W., & Xu, H. 2017, MNRAS, 469, 4863
- Barrow et al. (2018) Barrow, K. S. S., Wise, J. H., Aykutalp, A., et al. 2018, MNRAS, 474, 2617
- Beers & Christlieb (2005) Beers, T. C., & Christlieb, N. 2005, ARA&A, 43, 531
- Bianchi & Schneider (2007) Bianchi, S., & Schneider, R. 2007, MNRAS, 378, 973
- Bovino et al. (2016) Bovino, S., Grassi, T., Schleicher, D. R. G., & Banerjee, R. 2016, ApJ, 832, 154
- Bromm & Loeb (2003) Bromm, V., & Loeb, A. 2003, Nat, 425, 812
- Bromm (2013) Bromm, V. 2013, Reports on Progress in Physics, 76, 112901
- Bromm (2014) Bromm, V. 2014, Science, 345, 868
- Bryan et al. (2014) Bryan, G. L., Norman, M. L., O’Shea, B. W., et al. 2014, ApJS, 211, 19
- Cayrel et al. (2004) Cayrel, R., Depagne, E., Spite, M., et al. 2004, A&A, 416, 1117
- Clark et al. (2011) Clark, P. C., Glover, S. C. O., Smith, R. J., et al. 2011, Science, 331, 1040
- Chen et al. (2017) Chen, K.-J., Heger, A., Whalen, D. J., et al. 2017, MNRAS, 467, 4731 111
- Chiaki et al. (2013) Chiaki, G., Yoshida, N., & Kitayama, T. 2013, ApJ, 762, 50
- Chiaki et al. (2015) Chiaki, G., Marassi, S., Nozawa, T., et al. 2015, MNRAS, 446, 2659
- Chiaki et al. (2016) Chiaki, G., Yoshida, N., & Hirano, S. 2016, MNRAS, 463, 2781
- Chiaki et al. (2017) Chiaki, G., Tominaga, N., & Nozawa, T. 2017, MNRAS, 472, L115
- Chiaki et al. (2018) Chiaki, G., Susa, H., & Hirano, S. 2018, MNRAS, 475, 4378
- Dayal & Ferrara (2018) Dayal, P., & Ferrara, A. 2018, arXiv:1809.09136
- Dayal et al. (2018) Dayal, P., Rossi, E. M., Shiralilou, B., et al. 2018, arXiv:1810.11033
- de Bennassuti et al. (2014) de Bennassuti, M., Schneider, R., Valiante, R., & Salvadori, S. 2014, MNRAS, 445, 3039
- de Bennassuti et al. (2017) de Bennassuti, M., Salvadori, S., Schneider, R., Valiante, R., & Omukai, K. 2017, MNRAS, 465, 926
- Dopcke et al. (2011) Dopcke, G., Glover, S. C. O., Clark, P. C., & Klessen, R. S. 2011, ApJ, 729, L3
- Dopcke et al. (2013) Dopcke, G., Glover, S. C. O., Clark, P. C., & Klessen, R. S. 2013, ApJ, 766, 103
- Draine & Sutin (1987) Draine, B. T., & Sutin, B. 1987, ApJ, 320, 803
- Frebel & Norris (2013) Frebel, A., & Norris, J. E. 2013, Planets, Stars and Stellar Systems. Volume 5: Galactic Structure and Stellar Populations, 55
- Galli & Palla (2013) Galli, D., & Palla, F. 2013, ARA&A, 51, 163
- Grassi et al. (2017) Grassi, T., Bovino, S., Haugbølle, T., & Schleicher, D. R. G. 2017, MNRAS, 466, 1259
- Greif et al. (2011) Greif, T. H., Springel, V., White, S. D. M., et al. 2011, ApJ, 737, 75
- Hartwig et al. (2018) Hartwig, T., Yoshida, N., Magg, M., et al. 2018, MNRAS, 478, 1795
- Hahn & Abel (2011) Hahn, O., & Abel, T. 2011, MNRAS, 415, 2101
- Hartwick (1976) Hartwick, F. D. A. 1976, ApJ, 209, 418
- Heger & Woosley (2002) Heger, A., & Woosley, S. E. 2002, ApJ, 567, 532
- Hirano et al. (2014) Hirano, S., Hosokawa, T., Yoshida, N., et al. 2014, ApJ, 781, 60
- Hirano & Bromm (2017) Hirano, S., & Bromm, V. 2017, MNRAS, 470, 898
- Hosokawa et al. (2011) Hosokawa, T., Omukai, K., Yoshida, N., & Yorke, H. W. 2011, Science, 334, 1250
- Hopkins (2013) Hopkins, P. F. 2013, MNRAS, 428, 2840
- Hunter (2007) Hunter J. D., 2007, CSE, 9, 90
- Ishigaki et al. (2018) Ishigaki, M. N., Tominaga, N., Kobayashi, C., & Nomoto, K. 2018, arXiv:1801.07763
- Jeon et al. (2014) Jeon, M., Pawlik, A. H., Bromm, V., & Milosavljević, M. 2014, MNRAS, 444, 3288
- Kalirai (2018) Kalirai, J. 2018, Contemporary Physics, 59, 251
- Kitayama & Yoshida (2005) Kitayama, T., & Yoshida, N. 2005, ApJ, 630, 675
- Kozasa & Hasegawa (1987) Kozasa, T., & Hasegawa, H. 1987, Progress of Theoretical Physics, 77, 1402
- Larson (1969) Larson, R. B. 1969, MNRAS, 145, 271
- Magg et al. (2017) Magg, M., Hartwig, T., Agarwal, B., et al. 2017, arXiv:1706.07054
- Machida et al. (2005) Machida, M. N., Tomisaka, K., Nakamura, F., & Fujimoto, M. Y. 2005, ApJ, 622, 39
- Marassi et al. (2014) Marassi, S., Chiaki, G., Schneider, R., et al. 2014, ApJ, 794, 100
- Marassi et al. (2015) Marassi, S., Schneider, R., Limongi, M., et al. 2015, MNRAS, 454, 4250
- Mayer & Duschl (2005) Mayer, M., & Duschl, W. J. 2005, MNRAS, 358, 614
- Neufeld & Kaufman (1993) Neufeld, D. A., & Kaufman, M. J. 1993, ApJ, 418, 263
- Neufeld et al. (1995) Neufeld, D. A., Lepp, S., & Melnick, G. J. 1995, ApJS, 100, 132
- Nozawa et al. (2003) Nozawa, T., Kozasa, T., Umeda, H., Maeda, K., & Nomoto, K. 2003, ApJ, 598, 785
- Nozawa et al. (2007) Nozawa, T., Kozasa, T., Habe, A., et al. 2007, ApJ, 666, 955
- Nozawa et al. (2008) Nozawa, T., Kozasa, T., Tominaga, N., et al. 2008, ApJ, 684, 1343
- Omukai (2000) Omukai, K. 2000, ApJ, 534, 809
- Omukai et al. (2005) Omukai, K., Tsuribe, T., Schneider, R., & Ferrara, A. 2005, ApJ, 626, 627
- Omukai et al. (2010) Omukai, K., Hosokawa, T., & Yoshida, N. 2010, ApJ, 722, 1793
- Penston (1969) Penston, M. V. 1969, MNRAS, 144, 425
- Planck Collaboration et al. (2016) Planck Collaboration, Ade, P. A. R., Aghanim, N., et al. 2016, A&A, 594, A13
- Placco et al. (2018) Placco, V. M., Beers, T. C., Santucci, R. M., et al. 2018, AJ, 155, 256
- Pollack et al. (1994) Pollack, J. B., Hollenbach, D., Beckwith, S., et al. 1994, ApJ, 421, 615
- Press & Schechter (1974) Press, W. H., & Schechter, P. 1974, ApJ, 187, 425
- Ritter et al. (2012) Ritter, J. S., Safranek-Shrader, C., Gnat, O., Milosavljević, M., & Bromm, V. 2012, ApJ, 761, 56
- Ritter et al. (2015) Ritter, J. S., Sluder, A., Safranek-Shrader, C., Milosavljević, M., & Bromm, V. 2015, MNRAS, 451, 1190
- Ritter et al. (2016) Ritter, J. S., Safranek-Shrader, C., Milosavljević, M., & Bromm, V. 2016, MNRAS, 463, 3354
- Rosswog (2015) Rosswog, S. 2015, MNRAS, 448, 3628
- Ryan et al. (1996) Ryan, S. G., Norris, J. E., & Beers, T. C. 1996, ApJ, 471, 254
- Safranek-Shrader et al. (2014) Safranek-Shrader, C., Milosavljević, M., & Bromm, V. 2014, MNRAS, 440, L76
- Safranek-Shrader et al. (2016) Safranek-Shrader, C., Montgomery, M. H., Milosavljević, M., & Bromm, V. 2016, MNRAS, 455, 3288
- Saitoh & Makino (2013) Saitoh, T. R., & Makino, J. 2013, ApJ, 768, 44
- Santoro & Shull (2006) Santoro, F., & Shull, J. M. 2006, ApJ, 643, 26
- Salvadori et al. (2007) Salvadori, S., Schneider, R., & Ferrara, A. 2007, MNRAS, 381, 647
- Sarmento et al. (2017) Sarmento, R., Scannapieco, E., & Pan, L. 2017, ApJ, 834, 23
- Schaerer (2002) Schaerer, D. 2002, A&A, 382, 28
- Schneider et al. (2003) Schneider, R., Ferrara, A., Salvaterra, R., Omukai, K., & Bromm, V. 2003, Nature, 422, 869
- Sheth et al. (2001) Sheth, R. K., Mo, H. J., & Tormen, G. 2001, MNRAS, 323, 1
- Sluder et al. (2016) Sluder, A., Ritter, J. S., Safranek-Shrader, C., Milosavljević, M., & Bromm, V. 2016, MNRAS, 456, 1410
- Smith et al. (2008) Smith, B., Sigurdsson, S., & Abel, T. 2008, MNRAS, 385, 1443
- Smith et al. (2015) Smith, B. D., Wise, J. H., O’Shea, B. W., Norman, M. L., & Khochfar, S. 2015, MNRAS, 452, 2822
- Smith et al. (2017) Smith, B. D., Bryan, G. L., Glover, S. C. O., et al. 2017, MNRAS, 466, 2217
- Stacy et al. (2012) Stacy, A., Greif, T. H., & Bromm, V. 2012, MNRAS, 422, 290
- Susa et al. (2014) Susa, H., Hasegawa, K., & Tominaga, N. 2014, ApJ, 792, 32
- Takahashi et al. (1983) Takahashi, T., Silk, J., & Hollenbach, D. J. 1983, ApJ, 275, 145
- Tanaka et al. (2017) Tanaka, S. J., Chiaki, G., Tominaga, N., & Susa, H. 2017, ApJ, 844, 137
- Tumlinson (2007) Tumlinson, J. 2007, ApJ, 664, L63
- Turk et al. (2009) Turk, M. J., Abel, T., & O’Shea, B. 2009, Science, 325, 601
- Turk et al. (2011) Turk M. J., Smith B. D., Oishi J. S., Skory S., Skillman S. W., Abel T., Norman M. L., 2011, ApJS, 192, 9
- Umeda & Nomoto (2002) Umeda, H., & Nomoto, K. 2002, ApJ, 565, 385
- Umeda & Nomoto (2003) Umeda, H., & Nomoto, K. 2003, Nature, 422, 871
- Wise & Abel (2011) Wise, J. H., & Abel, T. 2011, MNRAS, 414, 3458
- Wise et al. (2012) Wise, J. H., Turk, M. J., Norman, M. L., & Abel, T. 2012, ApJ, 745, 50
- Yoon et al. (2018) Yoon, J., Beers, T. C., Dietz, S., et al. 2018, arXiv:1806.04738