Mott metal-insulator transitions in pressurized layered trichalcogenides
Abstract
Transition metal phosphorous trichalcogenides, ( and being transition metal and chalcogen elements respectively), have been the focus of substantial interest recently because they are unusual candidates undergoing Mott transition in the two-dimensional limit. Here we investigate material properties of the compounds with = Mn and Ni employing ab-initio density functional and dynamical mean-field calculations, especially their electronic behavior under external pressure in the paramagnetic phase. Mott metal-insulator transitions (MIT) are found to be a common feature for both compounds, but their lattice structures show drastically different behaviors depending on the relevant orbital degrees of freedom, i.e. or . Under pressure MnPS3 undergoes an isosymmetric structural transition in monoclinic space group by forming Mn-Mn dimers due to the strong direct overlap between the neighboring orbitals, accompanied by a significant volume collapse and a spin-state transition. In contrast, NiPS3 and NiPSe3, with their active orbital degrees of freedom, do not show a structural change at the MIT pressure or deep in the metallic phase within the monoclinic symmetry. Hence NiPS3 and NiPSe3 become rare examples of materials hosting electronic bandwidth-controlled Mott MITs, thus showing promise for ultrafast resistivity switching behavior.
Since the first identification of the Mott metal-insulator transition (MIT) by Mott and Peierls in 1937 Mott and Peierls (1937) and the suggestion of the canonical Hubbard model in 1963 Hubbard (1963), many systems showing the Mott MIT have been found. They can be broadly classified into two categories, a) the filling-controlled MITs, such as in the doped cuprates Bednorz and Müller (1986), or b) the bandwidth-controlled MITs, such as in the rare-earth nickelates NiO3 ( being a rare-earth element) Torrance et al. (1992); Medarde (1997) or vanadium oxides V2O3 Morin (1959); McWhan et al. (1971); Carter et al. (1993) and VO2 Morin (1959); Qazilbash et al. (2007). Considering applications to electronic resistive switching devices, the filling-controlled MIT of type (a) is not favorable due to the inevitable strong inhomogeneity at the atomic scale introduced by the chemical doping. The bandwidth-controlled MITs of type (b), on the other hand, are typically coupled strongly to the structural degrees of freedom, as for examples in the bond disproportionation between the short and long Ni-O bonds in NiO3 Haule and Pascut (2017); Johnston et al. (2014); Park et al. (2012); Mizokawa et al. (2000) and the dimerization of vanadium atoms in VO2 Brito et al. (2016); Biermann et al. (2005). Such involvement of slow lattice dynamics in the MIT is also not favorable for fast switching. Hence, systems with electronic bandwidth-controlled MITs (i.e. weak or no lattice distortions involved) are desirable for fast resistive switching Ruzmetov et al. (2010); Yang et al. (2011).
Surprisingly, there are very few solids that are known to undergo purely electronic and bandwidth-controlled MITs, as was originally envisioned by Hubbard. From the theoretical side, there is growing evidence that starting from the metallic side, the MIT would not have occurred in any of above three systems (NiO3, V2O3, and VO2) in the absence of a simultaneous structural distortion. Even less common are such transitions in two-dimensional materials, which might be useful for ultrathin electronic and spintronic applications, and to our knowledge there is no known example of an electronically driven MIT among the van der Waals (vdW) materials except the recently discovered Mott phase and superconductivity in twisted bilayer graphene Cao et al. (2018a, b).
Here we propose new candidates for the electronic bandwidth-controlled MIT without significant structural distortion among the emerging class of two-dimensional vdW materials. Our target is a series of transition metal phosphorous trichalcogenides ( = Mn, Ni, = S, Se) Wang et al. (2016); Kim et al. (2018); Park (2016). To incorporate the electronic and structural degrees of freedom on an equal footing, we employ the state-of-the-art embedded dynamical mean-field theory combined with density functional theory (eDMFT), which implements forces on atoms and allows relaxation of internal atomic coordinates Haule (2018). For the optimization of the size and shape of unit cells we use density functional theory (DFT) augmented by the on-site Coulomb repulsion (DFT+), after which optimizations of internal atomic coordinates are performed both in eDMFT and DFT+ yielding consistent results111For DFT+DMFT calculations we use the Rutgers DFT+Embedded DMFT code Haule et al. (2010), while for DFT and DFT+U calculation we used the Vienna Ab-initio Simulation Package Kresse and Hafner (1993); Kresse and Furthmüller (1996). Dependency to different choices of exchange-correlation functionals, including van der Waals functionals, was also checked. For computational details refer to the Supplementary Material (SM), where we discussed the the difference between the -values employed in our eDMFT calculations and other studiesHaule et al. (2014); Mandal et al. (2019) . We mainly focus on paramagnetic phases of MnPS3 and NiP{S,Se}3 above their Néel temperatures ( = 78 and 154 K for MnPS3 and NiPS3 respectively Brec (1986); Wildes et al. (2006, 2015)), with disordered local Mn2+ () and Ni2+ () moments, although the behavior of their MITs in the magnetic phases is discussed in the Supplementary Material (SM). We will show that the recently discovered MIT in MnPS3 falls under the family of transitions coupled to structural changes, in which the dimerization plays a crucial role, therefore bearing a resemblance to the MIT in VO2 Wang et al. (2016). On the other hand, theoretical simulations in NiPS3 and NiPSe3 suggest that the MIT in these two vdW compounds occurs at even lower pressure, and does not involve a simultaneous structural transition. Therefore they become rare examples of electronic bandwidth-controlled transitions with a potential for very fast resistive switching.
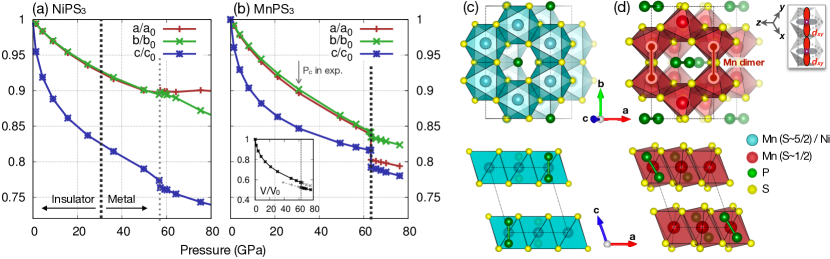
Crystal structures versus pressure. Fig. 1(a) and (b) show DFT+ results on the pressure-induced change of the three lattice parameters (, , and , where denote their zero-pressure values) for NiPS3 and MnPS3, respectively. Note that here we focus on the monoclinic structure as shown in Fig. 1(c). Because both of the compounds are vdW-type layered systems, the inter-plane lattice parameter shows a steeper decrease compared to the in-plane and , and the three-fold symmetry within each layer forces in the low- regime. The resulting volume decrease under pressure is substantial: 40% of volume reduction at GPa compared to the ambient pressure volume, as shown in the inset of Fig. 1(b).
Both compounds show MIT and structural phase transitions under pressure, but the nature of their transition is drastically different. As shown in Fig. 1(a), the MIT and the structural transition in NiPS3 occur at very different pressures, around 31 and 57 GPa respectively, while they coincide in MnPS3. Remarkably, theoretical simulations suggest that the MIT in NiPS3 accompanies no significant structural distortion (discontinuous structural changes, for example), and is thus a rare example of an electronically driven bandwidth-controlled MIT. On the other hand, in MnPS3 the isosymmetric structural transition (i.e., structural transition within the same space group symmetry) with a volume collapse at GPa is crucial for the occurrence of the MIT, hence the transition is better classified as the structurally assisted MIT (see Fig. 1(b)). We note that the theoretical critical pressure of GPa is somewhat overestimated compared to the experimentally reported value of GPa Wang et al. (2016). However, we show in the SM that within eDMFT, spinodal lines extend down to a much lower pressure of GPa with a much reduced energy barrier between the metallic and insulating solutions compared to the DFT+ results. Inclusion of the phonon free energy and the lattice zero-point energy, which is neglected here, could then move the position of the transition significantly (see the SM for further details).
In addition to the volume collapse, mostly from the discontinuous change of , DFT+ simulations of MnPS3 show a Mn-Mn dimerization along the -direction with the tilting of the P2 dimer as shown in Fig. 1(d). The Mn-Mn bond lengths between the dimer and non-dimer bonds are 2.42 and 3.10 Å at 63 GPa, respectively, which is a rather large difference. This Mn dimer formation is attributed to the direct - overlap between the Mn orbitals, pointing directly towards the nearest-neighbor Mn as shown in the inset of Fig. 1(d). Note that the previous experimental study suggested the formation of Mn zigzag chains in the high-P phase Wang et al. (2016), in contrast to our DFT+ and eDMFT results.
NiPS3, on the other hand, shows no such intermetallic dimerization or chain formation at the MIT or beyond the structural transition pressure, because the partially-filled Ni orbitals point towards the S atoms. This makes NiPS3 more sensitive to the - hybridization, yielding a smaller MIT pressure in NiPS3 compared to MnPS3. Such a stark contrast between NiPS3 and MnPS3, originating from the difference in their orbital physics, affects the nature of the structural behavior of their MIT as shown below. Note that the structural transition in NiPS3 at 57 GPa is not orbital in nature and comes purely from the reduced interlayer distance and the large overlap between the layers.
We note that the two compounds show markedly different pressure dependence of the lattice parameters even before the structural transition. By comparing Fig. 1(a) and (b) it is evident that the compression of under pressure is stronger in NiPS3 than in MnPS3; while in MnPS3 at 60 GPa is about 0.03 (See Fig. 1(b)), in NiPS3 it is about 0.15 (Fig. 1(a)) despite the similar volume change. In other words, it is much easier to compress NiPS3 along the layer-normal direction compared to MnPS3. Because the kinetic energy scale set by the hopping integrals between the (for MnPS3) and (for NiPS3) orbitals show different anisotropy, the and yield strong in-plane - and inter-plane --- overlaps respectively (See SM). As a result, while the orbitals favor in-plane compression for the larger in-plane kinetic energy gain, the orbitals prefer to reduce the inter-plane distance, yielding the tendency shown in Fig. 1(a) and (b).
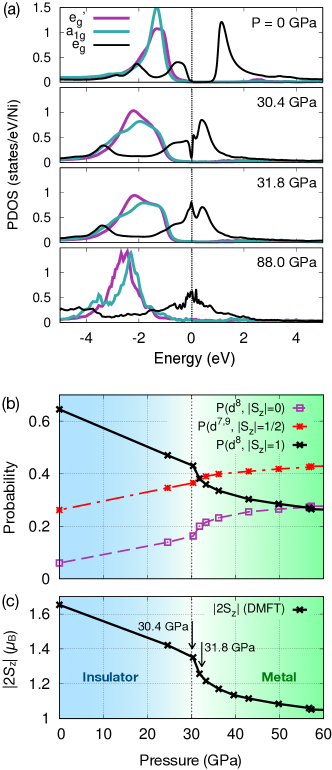
Electronic MIT in NiPS3. Below we take a closer look into the nature of the MIT in NiPS3. Note that all the spectra presented hereafter are eDMFT results, where the DFT+-optimized cell parameters and estimated pressure values are employed. Fig. 2(a) shows projected densities of states (PDOS) of NiPS3 with varying pressure from 0 to 88 GPa. It is clear that the states ( and ) are mostly occupied, while the states are partially filled and show a narrow dip at the Fermi level at 30.4 GPa. The self-energies of the orbitals show poles at the Fermi level (see SM), confirming the presence of the paramagnetic Mott phase. Previously, it was suggested that NiPS3 is a negative charge-transfer (NCT) insulator with a configuration ( denoting a S -ligand hole) Kim et al. (2018). However, our eDMFT results show that when the Ni occupation is close to , where the configuration is dominant, the Mott insulating state cannot be stabilized, i.e., the material is metallic. The experimentally observed Mott insulating behavior can only be achieved with the Ni occupancy of , where the high-spin = 1 configuration is dominant, i.e., corresponding to approximately half-filled states (see Fig. 2(b) for the probability distribution in the insulating and metallic states). This observation is corroborated by X-ray absorption spectroscopy, indicating that NiPS3 is close to the NCT regime, but is still dominated by the = 1 configuration, consistent with our eDMFT results Pal et al. (2018).
Fig. 2(b) shows the valence histogram for the few most important Ni configurations versus pressure at = 232K. The Mott insulating state is stable as long as the high-spin state ( = 1) of the Ni- configuration is dominant. Note that we report values rather than values, because of our choice of an Ising-type approximation of the Coulomb interaction in the eDMFT impurity solver 222This approximation leads to some mixing between = 0 and 1 states, but is not expected to change qualitative aspects of the results. Around 31 GPa the = 1/2 states (of and configurations) become equally probable, at which point the Mott state collapses and a narrow metallic quasiparticle peak appears (see the third panel in Fig. 2(a)). Despite the enhanced charge fluctuation, the change of Ni -orbital occupation () across the transition is negligible: = 8.15 and 8.19 at P = 0 and 88 GPa, respectively. The increase of charge fluctuations with increasing pressure has an additional effect of unlocking the = 0 sector of the configuration, which is favored in the itinerant low spin regime at large pressure. Note that the increase of the probability for = 0 at the expense of the = 1 state has a large effect on the size of the fluctuating moment , which is plotted in Fig. 2(c). Its zero-pressure value is around , which is quite reduced from the maximum atomic value of , and once it is reduced below it drops very suddenly and takes values of in the metallic state. We note that the change between 30.4 and 31.8 GPa is abrupt, which is likely associated with a first-order transition, for which a coexistence of both solutions is expected. However the hysteresis was not observed, probably because it is too narrow at the temperature studied (K). We mention that the MIT was carefully checked by employing beyond-Ising Coulomb interaction terms (spin-flip and pair-hopping types) at a lower temperature of K, but neither a hysteretic behavior nor a discontinuity in the energy-volume curve were found, signifying very weak coupling between the lattice and charge degrees of freedom in NiPS3 (see Sec. III. A in the SM and Fig. S3 therein for more details).
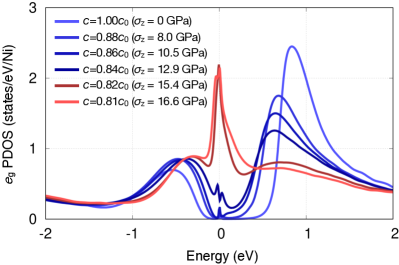
MIT driven by uniaxial pressure in NiPSe3. While the critical pressure for the MIT in NiPS3 can be reached in modern high-pressure experimental setups, a substitution of S by the more polarizable Se is expected to further reduce the critical pressure. Therefore the recently synthesized NiPSe3 Yan et al. (2017) can be a better candidate for realizing the pressure-driven MIT compared to NiPS3. Moreover, the collapse of the interlayer distance is expected to be sufficient to induce the MIT, which can even be achieved by the tip of an atomic-force microscope Lu et al. (2012). As a zeroth-order approximation, we simulate such layer-normal strain by varying the interlayer distance with fixed in-plane lattice parameters, and allowing the internal coordinates to relax within eDMFT. In Fig. 3 we show the -PDOS of NiPSe3 where the MIT happens at the modest stress of GPa at = 58 K, suggesting NiPSe3 as another promising electronic bandwidth-controlled Mott transition system among these layered vdW materials.
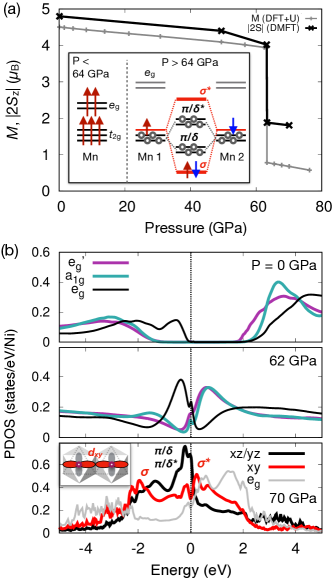
Volume collapse and MIT in MnPS3. We now address the volume-collapse transition in MnPS3. We first checked that once the optimized lattice parameters from DFT+ are employed, both DFT+ and eDMFT optimizations for the internal coordinates yield practically the same result. Fig. 4(a) shows the evolution of the fluctuating Mn moment within the PM eDMFT at = 580 K. We also show the ordered magnetic moment (per Mn) within DFT+ in the Néel-type antiferromagnetic ordered state Brec (1986); Okuda et al. (1986); Wang et al. (2016) (grey line in the plot). Perhaps not surprisingly, the two methods show very similar behavior: an insulating state of almost maximum spin = 5/2 configuration in the low-to-intermediate-P regime, and a metallic state with strongly reduced Mn moments above P = 64 GPa. The inset of Fig. 4(a) schematically depicts the spin-orbital configuration below and above the transition. In the presence of strong external pressure, the orbitally inert high-spin = 5/2 configuration becomes energetically unstable, and the low-spin = 1/2 with the partially filled orbital is stabilized with an octahedral volume collapse Kuneš et al. (2008). As a result, the open shell in this edge-sharing geometry leads to a strong -like direct - overlap between the nearest-neighboring (NN) Mn sites, resulting in a strong tendency toward Mn dimerization Streltsov and Khomskii (2016). At ambient pressure, because of the weak inter-layer coupling, the three in-plane NN bonds are essentially equivalent to each other. In the high-pressure regime, however, the monoclinicity originating from the layer stacking is no longer negligible. Therefore, the NN bond parallel to the direction, which becomes nonequivalent to the other bonds, dimerizes as shown in Fig. 1(d) (see Sec. III. B in the SM for more details on inclusion of the beyond-Ising Coulomb terms).
Summary. We report a theoretical study of the Mott MIT induced by external pressure in strongly correlated layered vdW materials. We comment that the Mott phases in other metal trisulfides, such as FePS3 Lee et al. (2016) or CoPS3 Wildes et al. (2017), are also of great interest because of their partially filled shells even under ambient conditions. Overall, this family of vdW-layered transition metal trichalcogenides can be an excellent platform for the study of strong electron correlations and their cooperation with spin and lattice degrees of freedom.
Acknowledgements.
Acknowledgments: We thank Matthew J. Coak, Michael O. Yokosuk, Nathan C. Harms, Kevin A. Smith, Sabine N. Neal, Janice L. Musfeldt and Sang-Wook Cheong for helpful discussions. The work was supported by NSF DMREF grant DMR-1629059. HSK thanks the support of the 2019 research grant for new faculty members from Kangwon National University, and also the support of supercomputing resources including technical assistances from the National Supercomputing Center of Korea (Grant No. KSC-2019-CRE-0036)References
- Mott and Peierls (1937) N. F. Mott and R. Peierls, Proc. Phys. Soc. 49, 72 (1937).
- Hubbard (1963) J. Hubbard, Proc. Royal Soc. Lond. A 276, 238 (1963).
- Bednorz and Müller (1986) J. G. Bednorz and K. A. Müller, Z. Phys. B 64, 189 (1986).
- Torrance et al. (1992) J. B. Torrance, P. Lacorre, A. I. Nazzal, E. J. Ansaldo, and C. Niedermayer, Phys. Rev. B 45, 8209 (1992).
- Medarde (1997) M. L. Medarde, J. Phys. Condens. Matter 9, 1679 (1997).
- Morin (1959) F. J. Morin, Phys. Rev. Lett. 3, 34 (1959).
- McWhan et al. (1971) D. B. McWhan, J. P. Remeika, T. M. Rice, W. F. Brinkman, J. P. Maita, and A. Menth, Phys. Rev. Lett. 27, 941 (1971).
- Carter et al. (1993) S. A. Carter, T. F. Rosenbaum, P. Metcalf, J. M. Honig, and J. Spalek, Phys. Rev. B 48, 16841 (1993).
- Qazilbash et al. (2007) M. M. Qazilbash, M. Brehm, B.-G. Chae, P.-C. Ho, G. O. Andreev, B.-J. Kim, S. J. Yun, A. V. Balatsky, M. B. Maple, F. Keilmann, H.-T. Kim, and D. N. Basov, Science 318, 1750 (2007).
- Haule and Pascut (2017) K. Haule and G. L. Pascut, Sci. Rep. 7, 10375 (2017).
- Johnston et al. (2014) S. Johnston, A. Mukherjee, I. Elfimov, M. Berciu, and G. A. Sawatzky, Phys. Rev. Lett. 112, 106404 (2014).
- Park et al. (2012) H. Park, A. J. Millis, and C. A. Marianetti, Phys. Rev. Lett. 109, 156402 (2012).
- Mizokawa et al. (2000) T. Mizokawa, D. I. Khomskii, and G. A. Sawatzky, Phys. Rev. B 61, 11263 (2000).
- Brito et al. (2016) W. H. Brito, M. C. O. Aguiar, K. Haule, and G. Kotliar, Phys. Rev. Lett. 117, 056402 (2016).
- Biermann et al. (2005) S. Biermann, A. Poteryaev, A. I. Lichtenstein, and A. Georges, Phys. Rev. Lett. 94, 026404 (2005).
- Ruzmetov et al. (2010) D. Ruzmetov, G. Gopalakrishnan, C. Ko, V. Narayanamurti, and S. Ramanathan, J. Appl. Phys. 107, 114516 (2010).
- Yang et al. (2011) Z. Yang, C. Ko, and S. Ramanathan, Annu. Rev. Mater. Res. 41, 337 (2011).
- Cao et al. (2018a) Y. Cao, V. Fatemi, A. Demir, S. Fang, S. L. Tomarken, J. Y. Luo, J. D. Sanchez-Yamagishi, K. Watanabe, T. Taniguchi, E. Kaxiras, R. C. Ashoori, and P. Jarillo-Herrero, Nature 556, 80 EP (2018a).
- Cao et al. (2018b) Y. Cao, V. Fatemi, S. Fang, K. Watanabe, T. Taniguchi, E. Kaxiras, and P. Jarillo-Herrero, Nature 556, 43 EP (2018b).
- Wang et al. (2016) Y. Wang, Z. Zhou, T. Wen, Y. Zhou, N. Li, F. Han, Y. Xiao, P. Chow, J. Sun, M. Pravica, A. L. Cornelius, W. Yang, and Y. Zhao, J. Am. Chem. Soc. 138, 15751 (2016).
- Kim et al. (2018) S. Y. Kim, T. Y. Kim, L. J. Sandilands, S. Sinn, M.-C. Lee, J. Son, S. Lee, K.-Y. Choi, W. Kim, B.-G. Park, C. Jeon, H.-D. Kim, C.-H. Park, J.-G. Park, S. J. Moon, and T. W. Noh, Phys. Rev. Lett. 120, 136402 (2018).
- Park (2016) J.-G. Park, J. Phys. Condens. Matter 28, 301001 (2016).
- Haule (2018) K. Haule, J. Phys. Soc. Jpn. 87, 041005 (2018).
- Note (1) For DFT+DMFT calculations we use the Rutgers DFT+Embedded DMFT code Haule et al. (2010), while for DFT and DFT+U calculation we used the Vienna Ab-initio Simulation Package Kresse and Hafner (1993); Kresse and Furthmüller (1996). Dependency to different choices of exchange-correlation functionals, including van der Waals functionals, was also checked. For computational details refer to the Supplementary Material (SM), where we discussed the the difference between the -values employed in our eDMFT calculations and other studiesHaule et al. (2014); Mandal et al. (2019).
- Brec (1986) R. Brec, Solid State Ion. 22, 3 (1986).
- Wildes et al. (2006) A. R. Wildes, H. M. Rønnow, B. Roessli, M. J. Harris, and K. W. Godfrey, Phys. Rev. B 74, 094422 (2006).
- Wildes et al. (2015) A. R. Wildes, V. Simonet, E. Ressouche, G. J. McIntyre, M. Avdeev, E. Suard, S. A. J. Kimber, D. Lançon, G. Pepe, B. Moubaraki, and T. J. Hicks, Phys. Rev. B 92, 224408 (2015).
- Pal et al. (2018) B. Pal, H.-S. Kim, K. Haule, D. Vanderbilt, J. Chakhalian, and J. Freeland, (2018), to be submitted.
- Note (2) This approximation leads to some mixing between = 0 and 1 states, but is not expected to change qualitative aspects of the results.
- Yan et al. (2017) J.-Q. Yan, B. C. Sales, M. A. Susner, and M. A. McGuire, Phys. Rev. Mater. 1, 023402 (2017).
- Lu et al. (2012) H. Lu, C.-W. Bark, D. Esque de los Ojos, J. Alcala, C. B. Eom, G. Catalan, and A. Gruverman, Science 336, 59 (2012).
- Okuda et al. (1986) K. Okuda, K. Kurosawa, S. Saito, M. Honda, Z. Yu, and M. Date, J. Phy. Soc. Jpn. 55, 4456 (1986).
- Kuneš et al. (2008) J. Kuneš, A. V. Lukoyanov, V. I. Anisimov, R. T. Scalettar, and W. E. Pickett, Nat. Mater. 7, 198 EP (2008).
- Streltsov and Khomskii (2016) S. V. Streltsov and D. I. Khomskii, Proc. Natl. Acad. Sci. U.S.A. 113, 10491 (2016).
- Lee et al. (2016) J.-U. Lee, S. Lee, J. H. Ryoo, S. Kang, T. Y. Kim, P. Kim, C.-H. Park, J.-G. Park, and H. Cheong, Nano Letters, Nano Letters 16, 7433 (2016).
- Wildes et al. (2017) A. R. Wildes, V. Simonet, E. Ressouche, R. Ballou, and G. J. McIntyre, J. Phys. Condens. Matter 29, 455801 (2017).
- Haule et al. (2010) K. Haule, C.-H. Yee, and K. Kim, Phys. Rev. B 81, 195107 (2010).
- Kresse and Hafner (1993) G. Kresse and J. Hafner, Phys. Rev. B 47, 558 (1993).
- Kresse and Furthmüller (1996) G. Kresse and J. Furthmüller, Phys. Rev. B 54, 11169 (1996).
- Haule et al. (2014) K. Haule, T. Birol, and G. Kotliar, Phys. Rev. B 90, 075136 (2014).
- Mandal et al. (2019) S. Mandal, K. Haule, K. M. Rabe, and D. Vanderbilt, arXiv preprint arXiv:1907.10498 (2019).
- Perdew et al. (2008) J. P. Perdew, A. Ruzsinszky, G. I. Csonka, O. A. Vydrov, G. E. Scuseria, L. A. Constantin, X. Zhou, and K. Burke, Phys. Rev. Lett. 100, 136406 (2008).
- Dudarev et al. (1998) S. L. Dudarev, G. A. Botton, S. Y. Savrasov, C. J. Humphreys, and A. P. Sutton, Phys. Rev. B 57, 1505 (1998).
- Ceperley and Alder (1980) D. M. Ceperley and B. J. Alder, Phys. Rev. Lett. 45, 566 (1980).
- Perdew et al. (1996) J. P. Perdew, K. Burke, and M. Ernzerhof, Phys. Rev. Lett. 77, 3865 (1996).
- Blaha et al. (2001) P. Blaha, K. Schwarz, G. K. H. Madsen, D. Kvasnicka, and J. Luitz, WIEN2k, An Augmented Plane Wave + Local Orbitals Program for Calculating Crystal Properties (Karlheinz Schwarz, Techn. Universität Wien, Austria, 2001).
- Haule and Pascut (2016) K. Haule and G. L. Pascut, Phys. Rev. B 94, 195146 (2016).
- Haule and Birol (2015) K. Haule and T. Birol, Phys. Rev. Lett. 115, 256402 (2015).
- Haule (2007) K. Haule, Phys. Rev. B 75, 155113 (2007).
- Grasso et al. (1991) V. Grasso, F. Neri, P. Perillo, L. Silipigni, and M. Piacentini, Phys. Rev. B 44, 11060 (1991).
- Dion et al. (2004) M. Dion, H. Rydberg, E. Schröder, D. C. Langreth, and B. I. Lundqvist, Phys. Rev. Lett. 92, 246401 (2004).
- Lee et al. (2010) K. Lee, E. D. Murray, L. Kong, B. I. Lundqvist, and D. C. Langreth, Phys. Rev. B 82, 081101 (2010).
- Klimeš et al. (2009) J. Klimeš, D. R. Bowler, and A. Michaelides, J. Phys. Condens. Matter 22, 022201 (2009).
- Chen et al. (2015) J. Chen, A. J. Millis, and C. A. Marianetti, Phys. Rev. B 91, 241111 (2015).
- Mostofi et al. (2014) A. A. Mostofi, J. R. Yates, G. Pizzi, Y.-S. Lee, I. Souza, D. Vanderbilt, and N. Marzari, Comput. Phys. Commun. 185, 2309 (2014).
- Han et al. (2018) Q. Han, T. Birol, and K. Haule, Phys. Rev. Lett. 120, 187203 (2018).
I Computational details
I.1 Density functional theory calculations
For unit cell optimizations and relaxations of initial internal coordinates, the Vienna ab-initio Simulation Package (vasp), which employs the projector-augmented wave (PAW) basis set Kresse and Hafner (1993); Kresse and Furthmüller (1996), was used for density functional theory (DFT) calculations in this work. 340 eV of plane-wave energy cutoff and 868 Monkhorst-Pack -grid sampling were employed. For the treatment of electron correlations within DFT, a revised Perdew-Burke-Ernzerhof exchange-correlation functional for crystalline solid (PBEsol) was employedPerdew et al. (2008), in addition augmented by on-site Coulomb interactions for transition metal -orbitals within a simplified rotationally-invariant form of DFT+ formalismDudarev et al. (1998). eV/Å of force criterion was employed for structural optimizations. For test purpose, Ceperley-Alder local density approximationCeperley and Alder (1980) and the original PBEPerdew et al. (1996) functionals were also used.
Structural relaxations for all compounds were performed in the presence of the DFT+ (4 eV) on-site Coulomb interaction and a Néel-type antiferromagnetic orderBrec (1986), which gives reasonable agreements of lattice parameters and gap sizes with experimentally observed valuesWang et al. (2016); Kim et al. (2018). It should be mentioned that, without incorporating magnetism and to open the gap, the volume is severely underestimated for both compounds, especially 20% smaller in MnPS3. This observation signifies the role of electron correlations in structural properties of these compounds.
I.2 Dynamical mean-field theory calculations
A fully charge-self-consistent dynamical mean-field methodHaule et al. (2010), implemented in Rutgers DFT + Embedded DMFT (eDMFT) Functional code (http://hauleweb.rutgers.edu/tutorials/) which is combined with wien2k codeBlaha et al. (2001), is employed for computations of electronic properties and optimizations of internal coordinatesHaule and Pascut (2016). In DFT level the Perdew-Wang local density approximation (LDA) is employed, which was argued to yield the best agreement of lattice properties combined with DMFTHaule and Birol (2015). 500 -points were used to sample the first Brillouin zone with = 7.0. A force criterion of 10-4 Ry/Bohr was adopted for optimizations of internal coordinates. A continuous-time quantum Monte Carlo method in the hybridization-expansion limit (CT-HYB) was used to solve the auxiliary quantum impurity problemHaule (2007), where the full 5 -orbitals of Ni and Mn were chosen as our correlated subspaces in a single-site DMFT approximation. For the CT-HYB calculations, up to 1010 Monte Carlo steps were employed for each Monte Carlo run. In most runs temperature was set to be 232K, but in some calculations with high pressure it was increased up to 580K because of the increased hybridization between the impurity and bath. -10 to +10 eV of hybridization window (with respect to the Fermi level) was chosen, and = 10 eV and = 1 eV of on-site Coulomb interaction parameters were used for both Mn and Ni -orbitals. A simplified Ising-type (density-density terms only) Coulomb interaction was employed in this work, and it was tested that the use of full Coulomb interaction yields only quantitatively different results in terms of pressure-induced evolution of electronic structures; see Sec. III for more details. A nominal double counting scheme was used, with the -orbital occupations for double counting corrections for Ni and Mn were chosen to be 8 and 5, respectively.
We comment that the choice of optimal values of the Coulomb interaction is method-dependent. Other than the eDMFT approach chosen in this study, there are two widely employed first-principles methods using to incorporate electron correlations; (a) DFT+, and (b) DFT+DMFT with Wannierized correlated orbitals. Both methods use smaller values of ( 4 eV) for the correlated orbitals in transition-metal compounds compared to eDMFT (10 eV)Haule et al. (2014); Mandal et al. (2019). First, unlike in DFT+, in DFT+DMFT formalisms all (local) dynamic screening processes are included via exactly solving the many-body impurity problem. Being such screening processes explicitly treated within DFT+DMFT means that, the input Coulomb interaction should be closer to the bare one (only screened by the core and semi-core states). In DFT+, on the contrary, one should use the screened (whose value smaller than the DMFT ) to compensate the missing screening processes therein. Hence the values employed in our eDMFT results are larger than the values used in DFT+ calculations.
Secondly, for DFT+DMFT with Wannierized correlated orbitals, it is well known that the Wannier functions contain a substantial amount of character from anions (oxygen or chalcogen ions) if a narrow Wannierization energy window that contains only the correlated subspace is chosen. Consequently the critical becomes much smaller because of the mixing of character, to be indeed of the order of the bandwidth . Note that this approach is equivalent to solving Hubbard-type models, where only correlated orbital degrees of freedom are considered.
Contrary to the aforementioned approaches, in the eDMFT formalism we are solving a generalized Anderson-lattice type Hamiltonian (actually the - type Hamiltonian), where the effective that could be compared with the Hubbard- in the Hubbard-type model is actually the - splitting. The advantage of using such - type Hamiltonian in DFT+DMFT is evident; the values in such models are much more system-independent for many transition-metal compounds, as demonstrated recentlyHaule et al. (2014); Mandal et al. (2019). Therein we established that a reasonable for a wide range of transition-metal oxides within the eDMFT (i.e. the - model with very localized orbitals described above) is around 10 eV and = 1 eV, and is much more universal than the values in downfolded Hubbard-like models.
II Exchange-correlation and van der Waals functional dependence within DFT+
II.1 Dependence on exchange-correlation functionals and -value in DFT+ results
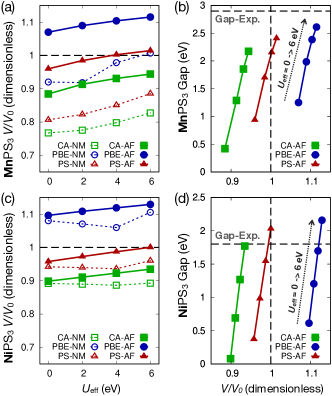
Fig. S5 shows how MnPS3 and NiPS3 behave under the choice of different exchange-correlation functionals and the value of , where experimental cell volumes and gap sizes are from Ref. Brec, 1986; Grasso et al., 1991; Kim et al., 2018. Fig. S5(a) and (c) show how the cell volume depends on the choice of exchange-correlation (XC) functionals, the presence of antiferromagnetic (AF) order, and the values for each compound. We notice that i) the absence of AF order, which prevents the formation of high-spin configurations in both compounds, yields significantly underestimated cell volumes in all cases. Such behavior is more evident in MnPS3, where the absence of magnetism leads to the low-spin configuration that favors intermetallic bonding. ii) the PBEsol XC functional gives better agreement with experimental volume than CA or PBE, and using = 4 6 eV in the PBEsol+ setup produces the best fit. The same conclusion can be also made from the gap-volume dependence shown in Fig. S5(b) and (d), where the use of PBEsol+ (4 eV) yields the best fit of gap size and cell volume for both compounds. Overall, employing PBEsol+ (4 eV) does seem reasonable for studying pressurized MnPS3 and NiPS3.
II.2 van der Waals functional dependence
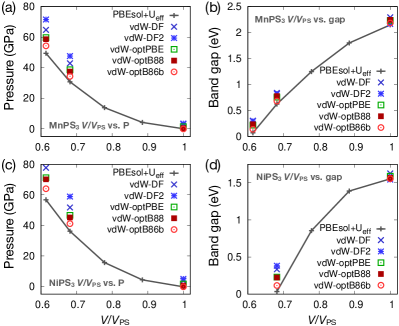
Fig. S6 presents how the estimated pressure and the size of Kohn-Sham energy gap at a given volume depend on the choice of van der Waals (vdW) functionals in MnPS3 and NiPS3. The range of unit cell volume is chosen to be , where is the ambient-pressure cell volume optimized with PBEsol+ (4 eV). We employed 5 different vdW functionals implemented in vasp; vdW-DFDion et al. (2004), vdW-DF2Lee et al. (2010), optPBE, optB88, and optB86bKlimeš et al. (2009). For both compounds, different functionals tend to give similar results, while NiPS3 shows more noticeable functional dependence compared to MnPS3. It can be speculated that, in NiPS3 with an open-shell Ni orbitals, the unquenched orbital degree of freedom makes the system a bit more sensitive to the treatment of correlations. Nevertheless the qualitative features we address in this manuscript, the pressure-driven insulator-to-metal transitions and their orbital dependence, remain basically the same as shown in Fig. S6(b) and (d).
Specifically we notice that vdW functionals, except vdW-DF and vdW-DF2 functionals, show reasonable agreements with PBEsol results. vdW-DF and vdW-DF2 functionals tends to prefer larger volume (i.e. larger estimated at the same volume compared to other functionals). This is because these functionals favor larger interlayer distances in the high-pressure regime than conventional XC functionals. Overall, even though use of different vdW functional induces some quantitative differences, it does not seem to change our main conclusions in this work.
We comment that, since vdW functionals favor larger cell volume, the inclusion of them should enhance the magnitude of critical pressures for structural/electronic transitions in both compounds, which is actually making the discrepancy between the theoretical prediction and experimental observation slightly worse in MnPS3. Hence we argue that PBEsol+ can be a more reasonable choice in this pressurized setup where the direct orbital overlap between layers becomes significant.
III Comparison with DFT+ and DMFT
| MnPS3 | NiPS3 | ||||||||||
| 1.00 | 0.56 | 1.00 | 0.56 | ||||||||
| (GPa) | 0.0 | 49.8 | 0.0 | 88.0 | |||||||
| a | 6.025 | 4.916 | 5.761 | 5.173 | |||||||
| b | 10.436 | 8.845 | 9.977 | 8.531 | |||||||
| c (Å) | 6.870 | 5.542 | 6.736 | 4.938 | |||||||
| (degree) | 106.67 | 108.72 | 106.64 | 110.17 | |||||||
| DFT+ | eDMFT | DFT+ | eDMFT | DFT+ | eDMFT | DFT+ | eDMFT | ||||
| Mn () | 0.3327 | 0.3326 | 0.3589 | 0.3585 | Ni () | 0.3333 | 0.3329 | 0.3339 | 0.3344 | ||
| P () | 0.0550 | 0.0552 | -0.0376 | -0.0256 | P () | 0.0570 | 0.0573 | 0.0803 | 0.0790 | ||
| 0.1674 | 0.1683 | 0.1719 | 0.1770 | 0.1677 | 0.1687 | 0.2223 | 0.2199 | ||||
| S1 () | 0.7551 | 0.7431 | 0.6707 | 0.6831 | S1 () | 0.7346 | 0.7378 | 0.7299 | 0.7324 | ||
| 0.2474 | 0.2512 | 0.3409 | 0.3539 | 0.2371 | 0.2420 | 0.2948 | 0.2995 | ||||
| S2 () | 0.2441 | 0.2448 | 0.2426 | 0.2463 | S2 () | 0.2523 | 0.2467 | 0.2990 | 0.2988 | ||
| 0.1628 | 0.1625 | 0.1858 | 0.1855 | 0.1727 | 0.1719 | 0.1930 | 0.1923 | ||||
| 0.2485 | 0.2525 | 0.2617 | 0.2781 | 0.2366 | 0.2422 | 0.2909 | 0.2955 | ||||
Table 1 presents the comparison between PBEsol+- and eDMFT-optimized atomic coordinates of MnPS3 and NiPS3, both at ambient and high-pressure regimes. Here ambient and high-pressure results represent Mott-insulating and weakly correlated metallic phases, respectively, for both compounds. In eDMFT calculations, as commented in the manuscript, optimized cell parameters a, b, c, and monoclinic angle from PBEsol+ were employed. This is due to the absence of stress tensor formalism implemented in any of full-potential linearized augmented plane wave codes, and in DFT+DMFT formalisms as well. Under this constraint, eDMFT-optimized atomic coordinates show very similar results with PBEsol+ ones despite different magnetization conditions; paramagnetic order for eDMFT, and antiferromagnetism (Néel order for MnPS3, zigzag order for NiPS3) in PBEsol+.
However, the validity of employing DFT+ with a magnetic order in optimizing crystal structures of paramagnetic systems, especially the cell parameters, may need to be checked. This is because, like in MnPS3 as shown in the manuscript, some structural phase transitions are strongly coupled to elastic deformations of the unit cell. One may even suspect that the discrepancy between the predicted and experimentally reportedWang et al. (2016) critical pressures of the structural transition in MnPS3 might originate from the use of magnetic DFT+ in optimizing the unit cell size and shape.
To resolve the issue mentioned above, energy landscapes from DFT+ and eDMFT in the cell parameter space need to be compared with each other. Even though full structural relaxations may not be possible within eDMFT formalism, several trials to compare DFT+- and DMFT-optimized structures were performed, where DMFT calculations were done in the paramagnetic configuration.
III.1 NiPS3
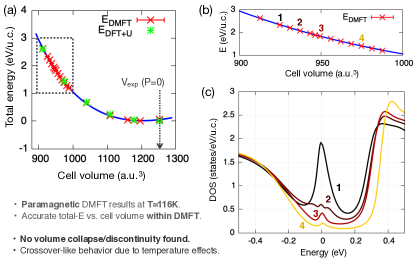
According to our result presented in the manuscript, NiPS3 does not have a noticeable structural change at the MIT pressure of 30 GPa, which is somewhat unusual. Hence, for a closer look on the structure-free MIT point, we computed a total energy curve versus cell volume for paramagnetic (PM) eDMFT near the MIT. For more accurate results, the rotationally invariant form of the Coulomb interaction (spin-flip and pair-hopping included) was employed at a lower temperature of = 116 K. PM MIT is usually known to accompany a sudden volume change (as reported in Ref. 35 in the manuscript, for example), which should be captured as a discontinuity in the energy-volume curve at the MIT point. Figure S7 shows a summary of the results; note that all the data points were obtained from calculations started from scratch to capture both the metallic and insulating phases (with optimized internal parameters). It can be seen that both the PBEsol+ and DFT+DMFT data points remarkably collapse onto a single Birch-Murnaghan energy-volume curve (Fig. S7(a)), and that no discontinuity can be noticed near the MIT point (Fig. S7(b) and (c)). Note that the use of the additional Coulomb interaction with the spin-flip and pair-hopping terms (hereafter denoted as ‘beyond-Ising’ terms) lowered the MIT critical pressure from 31 to 24 GPa. The crossover-like behavior can be attributed to the temperature effect, but due to the computational cost issue the temperature could not be lowered below = 116 K.
III.2 MnPS3
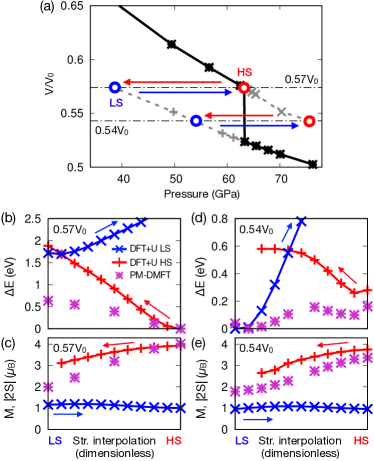
As marked in Fig. 1(a) in the main text, the value of critical pressure predicted by PBEsol+ calculations is twice bigger than the one reported in Ref. Wang et al., 2016 (63 vs. 30 GPa). For a better understanding of this discrepancy, we perform calculations with interpolating structures between the honeycomb high-spin and the dimerized low-spin structures as shown in Fig. S8. Because the computation of stress tensor is not yet available in the current eDMFT formalism, two constant-volume cuts at = 0.57 and 0.54 are taken for a total energy comparison as shown in Fig. S8(a). For PBEsol+ results, high-spin and low-spin states are first converged in their honeycomb and dimerized structures respectively, and then the crystal structures are slowly distorted towards the other side while maintaining the local minima spin states.
Fig. S8(b) and (c) are relative total energies and size of spin moments from the high-, low-spin PBEsol+, and paramagnetic eDMFT calculations at = 0.57 . A remarkable feature is, while the energy difference between the high- and low-spin ground states is 1.72 eV in PBEsol+, it is 0.58 eV in eDMFT, which is almost one third of the PBEsol+ value. Furthermore, while the high- and low-spin local minima states remain (meta)stable even after the structural changes, as shown in Fig. S8(c), in eDMFT we have a spin-state crossover as the structure evolve from one limit to another. This features persist at = 0.54 (Fig. S8(d,e)), where the height of the energy barrier from the high-spin to the low-spin state (0.3 eV) is substantially suppressed (60 meV) with the same spin-state crossover. These observations show that, the dynamical fluctuation effect inherent in eDMFT causes mixing between different spin configurations, hence introducing the crossover behavior shown in Fig. S8(c) and (e) and suppressing the energy differences. This observation is consistent with a previous DFT+DMFT study on a spin-state-crossover moleculeChen et al. (2015). Note that, our analysis here does not explicitly predict that the low-spin state is stabilized at lower pressure in eDMFT results shown in Fig. 1(a) in the main text. However, since the energy difference between different states is reduced to a fraction compared to PBEsol+ results, the value of critical pressure might be reduced after the lattice free energy contribution and the zero-point fluctuation ignored in this work are included.
| Dimerized | Non-dimer | |||
|---|---|---|---|---|
| 0.55 | 0.61 | |||
| 49.8 GPa | 49.4 GPa | |||
| 0.8159 | 0.8619 | |||
| 0.8475 | 0.8653 | |||
| 0.8066 | 0.8263 | |||
| 108.72∘ | 107.32∘ | |||
| Coulomb | Ising | Beyond-Ising | Ising | Beyond-Ising |
| Mn (4g) | (0.0000, 0.1415, 0.0000) | (0.0000, 0.1407, 0.0000) | (0.0000, 0.1664, 0.0000) | (0.0000, 0.1661, 0.0000) |
| P (4i) | (0.5256, 0.0000, 0.8230) | (0.5278, 0.0000, 0.8238) | (0.4358, 0.0000, 0.8064) | (0.4358, 0.0000, 0.8063) |
| S1 (4i) | (0.8170, 0.0000, 0.6461) | (0.8176, 0.0000, 0.6451) | (0.2598, 0.0000, 0.6964) | (0.2603, 0.0000, 0.6961) |
| S2 (8j) | (0.7538, 0.3145, 0.7219) | (0.2542, 0.3142, 0.7227) | (0.2231, 0.3205, 0.6980) | (0.2228, 0.3201, 0.6984) |
We comment that, due to the increased computational cost of the CT-HYB impurity solver by the enhanced intermetallic hybridization in the pressurized setup, all eDMFT data points presented in Fig. S8 were obtained at = 580 K. Even without the beyond-Ising Coulomb terms, which significantly increases sign problems in the impurity solver stage, the temperature could not be lowered due to the computational cost issue. Therefore we could not check all the results with employing the beyond-Ising Coulomb terms. As a partial check, we have done two eDMFT calculations for MnPS3, employing two lattice parameter sets (, , , and the monoclinic angle ) corresponding to non-dimerized metallic and dimerized Mott-insulating states around GPa. Initial internal coordinates, optimized within eDMFT afterwards, were adopted from the ambient pressure structure. The purpose of this comparison is to see whether the choice of different Coulomb interactions yields noticeable difference. Table II summarizes the optimized structures with Ising and beyond-Ising Coulomb interactions, which shows negligible difference with respect to each other. Hence we are safe to use Ising form in this case.
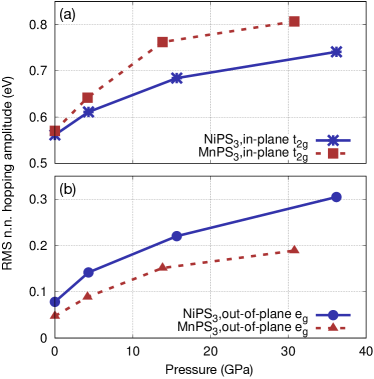
IV In-plane and out-of-plane hopping amplitudes
Fig. S9(a) and (b) show root mean square (RMS) amplitudes of nearest-neighbor (n.n.) in-plane and out-of-plane hopping integrals, respectively, for MnPS3 and NiPS3. The -orbital hopping integrals were computed using wannier90 packageMostofi et al. (2014), employing optimized crystal structures in the presence of external pressure, without including and magnetism.
As shown in Fig. 1(a) and (b) in the main text, the in-plane lattice parameters (with respect to their ambient pressure value) and for MnPS3 around 30 GPa are smaller by 2% compared to those of NiPS3, while the out-of-plane of MnPS3 is larger than that of NiPS3. In accordance with the tendency of lattice parameter changes, the enhancement of RMS in-plane hopping integrals is more pronounced in MnPS3, which drives the formation of in-plane Mn dimer formation after the transition to the low-spin state with the open shell. Note that, the in-plane hopping integrals for Ni is also enhanced as the pressure is increased, but its effect is not significant due to the closed shell in the Ni configuration. Similarly, the enhanced out-of-plane kinetic energy between the orbitals in NiPS3, depicted in Fig. S9(b), induces more pronounced reduction of the parameter in NiPS3 compared to that of MnPS3. It should be mentioned that, while the out-of-plane hopping terms are also enhanced in MnPS3, their role in structural response to pressure is less significant both in the low- and high-pressure regimes; in the low-pressure regime the hybridization between the high-spin Mn ion and anions is weak, and so is the electron-lattice coupling, while in the high-pressure regime the high-spin Mn has empty shell.
V Electronic structures with a Néel order
V.1 Ambient pressure cases for both compounds
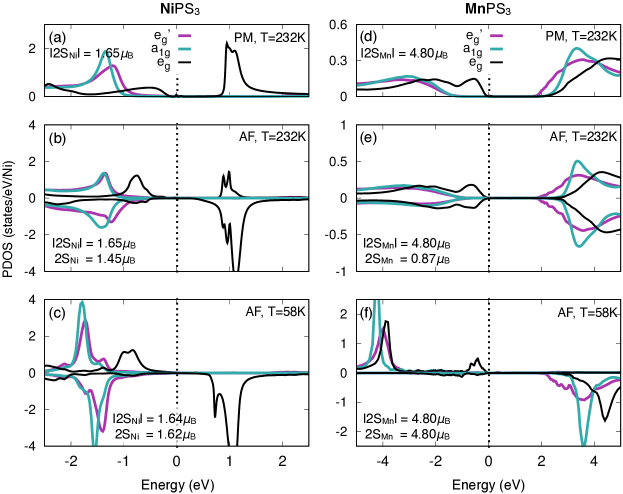
Fig. S10 shows the spectral functions of NiPS3 (a-c) and MnPS3 (d-f) with a Néel-type antiferromagnetic (AF) order in comparison with the paramagnetic (PM) phases. In both compounds, the presence of magnetism does not alter the size of charge gap, consistent with the Mott character of the insulating phases in both compounds. As the temperature is lowered and magnetism sets in, the broadening of spectral functions due to the imaginary part of self-energy is weakened. Indeed, DFT+ PDOS with the magnetic order shows very similar qualitative features with DMFT PDOS at =58K (not shown).
Note that, the use of the Ising-type Coulomb repulsion gives rise to the stabilization of magnetic order well above the Néel temperatures of both compounds, = 154 and 78 K for NiPS3 and MnPS3, respectivelyBrec (1986); Wildes et al. (2006, 2015), as reported in previous DFT+DMFT studiesHan et al. (2018). It is argued that a larger in-plane kinetic energy scale originating from the orbital in Ni yields the higher in NiPS3 compared to MnPS3Kim et al. (2018). Despite the overestimated , such tendency can be noticed in our results by comparing Fig. S10(b) and (e). While the size of the Ni magnetization in NiPS3 (2 = 1.45 ) is almost saturated to the value of PM moment ( = 1.65 ), even at = 232K, the Mn magnetization in MnPS3 at the same is 2 = 0.87 , just a fraction of the = 5/2 moment size (4.80 ) of the high-spin Mn. As is lowered to 58K, magnetizations in both compounds saturate to the local moment size, as shown in Fig. S10(c) and (f).
V.2 Near the MIT critical pressure
V.2.1 MnPS3
As discussed in the main text, the pressure-induced MIT in MnPS3 in the paramagnetic phase is a discontinuous transition accompanied by a spin-state transition and isosymmetric structural distortion with a volume collapse. Such discontinuous character does not change in the presence of magnetism, as shown in Fig. S12, where the change of the Mn magnetization (per Mn) from DFT+ and eDMFT results (at = 232 K) are shown as a function of pressure. Note that, the upturn of in the small-pressure regime ( 10 GPa) in eDMFT is due to the enhancement of magnetic exchange interactions originating from increased kinetic energy scale under the pressure.
V.2.2 NiPS3
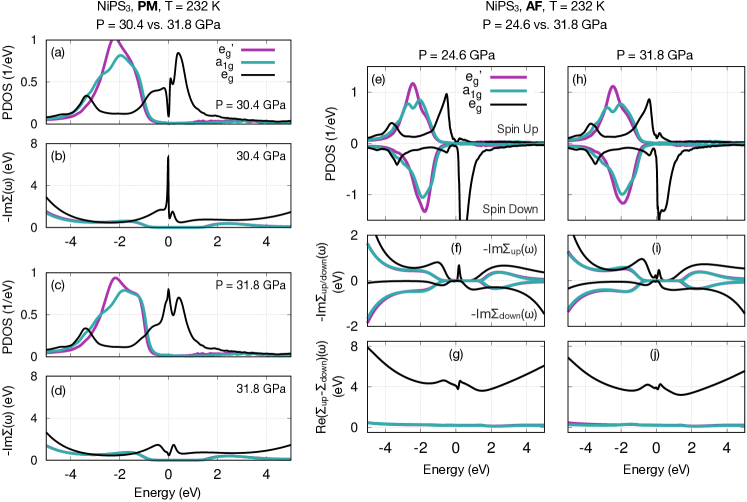
In the PM phase of NiPS3, the MIT can be indicated not only by the gap opening in the PDOS, but also by the change of electron self-energies . In Fig. S11(a) and (c), the MIT can be noticed by the presence and absence of the dip at the Fermi level in their PDOS, but it is slightly unclear whether the phase at P = 30.4 GPa is an insulator due to the small but finite DOS at the Fermi level due to the broadening. However, , plotted in Fig. S11(b) and (d), show a clear difference between the two phases, because the presence (absence) of a pole at the Fermi level in the - signifies the presence (absence) of the Mott physics.
In the AF-ordered phases, the gap opening is induced by the exchange splitting between the spin up and down components, i.e. . In cases where is weak compared to and the frequency dependence of is small, then the eDMFT results become equivalent to the DFT+ results. Fig. S11(e-j) present such situation, where the PDOSs shown in Fig. S11(e) and (h) become qualitatively equivalent to DFT+ PDOS (not shown), with the exchange splitting of 4 eV at the Fermi level opening a gap for the bands. Hence, in AF phases the MIT critical pressure is mainly determined by the bandwidth and the exchange splitting . Because the above quantities change continuously as the pressure is increased, it is not easy to point out at which pressure the MIT happens from the PDOS plots due to the presence of small broadening from . At = 232K, the MIT seems to happen around 24 GPa, and this pressure does not change as is lowered to 116K.
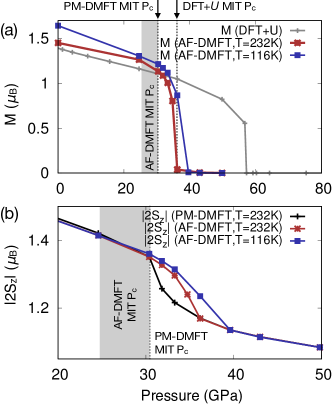
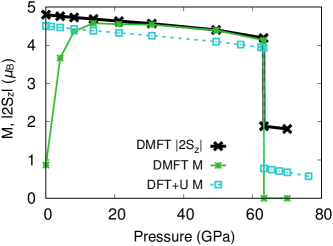
Fig. S13(a) depicts the change of Ni magnetizations from DFT+ and AF-eDMFT as a function of pressure. Note that, the MIT critical pressures are 36 and 24 30 GPa for DFT+ and AF-eDMFT results, as shown in the figure, but the magnetization persists within the metallic phase. The pressure where the magnetism disappears in AF-eDMFT results increases slightly from 36 to 40 GPa as the is reduced from 232K to 116K, but it does not reach 58 GPa where the magnetization disappears in DFT+ results. Note that, the high-pressure anisotropic structural distortion in NiPS3 happens at the pressure where the DFT+ magnetization becomes zero.
Fig. S13(b) shows the change of Ni local spin moment size as a function of pressure. Unlike the in the PM phase, which shows a cusp at the MIT critical pressure, in the AF phases does not show such behavior at the MIT pressure. As the pressure is increased, the AF is suppressed until the magnetization disappears and a PM metallic phase happens. Note that, the pressures that AF joins the PM curve are the points where the magnetization disappears.