| This is a pre-print of an article published in Eur. Phys. J. C (2019) 79: 296. |
| The final authenticated version is available online at: https://doi.org/10.1140/epjc/s10052-019-6797-1 |
Study of the decay in the OKA experiment
The OKA collaboration
M.M. Shapkin, S.A. Akimenko, A.V. Artamonov,
A.M. Blik, V.S. Burtovoy, S.V. Donskov, A.P. Filin, A.V. Inyakin,
A.M. Gorin, G.V. Khaustov, S.A. Kholodenko,
V.N. Kolosov, A.S. Konstantinov, V.F. Kurshetsov, V.A. Lishin, M.V. Medynsky,
Yu.V. Mikhailov, V.F. Obraztsov, V.A. Polyakov, A.V. Popov, V.I. Romanovsky,
V.I. Rykalin, A.S. Sadovsky, V.D. Samoilenko, V.K. Semenov,
O.V. Stenyakin, O.G. Tchikilev, V.A. Uvarov, O.P. Yushchenko
(NRC "Kurchatov Institute"-IHEP, Protvino, Russia),
V.A. Duk111Now at University of Birmingham, Birmingham, United Kingdom,
S.N. Filippov, E.N. Guschin,
A.A. Khudyakov, V.I. Kravtsov,
Yu.G. Kudenko222Also at Moscow Institute of Physics and Technology, Moscow, Russia333Also at NRNU Moscow Engineering Physics Institute (MEPhI), Moscow, Russia,
A.Yu. Polyarush
(INR RAS, Moscow, Russia),
V.N. Bychkov, G.D. Kekelidze, V.M. Lysan, B.Zh. Zalikhanov
(JINR, Dubna, Russia)
Abstract. A high statistics data sample of the decays of mesons to three charged particles was accumulated by the OKA experiment in 2012 and 2013. This allowed to select a clean sample of about 450 events with decays with the energy of the photon in the kaon rest frame greater than 30 MeV. The measured branching fraction of the , with > 30 MeV is . The measured energy spectrum of the decay photon is compared with the prediction of the chiral perturbation theory to O. A search for an up-down asymmetry of the photon with respect to the hadronic system decay plane is also performed.
1 Introduction
The present experimental status of is rather meagre. It was observed in one experiment on statistics of 7 events [1]. The photon energies in these events were low, that did not allow to search for deviations from а simple QED process of photon emission. The measured value of the branching ratio, with is [2]. In the present analysis we have a possibility for more detailed study of this decay using larger data sample collected by the OKA experiment. The appropriate theory framework for such investigation is the chiral perturbation theory [3] (CHPT). To the lowest order in an expansion in momenta and meson masses, the radiative decays are completely determined [4] by the non-radiative amplitude for . At next-to-leading order, a full-fledged CHPT calculation of nonleptonic weak amplitudes of O is required. Such a calculation is done in [5].
2 Separated kaon beam and OKA experiment
The OKA experiment makes use of a secondary hadron beam at the U-70 Proton Synchrotron of NRC "Kurchatov Institute"-IHEP, Protvino, with enhanced fraction of kaons obtained by RF-separation with Panofsky scheme [6]. The OKA setup, Fig. 1, is a double magnetic spectrometer complemented by electromagnetic and hadron calorimeters and a Decay Volume. The first magnetic spectrometer, consisting of the magnet M1 and surrounding 1 mm pitch PC’s (BPC(1Y), BPC(2Y,2X), BPC(3X,3Y), BPC(4X,4Y)) serves for the beam momentum measurement.

It is supplemented by two threshold Cherenkov counters Č1, Č2 for kaon identification and by beam scintillation counters S1, S2, S3, S4. The 11 m long Decay Volume (DV) filled with helium contains 11 rings of guard system (GS). To reinforce GS, a gamma detector (BGD), made of lead glass blocks located behind the DV is used as a veto at large angles, while low angle particles pass through a central opening. The wide aperture spectrometric magnet, SM(SP40A), with a field integral of 1 Tm serves as a spectrometer for the charged decay products together with corresponding tracking chambers: 2 mm PC’s (PC1,…,8), 9 mm diameter straw tubes ST(1,2,3) and 30 mm diameter drift tubes DT1,2. The matrix hodoscope HODO(matrix) is composed of 252 scintillator tiles with WLS+SiPM readout. It is used in the trigger, improves time resolution and links – projections of a track. Two scintillator counters Sbk1, Sbk2 serve to suppress undecayed beam particles. At the end of the OKA setup there are two calorimeters: electromagnetic (GAMS-2000) made of lead glass blocks and a hadron one (HCAL(GDA))- 100 iron-scintillator sandwiches. Finally, four partially overlapping muon counters are located downstream the HCAL. The data acquisition system of the OKA setup [7] operates at 25 kHz event rate with the mean event size of 4 kByte. The detailes of the setup and the beam can be found elswhere [8].
3 The analysis procedure
The study of the decay is performed with the data set accumulated in 2012 and 2013 runs with 17.7 GeV/c beam momentum. Two triggers were used. The first one selects beam kaons decays inside the OKA setup: and, in addition, requires an energy deposition in GAMS-2000 e.m. calorimeter higher than MIP: . The second one, , includes additionally a requirement on multiplicity in the Matrix hodoscope. The beam intensity (SSSS4) was per spill, the fraction of kaons in the beam was 12.5%, i.e. the kaon intensity was 250k/spill. The total number of kaons entering the DV corresponds to . For the estimation of the background contribution to the selected data set, a sample of the Monte Carlo events with six main decay channels of charged kaon ( , , , , , ) mixed accordingly to the branching fractions, with the total statistics about equal to that of the recorded data sample is used. The Monte Carlo events are passed through full OKA simulation and reconstruction procedures. Monte Carlo sample for the signal events is produced in the same way as for the background. As the input, the weight, proportional to the square of the absolute value of the matrix element for the decay , given in [4] is used.
3.1 Event selection
To select decay channel in off-line analysis a set of requirements is applied:
– the momentum of the beam track is required to be measured;
– the number of the secondary charged tracks is required to be equal to three and the net charge of them is equal to +1;
– the decay vertex should have good and should be with a margin incide the DV ;
– the charged tracks are not identified as electrons in the GAMS-2000 electromagnetic calorimeter;
– the missing mass squared to each positive pion should be greater than 0.07 GeV2;
– the event should contain one and only one photon with the energy GeV
– the invariant mass of the photon with each pion ()should be greater than 0.17 GeV ;
– the square of the transverse momentum of the system is less than 0.001 GeV2;
– the ratio of the momentum of the system to the momentum of the beam track should be within the range 0.95-1.05.
The cut on the square of the missing mass to each positive pion is used for the suppression of the background from the decay with .The main source of the background for the decay is the decay of kaon to three charged pions when the pions produce hadron showers in the electromagnetic calorimeter and, because of fluctuations, a part of a shower is not associated with a charged track by the reconstruction program. To suppress such kind of background a cut on is done. The reconstructed momentum of the system should be equal to the momentum of the beam particle. This motivates the last two cuts listed above.
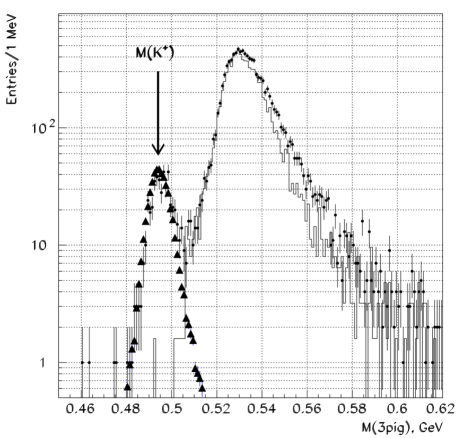
The invariant mass distribution of the system after application of all the cuts listed above is shown in Fig. 2. We see clear separation of the signal, peaking around the nominal value of the kaon PDG [2] mass and the background concentrating at higher masses. The number of events in the signal region is about 450. As almost all the photons in the selected events have the energy in the kaon rest frame greater than 0.03 GeV, in the following analysis we apply an additional explicit cut GeV.
3.2 Measurement of the branching ratio of the decay
The invariant mass distribution of the system in the signal region is shown in Fig. 4. The Monte Carlo distributions for the main sources of the background and the signal events are shown together with the data. We define the mass range of 0.486-0.504 GeV as a signal region. The number of the decays of is determined as the difference of the number of the data events in the signal region and the expected number of events from the background. The expected background contribution to the signal region is determined using Monte Carlo events for six main channels of the kaon decays described in the above section. To determine the branching fraction of the decay we use the decay as the normalization channel. We expect the cancellation of many ambiguities in the ratio of the branching fractions Br()/Br(). The invariant mass spectrum of the system of three charged pions for the same selection criteria as for the charged part of the decay is shown in Fig 4.
![[Uncaptioned image]](/html/1808.09176/assets/x2.png)
![[Uncaptioned image]](/html/1808.09176/assets/x3.png)
![[Uncaptioned image]](/html/1808.09176/assets/x5.png)
![[Uncaptioned image]](/html/1808.09176/assets/x6.png)
The branching fraction of the decay is determined in the following way:
where is the branching fraction of the decay from PDG [2]; and are the reconstruction efficiencies for the decays and , determined from the Monte Carlo; and are the numbers of the decays of and in the data. Efficiencies and , determined from the Monte Carlo, are and , respectively. The obtained result is
The main source of the systematic error is the uncertainty in the estimate of the background contribution to the signal region (see Fig. 2,4). For the estimation of this uncertainty we varied the normalization of the background distribution.The variations are quadratically summed with that due to the changes of the cuts listed in the selection criteria. The estimated value of the systematic uncertainty for the branching fraction is . The final result is
The theory prediction in the framework of the CHPT is [5].
3.3 Measurement of the photon energy spectrum
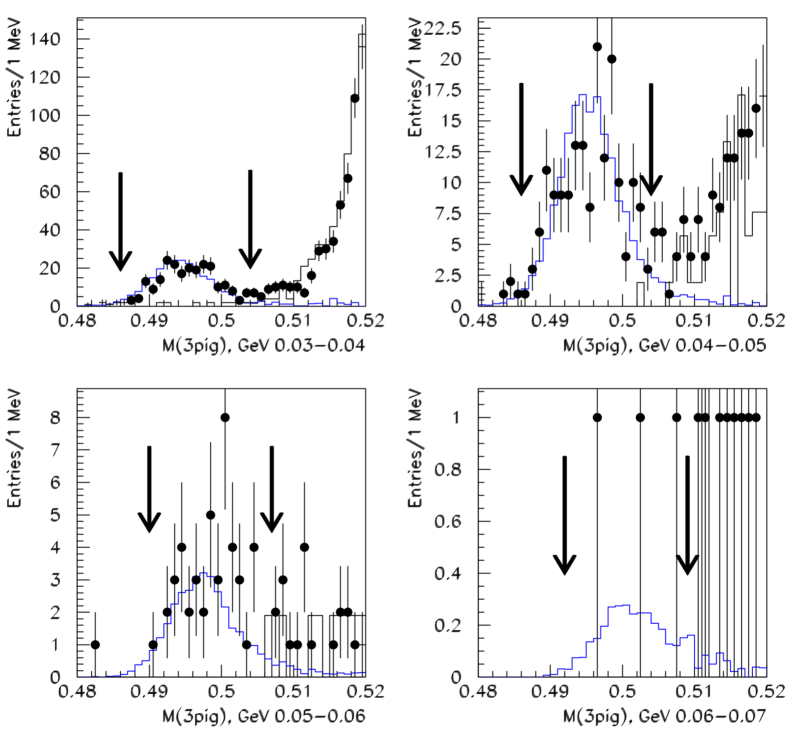
To perform a measurement of the photon energy spectrum, we split the data sample into four parts with photon energies in the rest frame of the kaon lying in the ranges 0.03-0.04, 0.04-0.05, 0.05-0.06 and 0.06-0.07 GeV. After that we apply the procedure of the previous section to each of the four data samples. The invariant mass spectra for the listed above ranges of the photon energy are shown in Fig 5 together with expected signal and background contributions.
The obtained values of the branching fractions for the given energy ranges are listed in the table 1 and shown in the Fig. 7. For comparison, we also give the O CHPT predictions from [5].
| Energy interval (GeV) | Branching fraction(data) | Branching fraction(CHPT [5]) |
|---|---|---|
| 0.03-0.04 | ||
| 0.04-0.05 | ||
| 0.05-0.06 | ||
| 0.06-0.07 |
4 Search for a photon up-down asymmetry
In a decay in the beauty sector the LHCb experiment has found significant up-down asymmetry of the photon with respect to the hadronic system decay plane [9]. This observable was proposed in [10], it is both P and T-odd. We perform an analogous study for the radiative kaon decay to three charged pions and photon to search for a New Physics effects. In Fig 7 we show the distribution of the cosine of the angle of the photon direction with respect to the pion system decay plane:
where is the unit vector of photon direction in the 3-pion rest frame, is the vector product of the momenta of the fastest and slowest pions in the same frame. For comparison, we show the same distribution for the Monte Carlo signal events with the matrix element from [5]. The observed asymmetry in the data
is consistent with zero within statistical error.
Conclusions
The decay is studied on statistics of 450 events. The measured branching fraction is for GeV. The photon energy spectrum for this decay is also determined. The measured branching fraction and the energy spectrum agree well within the errors with the calculations in the framework of the chiral perturbation theory. The measured up-down asymmetry of the photon with respect to the decay plane of the hadronic system is . No sign of P and T-odd effects is observed.
Acknowledgements
We express our gratitude to our colleagues in the accelerator department for the good performance of the U-70 during data taking; to colleagues from the beam department for the stable operation of the 21K beam line, including RF-deflectors, and to colleagues from the engineering physics department for the operation of the cryogenic system of the RF-deflectors.
The work is supported by the Russian Fund for Basic Research, grant N18-02-00179A.
References
- [1] V.V. Barmin et al., Sov. J. Nucl. Phys. 50, 421 (1989).
- [2] C. Patringnani et al. (Particle Data Group), Chin. Phys. C. 40, 100001 (2016).
-
[3]
S. Weinberg, Physica. 96A, 327 (1979);
J. Gasser and H. Leutwyler, Ann. Phys. (N.Y.) 158, 142 (1984); Nucl. Phys. B250, 465 (1985);
H. Leutwyler, Ann. Phys. (N.Y.) 235, 165 (1994). - [4] G. D’Ambrosio, G. Ecker, G. Isidori and H Neufeld, Phys. Lett. B380, 165 (1996).
- [5] G. D’Ambrosio, G. Ecker, G. Isidori and H Neufeld, Z. Phys. C76 Issue 2, 301 (1997).
- [6] V. I. Garkusha et al., IHEP preprint, IHEP 2003-4.
- [7] S. V. Donskov et al., Instrum. Exp. Tech. 59 no.4, 519 (2016).
- [8] A. S. Sadovsky et al., Eur.Phys.J.C(2018) 78:92.
- [9] R. Aaij et al. (LHCb Collaboration), Phys. Rev. Lett. 112, 161801 (2014).
- [10] M. Gronau, Y. Grossman, D. Pirjol and A. Ryd, Phys. Rev. Lett. 88, 051802 (2002).