Synergistic Security for the
Industrial Internet of Things:
Integrating Redundancy, Diversity, and Hardening
Abstract
As the Industrial Internet of Things (IIot) becomes more prevalent in critical application domains, ensuring security and resilience in the face of cyber-attacks is becoming an issue of paramount importance. Cyber-attacks against critical infrastructures, for example, against smart water-distribution and transportation systems, pose serious threats to public health and safety. Owing to the severity of these threats, a variety of security techniques are available. However, no single technique can address the whole spectrum of cyber-attacks that may be launched by a determined and resourceful attacker. In light of this, we consider a multi-pronged approach for designing secure and resilient IIoT systems, which integrates redundancy, diversity, and hardening techniques. We introduce a framework for quantifying cyber-security risks and optimizing IIoT design by determining security investments in redundancy, diversity, and hardening. To demonstrate the applicability of our framework, we present two case studies in water distribution and transportation systems. Our numerical evaluation shows that integrating redundancy, diversity, and hardening can lead to reduced security risk at the same cost.
Published in the proceedings of the 2018 IEEE International Conference on Industrial Internet (ICII).
I Introduction
Emerging industrial platforms such as the Industrial Internet (II) in the US and Industrie 4.0 in Europe are creating novel systems that include the devices, systems, networks, and controls used to operate and/or automate Industrial Internet of Things (IIoT) systems. IIoT systems abound in modern society, and it is not surprising that many of these systems are targets for attacks. Critical infrastructure such as water management and transportation systems, in particular, have been growing more connected following recent advances in co-engineered interacting networks of physical and computational components. Due to the tightly coupled nature between the cyber and physical domains, new attack vectors are emerging. Attacks can include physical destruction, network spoofing, malware, data corruption, malicious insiders, and others. Further, the impacts of attacks propagate because of tight interactions. As IIoT systems become more ubiquitous, the risks posed by cyber-attacks becomes severe. The steady increase in the number of reported cyber-incidents evidences how difficult it is in practice to secure such systems against determined attackers.
A variety of techniques have been proposed for providing resilience against cyber-attacks, ranging from hardening techniques (e.g., address-space layout randomization) to increasing system diversity (e.g., [1]). However, defending complex and large-scale IIoT systems is particularly challenging. These systems often face a variety of threats, have large attack surfaces, and may contain a number of undiscovered vulnerabilities. In light of these factors, it is clear that there is no “silver bullet” technique that could protect a complex system against every kind of attack.
Instead of relying on a single technique, defenders must employ multi-pronged solutions, which combine multiple techniques for improving the security and resilience of IIoT. We can divide many of existing techniques into three canonical approaches:
-
•
Redundancy for deploying additional redundant components in a system, so that even if some components are compromised or impaired, the system may retain normal (or at least adequate) functionality;
-
•
Diversity for implementing components using a diverse set of component types, so that vulnerabilities which are present in only a single type have limited impact on the system; and
-
•
Hardening for reinforcing individual components or component types (e.g., tamper-resistant hardware and firewalls), so that they are harder to compromise or impair.
While it is possible to combine these approaches easily by designing and implementing them independently, security and resilience of IIoT systems can be significantly improved by designing and implementing them in an integrated manner. However, a sound framework and methodology for combining techniques from different approaches is lacking. In lieu of a unified framework or methodology, defenders must follow best practices and intuition when integrating techniques, which can result in the deployment of ineffective—or even vulnerable—combinations.
In this paper, we propose a framework for integrating redundancy, diversity, and hardening techniques for designing secure and resilient IIoT systems. The objective is to develop a systematic framework for prioritizing investments for reducing security risk. The contributions of the paper are as follows:
-
•
Establishing a system model that can capture (1) a wide variety of components that are found in IIoT as well as the interactions between them, (2) a security investment model for redundancy, diversity, and hardening, and (3) a security risk model which quantifies the impact of attacks and defense mechanisms (Section II).
-
•
Formulating the resilient IIoT design problem as an optimization problem for prioritizing security investments and showing that the problem is NP-hard (Section III).
-
•
Developing an efficient meta-heuristic design algorithm based on simulated annealing for finding near-optimal designs in practice (Section III).
- •
We give an overview of related work in Section VI and provide concluding remarks in Section VII.
II Model
An IIoT system is comprised of a variety of components: sensors, controllers, actuators, and human-machine interfaces for interacting with users as shown in Figure 1. Our first step introduces a general system model for evaluating security risk. First, we present a high-level model of IIoT systemts. Then, we introduce a model of security investments in redundancy, diversity, and hardening, and we quantify risks posed by cyber-attacks, considering both probability and impact. Based on this model, we formulate the problem of optimal system design. For a list of symbols used in this paper, see Table I.
| Symbol | Description |
|---|---|
| Constants | |
| set of components | |
| set of connections between components | |
| set of components connecting to component | |
| type of component | |
| set of implementation types | |
| set of implementation types available for component | |
| cost of deploying an instance of implementation type | |
| cost of deploying at least of instance of type | |
| set of hardening levels available for type | |
| probability that hardening level is secure | |
| cost of attaining hardening level | |
| Deployment | |
| set of implementation types deployed for component | |
| hardening level chosen for implementation type | |
II-A System Model
We model the cyber part of the system as a directed graph . The set of nodes represents the components of the system, while the set of directed edges represents connections between the components, which are used to send data and control signals. For each component , we let denote the set of origin components of the incoming edges of component . Further, we let denote the type of component , which is one of the following:
-
•
sensor: components that measure the state of physical processes (e.g., pressure sensors);
-
•
actuator: components that directly affect physical processes (e.g., valves);
-
•
processing: components that process and store data and control signals (e.g., PLCs);
-
•
interface: components that interact with human users (e.g., HMI workstations).
The implementation of each component is chosen from a set of implementation types. We let denote the set of types that may be used to implement component , and we let denote the set of all implementation types that may be used in the system (i.e., ).
II-B Security Investment Model
II-B1 Redundancy
We model redundancy as deploying multiple instances of the same component. For simplicity, we assume that for each component, at most one instance of each suitable implementation type is deployed. 111Note that relaxing this assumption would be straightforward; however, such a generalization would provide little further insight into security. We make this assumption because our goal is to address security risks posed by deliberate attacks, and if a security vulnerability exists in an implementation type, then attackers can typically compromise all instances of that type.
We let denote the set of implementation types that are deployed for component . To quantify the cost of redundancy, we let denote the cost of deploying an instance of type . Then, the total cost of redundancy is
| (1) |
II-B2 Diversity
We model diversity as deploying a diverse set of implementation types. In other words, diversity is modeled as selecting different implementations to be deployed for each component (or at least attempting to use as many distinct sets as possible).
To quantify the cost of diversity, we let denote the cost of using an implementation type in any non-zero number of components (i.e., is the cost incurred when the first instance of type is deployed). Then, the cost of diversity is
| (2) |
II-B3 Hardening
We model the hardening of an implementation type as decreasing the probability that a zero-day security vulnerability is discovered by an attacker. We assume that hardening is applied in steps (e.g., performing a code review), resulting in a discrete set of hardening levels.
We let denote the set of hardening levels available for implementation type , and we let denote the chosen level. To model the amount of security provided by hardening level , we let denote the probability that the implementation type will be secure (i.e, no zero-day vulnerability is discovered) if level is chosen. To quantify the cost of hardening, we let denote the cost of attaining level . Then, the total cost of hardening is
| (3) |
II-C Security Risk Model
Next, we quantify the risks faced by a system with given redundancy, diversity, and hardening design. In principle, risk can be quantified as
| (4) |
In our model, an outcome can be represented as a set of components that have been compromised by an attacker:
| (5) |
where is the amount of loss inflicted on the system by an attacker who has compromised components . In the remainder of this subsection, we discuss how to measure and .
II-C1 Probability
We quantify the probability that an attacker compromises a set of components implicitly by describing a probabilistic process that models how an attacker can take control of the components of a system one-by-one. color=yellow!45, linecolor=black!50]Aron: We could also consider a combination of the two models (e.g., consider the sum risks from both stealthy and non-stealthy attacks). We consider two alternative attack models in our framework: non-stealthy attacks and stealthy attacks. The two attack models are summarized in Table II.
| Attack | Component Type | |||
|---|---|---|---|---|
| Type | sensor | actuator | processing | interface |
| stealthy attack | if all instances are compromised | if all instances are compromised or all input components are compromised | ||
| non-stealthy attack | if majority of instances are compromised | if majority of instances are compromised or majority of input components are compromised | ||
Non-Stealthy Attacks
First, an attacker attempts to find exploitable vulnerabilities in the implementation types that are deployed in the system. Based on our hardening model, the attacker discovers a zero-day vulnerability in each implementation type with probability (independently of the other types). We then consider all instances of the vulnerable implementation types to be compromised, and let denote the set of vulnerable implementations.
Next, we determine the set of compromised components . We start with , and then extend the set in iterations based on the following rules:
-
•
a sensor component is considered to be compromised if the majority of its instances are vulnerable (i.e., if ),
-
•
an actuator, processing, or interface component is considered to be compromised if the majority of its instances are vulnerable or if the majority of its inputs are compromised (i.e., if ).
We repeat the above steps until the set of compromised components cannot be extended any further.
Stealthy Attacks
For stealthy attacks, the process is the same except that “majority” is replaced in both rules with “all” (i.e., and ).
II-C2 Impact
We let denote the financial and physical loss resulting from an attack that compromises and maliciously controls components in . The exact formulation of depends on the system and the characteristics of its physical processes. In this paper, we consider two types of systems, water-distribution and transportation systems, which we will describe in detail in Section IV.
II-D Optimal Design Problem
We first formulate the problem with fixed investments in redundancy, diversity, and hardening.
Definition 1 (Optimal Design Problem (Fixed Redundancy, Diversity, and Hardening)).
Given redundancy, diversity, and hardening investments , , and , an optimal design is
| (6) |
subject to
| (7) | ||||
| (8) | ||||
| (9) | ||||
| (10) | ||||
| (11) |
Next, we introduce a more general formulation, in which we can determine the amounts to invest in redundancy, diversity, and hardening.
Definition 2 (Optimal Design Problem).
Given security budget , an optimal design is
| (12) |
subject to
| (13) | ||||
| (14) | ||||
| (15) |
III Computational Analysis and Meta-Heuristic Algorithms
Since the number of feasible designs to choose from may be very large even for small systems, finding an optimal design using exhaustive search is computationally infeasible. In light of this, a key question for the practical application of the proposed framework is whether there exist efficient algorithms for finding optimal or near-optimal designs. We first show that finding an optimal design is computationally challenging by showing that the problem is NP-hard. Then, we introduce an efficient meta-heuristic algorithm that can find a near-optimal solution in polynomial time.
III-A Computational Complexity
The objective of the design problem depends on the impact function, which could be any function, even one that is hard to compute. To show that the design problem is inherently hard (not only due to the potential complexity of computing the impact function), we consider computational complexity assuming a simplistic impact function, whose value is simply the number of compromised components. Formally, we consider .
To show that the optimal design problem is NP-hard, we first introduce a decision version of the problem.
Definition 3 (Optimal Design Problem (Decision Version)).
We will show that the above problem is NP-hard using a reduction from a well-known NP-hard problem, the Set Cover Problem, which is defined as follows.
Definition 4 (Set Cover Problem).
Given a set , a set of subsets of , and a threshold , find a subset consisting of at most subsets such that covers (i.e., for every , there exists a such that ).
Theorem 1.
The Optimal Design Problem is NP-hard.
Proof:
Given an instance of the Set Cover Problem (SCP), we construct an instance of the Optimal Design Problem (ODP) with stealthy attacks as follows:
-
•
let , , and ,
-
•
for every , let sensor,
-
•
for every , let ,
-
•
for every , let ,
-
•
for every , let ,
-
•
for every , let ,
-
•
let and ,
-
•
let and ,
-
•
let and .
Clearly, the above reduction can be performed in a polynomial number of steps. It remains to show that the constructed instance of the ODP has a solution if and only if the SCP instance has a solution.
First, suppose that the SCP instance has a solution . Then, we show that there exists feasible design that is a solution to the ODP instance. For every component , let . For every implementation type , let if (recall that in the construction of the ODP instance, we let the implementation types correspond to the set of subsets , and the solution is a subset of ) and let if . Clearly, this is a feasible design since its hardening cost is
| (16) | ||||
| (17) | ||||
| (18) |
and all other costs are zero. Since , implementation types from are never vulnerable, and any component that has at least one secure implementation type (i.e., ) is never compromised by a stealthy attack. If is a set cover, then there exists at least one secure implementation type for each such that , which implies that no component will be compromised. Therefore, is the only possible outcome, which implies that as by definition.
Second, suppose that the ODP instance has a solution . Then, we can show that there exists a solution to the SCP instance. Let (i.e., the set of implementation types that are secure). Clearly, is a feasible solution due to the budget constraint. Next, using an argument that is similar to the one that we used in the previous case, we can show that if was not a set cover, then would be greater than zero. The claim of the theorem then follows from this readily. ∎
III-B Meta-Heuristic Design Algorithm
We propose an efficient meta-heuristic algorithm for finding near-optimal designs in practice. Our algorithm is based on simulated annealing, which requires randomly generating feasible solutions that are “neighbors” of (i.e., similar to) a given solution. Unfortunately, in our solution space (i.e., in the set of designs that satisfy the budget constraints), the feasible neighbors of a solution are not naturally defined. Hence, before we present our meta-heuristic algorithm, we first introduce an alternative representation of feasible designs, which we call design plans.
Definition 5 (Design Plan).
A design plan is a pair , where
-
•
is a list of component-implementation pairs such that holds for every pair , and each possible pair appears exactly once in ;
-
•
is an ordered multiset of implementation types such that each implementation type appears exactly times in .
Next, we show how to translate a design plan into a feasible design. The translation is presented formally in Algorithm 1. Given redundancy, diversity, and hardening investments , , and , we can obtain a feasible design as follows: start from an empty design (i.e., no implementations deployed and lowest-cost hardening level chosen for every implementation type); iterate over in order and for each , add to if it does not lead to the violation of the budget constraints; finally, iterate over in order and for each , increase security level if it does not lead to the violation of the budget constraint. Note this mapping is surjective.
Finally, we present our meta-heuristic design algorithm (see Algorithm 2), which can find a near-optimal design in polynomial time. The algorithm starts by choosing a random design plan . In practice, we can implement this simply as choosing a random permutation of the list of component-implementation pairs and a random permutation of the multiset of implementation types. The algorithm then performs a fixed number of iterations, in each iteration choosing a random neighbor of the current plan , and replacing the current plan with the neighbor with some probability. This probability depends on the risk of both the current and the neighboring plan, and decreases with the number of iterations, as we approach the final solution. A key step of the algorithm is , which chooses a random neighbor of . In practice, we implement this as taking two elements of at random and switching them with each other, by similarly switching the order of two random elements of , and returning the re-ordered list and multiset as the neighbor .
IV Evaluation
To demonstrate the applicability of our framework, we present two case studies from two canonical IIoT domains: water distribution and transportation systems.
IV-A Cyber-Physical Contamination Attacks Against Water-Distribution Networks
IIoT systems have a particularly significant and wide application in water distribution systems. Examples include monitoring water quality and detecting leaks. On the one hand, IIoT offers significant advantages, such as improved service and better maintenance at a low cost, but on the other hand, potential challenges include cost of the cyber infrastructure, reliability of communications, and of course, cyber-security.
As evidenced by the recent water crisis in Flint, MI [2], ensuring the quality of drinking water is of critical importance. Compromising systems that control the treatment and distribution of drinking water may allow adversaries to suppress warnings about contaminations or to decrease the quality of water [3]. Cyber-attacks can also have a devastating environmental impact. For example, in 2000, a disgruntled ex-employee launched a series of attacks against the SCADA system controlling sewage equipment in Maroochy Shire, Australia [4, 5]. As a result of these attacks, approximately 800,000 liters of raw sewage spilt out into local parks and rivers, killing marine life.
Here, we apply our framework to model cyber-physical contamination attacks against water-distribution systems. The system is modeled as a graph, in which links represent pipes, and nodes represent junctions of pipes, residential consumers, reservoirs, pumps, etc. IIoT components include:
-
•
Sensors: water-quality sensors, which are located at certain nodes of the water-distribution network;
-
•
Processing: components that collect, process, and forward water-quality data;
-
•
Interfaces: components with human-machine interfaces, which can alert operators about contaminations.
We consider a malicious adversary who tries to cause harm by contaminating the water network with harmful chemicals. We assume that the adversary can introduce contaminants at certain nodes, such as unprotected reservoirs or tanks, which will then spread in the network, eventually reaching the residential consumers. We measure the impact of this physical attack as the amount of contaminants consumed by residential consumers before the detection of the attack.
To detect contaminations, each sensor continuously monitors the water flowing through the node at which it is deployed, and raises an alarm when the concentration of a contaminant reaches a threshold level. The alert generated by a sensor node is sent to a processing node, which forwards the alert to an interface node that can notify operators. Once operators are alerted, they respond immediately by warning residents not to consume water from the network.
We measure the impact of a physical attack as the amount of contaminants consumed by residential consumers before they are warned. This amount depends on the time between the physical attack and its detection, the contaminant concentration levels at the consumer nodes in this time interval, and the amount of water consumed in this interval. Note that this impact depends on the uncompromised components since the time of detection depends on the functionality of these components.
To increase the impact of the physical attack, the adversary launches a cyber-attack, which compromises and disables some of the components . Since the adversary’s goal is to suppress warnings, this attack can be modeled as a stealthy attack (Section II-C1). We assume that the adversary first compromises a set of components , and then decides where to introduce the contaminant, maximizing the impact . Our goal is to minimize the risks posed by such cyber-physical attacks by designing a resilient system based on a systematic allocation of investments to redundancy, diversity, and hardening. We present numerical results for this case study in Section V.
IV-B Cyber-Attacks Against Transportation Networks
Transportation systems is another application domain that can benefit greatly from IIoT by driving down costs and minimizing system failures, while supplying vast amounts of data for operators, drivers, and facilities that result in significant operational improvements. Transportation systems include multiple components that are becoming susceptible to attacks through wireless interfaces or even remote attacks through the Internet [6]. Indeed, recent studies have shown that many traffic lights deployed in practice have easily exploitable vulnerabilities, which could allow an attacker to tamper with the configuration of these devices. Due to hardware-based failsafes, compromising a traffic signal does not allow an attacker to set the signal into an unsafe configuration that could immediately lead to traffic accidents [7]. However, compromising a signal does enable tampering with its schedule, which allows an attacker to cause disastrous traffic congestions.
Here, we apply the proposed framework to model cyber-attacks against traffic control. The physical part of the system may be modeled using a traffic model, such as Daganzo’s well-known cell-transmission model [8]. The cyber-part of the system is compromised of the following components:
-
•
Interface: components with human-machine interfaces, which operators use to control the schedules of traffic lights in the transportation network;
-
•
Processing: components that process and forward control signals sent by operators;
-
•
Actuator: traffic lights with software based controllers.
We consider a malicious adversary who tries to cause damage by compromising some components of the traffic-control system and tampering with the schedules of traffic lights. We measure the impact of this cyber-attack as the increase in traffic congestion, which is quantified as the total travel time of the vehicles in the network, compared to normal congestion without an attack. We assume that the adversary aims to cause maximum damage without attempting to hide its attack. Hence, we model its attack as a non-stealthy attack (Section II-C1).
V Numerical Results
In this section, we present numerical results to evaluate the proposed approach. First, we focus on the evaluation of the approach in terms of reducing the security risks by integrating redundancy, diversity, and hardening. Then, we focus on the performance of the proposed design algorithm in terms of running time.
V-A Case-Study Examples
V-A1 Water Distribution System
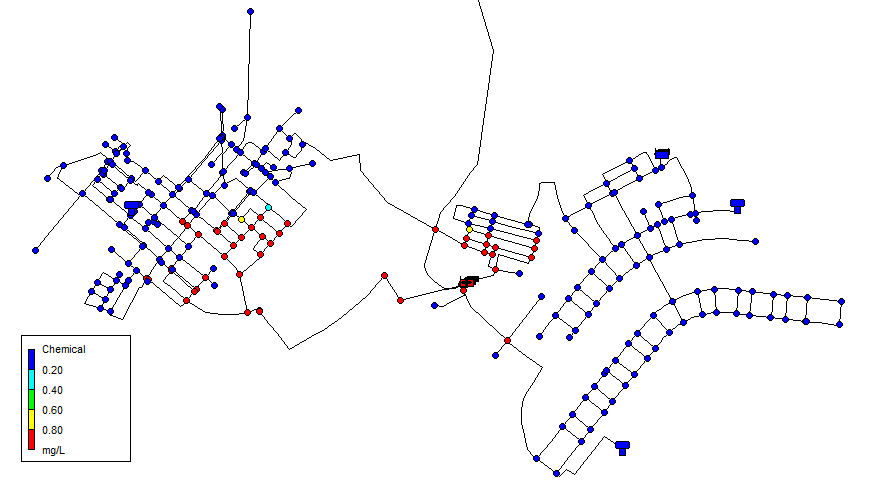
We use a real-world water-distribution network from Kentucky, which we obtained from the Water Distribution System Research Database 222http://www.uky.edu/WDST/database.html[9]. The topology of this network, which is called KY3 in the database, is shown by Figure 2. In addition to topology, the database also contains hourly water-demand values for each network node.
We assume that the adversary can introduce a contaminant at one of six given nodes in the network, which model three tanks and three reservoirs. Once the contaminant is introduced, we simulate its spread throughout the network using EPANET 333https://www.epa.gov/water-research/epanet. From the simulation, we obtain the contaminant concentration values at the various nodes as functions of time. For a given set of compromised components , we then use these values to compute the time of detection and the resulting impact (i.e., amount of contaminant consumed by the time of detection). Finally, we use the following numerical parameter values:
-
•
;
-
•
for every , ;
-
•
444We set these to zero to model existing deployment since we are interested in how to invest in improving security and resilience.and ;
-
•
555We set this to zero so that there always exists a feasible deployment.and for every ;
-
•
for every , ;
-
•
for every , and .
V-A2 Transportation Network
We use the Grid model with Random Edges (GRE) to generate a random network topology [10], which closely resembles real-world transportation networks.666We instantiated the model with , , , and based on [10]. For a detailed description of this model, we refer the reader to [10, 11]. We use Daganzo’s cell transmission model to simulate traffic flowing through the generated network [8], computing the turn decisions of the vehicles based on a linear program that minimizes total travel time [12]. Following Daganzo’s proposition, we model traffic lights as constraints on the inflow proportions [13], and we select the default (i.e., uncompromised) schedules of the traffic lights to minimize congestion. Finally, we allow the attacker to select any valid configuration for compromised lights.
We use the following parameter values for our illustrations:
-
•
;
-
•
for every , ;
-
•
and for every ;
-
•
for every , , , and ;
-
•
for every , and .
V-B Risk Evaluation
Next, we study how security risks depend on investments into redundancy, diversity, and hardening, as well as their optimal combinations.
V-B1 Water-Distribution Network
First, we study risks in the water-distribution network. Figure 3 shows the security risk in the water-distribution network for various budget values invested into the canonical approaches (i.e., redundancy, diversity, or hardening) and their optimal combination. Again, we note the logarithmic scaling on the vertical axis. We see that investing in a combination of redundancy, diversity, and hardening results in significantly lower risks than investing in only one of these approaches, thus demonstrating the efficacy and superior performance of a synergistic approach.
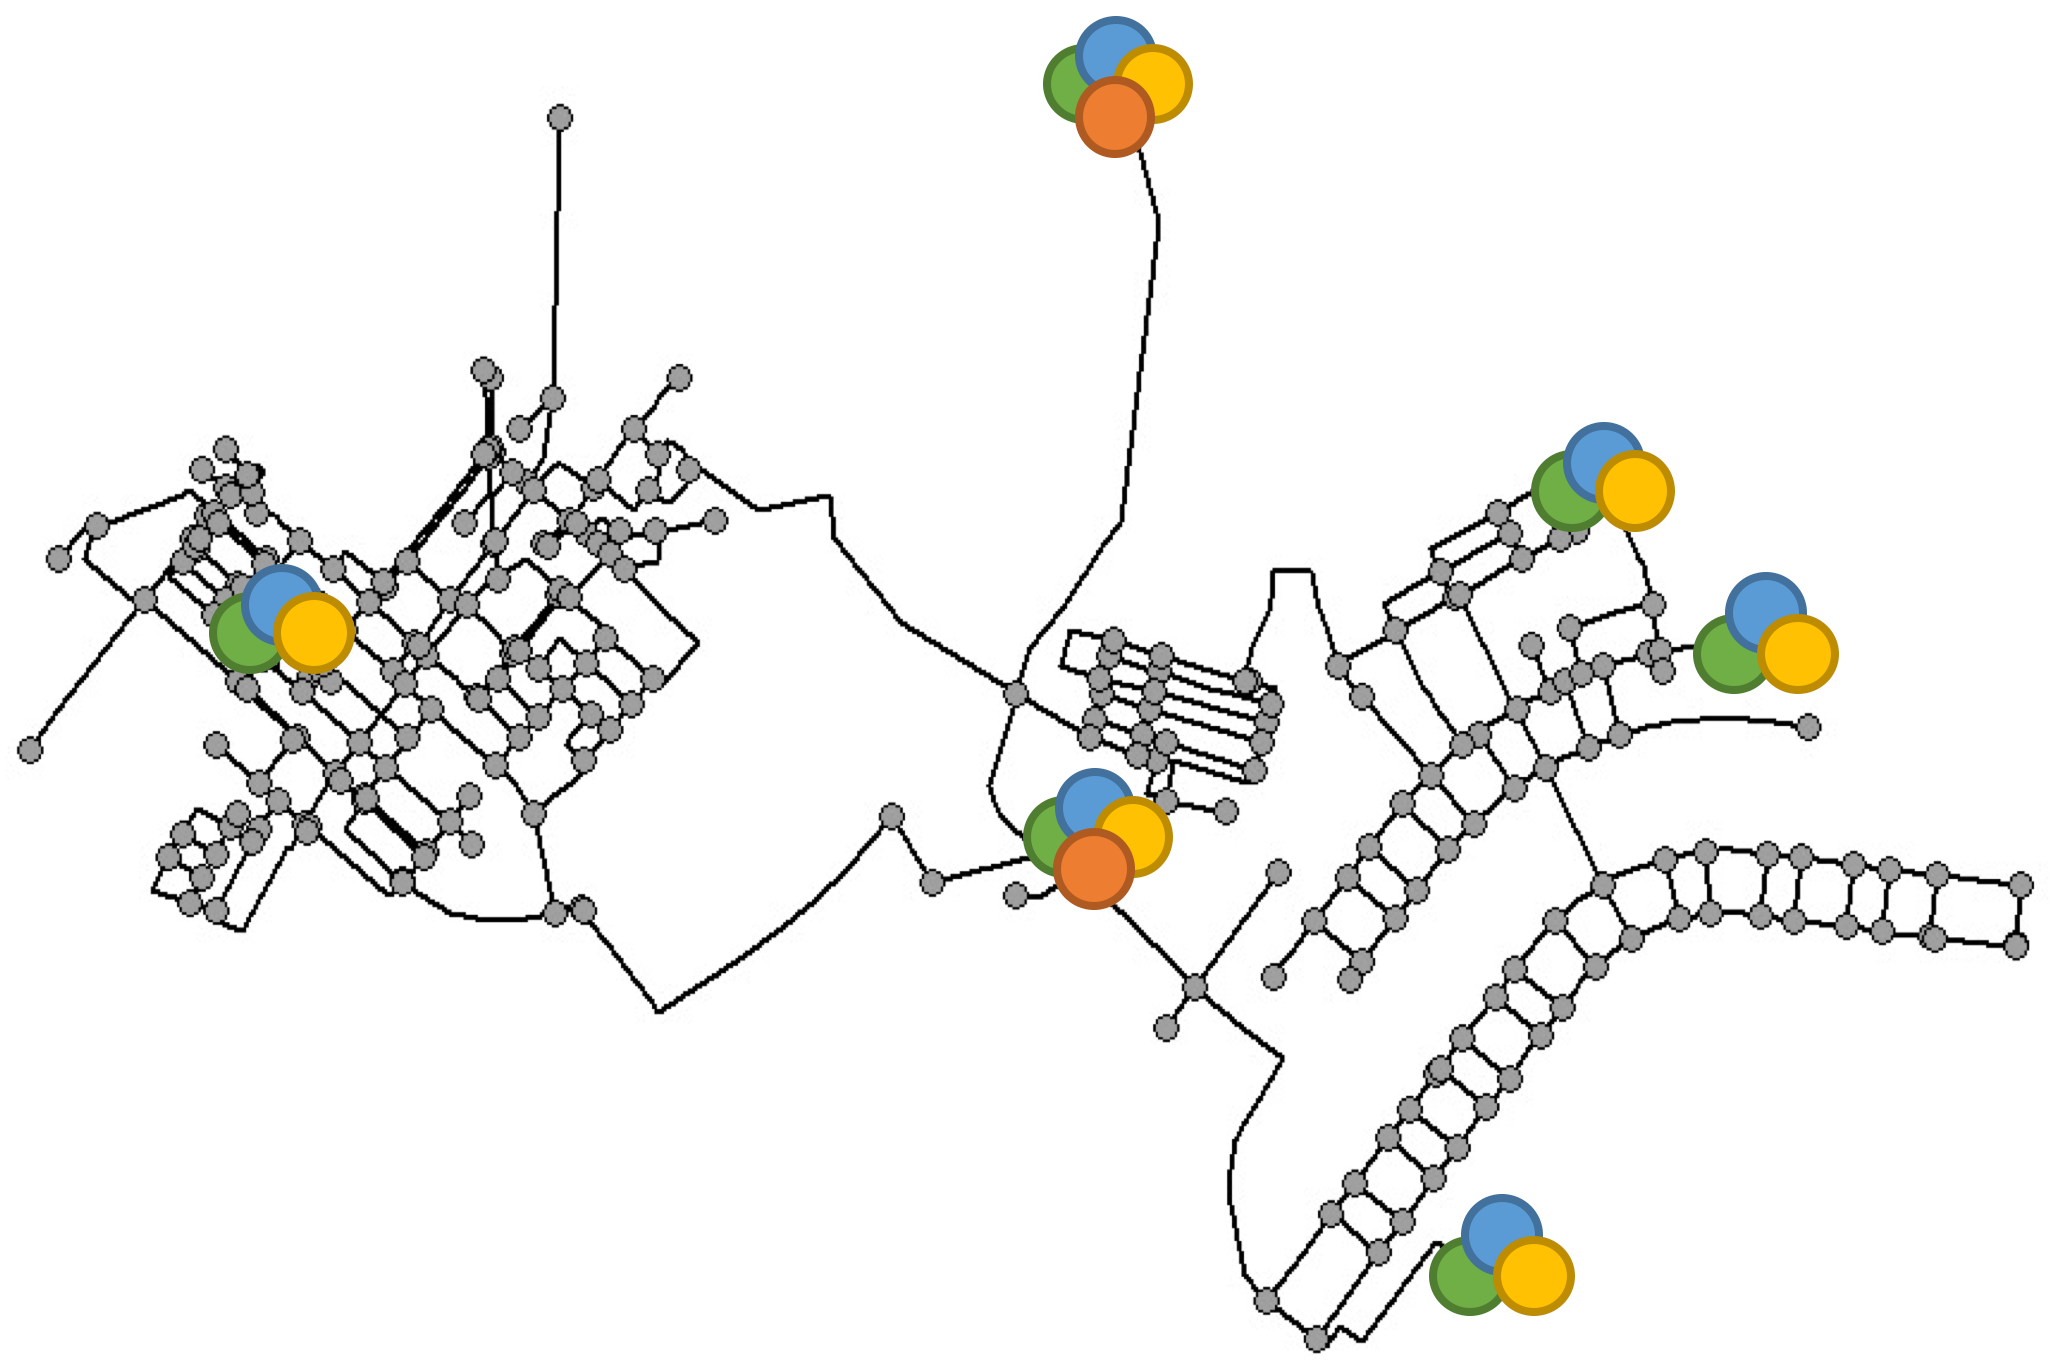
Figure 4 shows the optimal combination of redundancy, diversity, and hardening investments in the water-distribution network for various budget values. In this example, the optimal design is primarily a combination of diversity and hardening. However, with higher budget values, designers also need to invest in redundancy. Note that the design approach also determines the optimal deployment of components. Figure 5 shows the optimal deployment for budget . Colored disks represent component instances, different colors corresponding to different implementations.
V-B2 Transportation Networks
Second, we consider security risks in the transportation network. In this case, we restrict our study to diversity and hardening since deploying multiple instances of a traffic light may be infeasible in practice. Hence, we assume that exactly one instance is deployed for each component.
Figure 6 shows the security risk in the transportation network with the canonical approaches and their combinations for various budget values. The figure shows that—similar to the case of water-distribution networks—the combined approach is clearly superior to canonical approaches.
Figure 7 shows the optimal combination of diversity and redundancy in the transportation network for various budget values. Except for very low values, the optimal combination invests substantial amounts in both diversity and hardening.
V-C Performance
To illustrate the performance of the proposed design algorithm, we use the water-distribution network with and . We find that the meta-heuristic algorithm (Algorithm 2) is very efficient: a single iteration takes less than seconds (more than 1,500 iterations per second) on an average laptop computer777MacBook Pro with 2.9 GHz Intel Core i5 processor.. To determine the number of iterations that are necessary to find a good solution in practice, we focus on the solution quality (i.e., security risk) as a function of the number of iterations.
Figure 8 shows the security risk in each iteration of one particular execution of the meta-heuristic algorithm (Algorithm 2) with the current solution (solid red line) and with the best solution found so far (dashed blue line). Please note the logarithmic scaling on the vertical axis. We have executed the algorithm a number times, but since the results are qualitatively the same, we plot only one particular execution for illustration. The figure shows that risk decreases rapidly in the first few hundred iterations, but after around 400 iterations, the decrease becomes much slower. At around one thousand iterations, the risk reached its lowest value, so we omit the remaining iterations from the plot. In light of this, it is clear that the running time of the meta-heuristic algorithm is very low since it settles in a matter of seconds.
VI Related Work
Modern technology trends such as IIoT and cyber-physical systems (CPS) have significantly improved the overall functionality, reliability, observability, and operational efficiency of industrial control systems and critical infrastructure networks [14, 15]. The integration and connectivity between various system components allow data exchange and information processing to fine tune system processes. However, this integration and connectivity also opens new threat channels in the form of cyber- and cyber-physical attacks, against which these systems need to be secured [16, 17]. Conventional cybersecurity mechanisms are inadequate and thus need to be expanded to incorporate the complexity and physical aspects of such systems [16, 17, 18]. A detailed overview of the security issues in industrial automation systems that are based on open communication systems is provided in [19]. Similarly, security issues associated with various documented standards in SCADA systems are highlighted in [20, 21], and it is concluded that such issues cannot be resolved by employing only IT security mechanisms. There are various other studies that mainly highlight the security threats and associated risk assessment in the domain of industrial IoT, for instance [22, 23, 24, 25, 26]. All of these studies discuss and point towards a holistic security framework to address the security issues in industrial IoT. In this paper, we provide a framework for synergistic security that combines various security mechanisms to effectively secure such systems.
The water-supply industrial sector can benefit significantly from applying the ideas and technology of industrial Internet [27]. An intelligent urban water-supply management system, which consists of IoT gateways connecting the water assets (for instance, water pumps, valves, and tanks) to the cloud service platform for advanced analytics, significantly improves the operational efficiency, safety, and service availability of the overall system [28, 29]. There are ongoing efforts to develop efficient remote monitoring systems for pipeline monitoring (such as PIPENET deployed at Boston Water and Sewer Commission [30, 31]), water quality monitoring [32, 33, 34], leak and burst detection [35, 36], and other applications, for instance [37, 38, 39]. The adoption of new technologies (such as IoT, CPS) and networking devices enhances the monitoring capability, service reliability, and operational efficiency of water distribution systems, but also exposes them to malicious intrusions in the form of cyber- and cyber-physical attacks [3, 40, 41]. A number of attack scenarios against water distributions systems are specified and demonstrated through simulations in [3]. Recently, in [42], several attacks on simulated and a real water distribution testbed (WADI [43]) are demonstrated through cyber-physical botnets capable of performing adversarial control strategies under CPS constraints. The security breach in the SCADA system of Maroochy Water Services, Australia [5] is a famous incident, which also highlights the need for effective security mechanisms. To effectively address the security challenge in such complex, interconnected, and spatially expanded systems, we need to employ a combination of security mechanisms to protect them against cyber-physical attacks.
Like other modern infrastructures, traffic networks are complex and are becoming increasingly connected with traffic lights, road sensors, and vehicles exchanging information with each other. This interconnectedness—though useful at many levels—has also increased the attack surface for potential attackers that can significantly disrupt the traffic by taking control of a few network components, such as signal lights or sensors [6, 7, 44]. Recent studies outline the scope of the damage that can be caused by an adversary having an access to the traffic control infrastructure [45]. There are studies demonstrating attacks that can realize non-existent jams and virtual vehicles, tamper with signal schedules [46, 47, 48, 49]. Considering the impact of successful attacks, it is imperative to systematically understand the existence of vulnerabilities, and design security frameworks to protect traffic infrastructure against such malicious attacks [50, 51].
VII Conclusion
In this paper, we introduced a framework that considers three canonical approaches–redundancy, diversity, and hardening–for improving security and resilience of IIoT systems. Our goal is to provide theoretical foundations for designing systems that combine these canonical approaches. We showed that the problem of finding an optimal design is computationally hard, which means that practical designs may not be found using exhaustive searches. Therefore, we introduced an efficient meta-heuristic algorithm, whose running time is polynomial in the size of the problem instance. To illustrate the practical applicability of our results, we discussed two example application domains, water distribution and transportation systems. Our numerical evaluation shows that integrating redundancy, diversity, and hardening can lead to reduced security risk at the same cost.
References
- [1] A. J. O’Donnell and H. Sethu, “On achieving software diversity for improved network security using distributed coloring algorithms,” in Proceedings of the 11th ACM Conference on Computer and Communications Security (CCS). ACM, 2004, pp. 121–131.
- [2] M. Kennedy, “Lead-laced water in Flint: A step-by-step look at the makings of a crisis,” NPR, http://www.npr.org/sections/thetwo-way/2016/04/20/465545378/, April 2016.
- [3] R. Taormina, S. Galelli, N. O. Tippenhauer, E. Salomons, and A. Ostfeld, “Characterizing cyber-physical attacks on water distribution systems,” Journal of Water Resources Planning and Management, vol. 143, 2017.
- [4] M. Abrams and J. Weiss, “Malicious control system cyber security attack case study – Maroochy Water Services, Australia,” http://csrc.nist.gov/groups/SMA/fisma/ics/documents/Maroochy-Water-Services-Case-Study_report.pdf, July 2008.
- [5] J. Slay and M. Miller, “Lessons learned from the Maroochy water breach,” in Critical Infrastructure Protection, E. Goetz and S. Shenoi, Eds. Springer, 2008, pp. 73–82.
- [6] A. Laszka, B. Potteiger, Y. Vorobeychik, S. Amin, and X. Koutsoukos, “Vulnerability of transportation networks to traffic-signal tampering,” in Proceedings of the 7th International Conference on Cyber-Physical Systems (ICCPS). IEEE Press, 2016, p. 16.
- [7] B. Ghena, W. Beyer, A. Hillaker, J. Pevarnek, and J. A. Halderman, “Green lights forever: Analyzing the security of traffic infrastructure,” in Proceedings of the 8th USENIX Workshop on Offensive Technologies (WOOT), vol. 14, 2014, pp. 1–10.
- [8] C. F. Daganzo, “The cell transmission model: A dynamic representation of highway traffic consistent with the hydrodynamic theory,” Transportation Research Part B: Methodological, vol. 28, no. 4, pp. 269–287, 1994.
- [9] M. D. Jolly, A. D. Lothes, L. Sebastian Bryson, and L. Ormsbee, “Research database of water distribution system models,” Journal of Water Resources Planning and Management, vol. 140, no. 4, 2014.
- [10] W. Peng, G. Dong, K. Yang, J. Su, and J. Wu, “A random road network model for mobility modeling in mobile delay-tolerant networks,” in Proceedings of the 8th International Conference on Mobile Ad-hoc and Sensor Networks (MSN). IEEE, 2012, pp. 140–146.
- [11] W. Peng, G. Dong, K. Yang, and J. Su, “A random road network model and its effects on topological characteristics of mobile delay-tolerant networks,” IEEE Transactions on Mobile Computing, vol. 13, no. 12, pp. 2706–2718, 2014.
- [12] A. K. Ziliaskopoulos, “A linear programming model for the single destination system optimum dynamic traffic assignment problem,” Transportation Science, vol. 34, no. 1, pp. 37–49, 2000.
- [13] C. F. Daganzo, “The cell transmission model, part II: Network traffic,” Transportation Research Part B: Methodological, vol. 29, no. 2, pp. 79–93, 1995.
- [14] J. R. Moyne and D. M. Tilbury, “The emergence of industrial control networks for manufacturing control, diagnostics, and safety data,” Proceedings of the IEEE, vol. 95, no. 1, pp. 29–47, 2007.
- [15] A. W. Colombo, S. Karnouskos, O. Kaynak, Y. Shi, and S. Yin, “Industrial cyberphysical systems: A backbone of the fourth industrial revolution,” IEEE Industrial Electronics Magazine, vol. 11, no. 1, 2017.
- [16] A.-R. Sadeghi, C. Wachsmann, and M. Waidner, “Security and privacy challenges in industrial Internet of Things,” in Proceedings of the 52nd Annual Design Automation Conference. ACM, 2015, p. 54.
- [17] X. Koutsoukos, G. Karsai, A. Laszka, H. Neema, B. Potteiger, P. Volgyesi, Y. Vorobeychik, and J. Sztipanovits, “SURE: A modeling and simulation integration platform for evaluation of secure and resilient cyber–physical systems,” Proceedings of the IEEE, vol. 106, no. 1, pp. 93–112, 2018.
- [18] M. Cheminod, L. Durante, and A. Valenzano, “Review of security issues in industrial networks,” IEEE Transactions on Industrial Informatics, vol. 9, no. 1, pp. 277–293, 2013.
- [19] D. Dzung, M. Naedele, T. P. Von Hoff, and M. Crevatin, “Security for industrial communication systems,” Proceedings of the IEEE, vol. 93, no. 6, pp. 1152–1177, 2005.
- [20] J. Gao, J. Liu, B. Rajan, R. Nori, B. Fu, Y. Xiao, W. Liang, and C. Philip Chen, “SCADA communication and security issues,” Security and Communication Networks, vol. 7, no. 1, pp. 175–194, 2014.
- [21] Y. Cherdantseva, P. Burnap, A. Blyth, P. Eden, K. Jones, H. Soulsby, and K. Stoddart, “A review of cyber security risk assessment methods for SCADA systems,” Computers & Security, vol. 56, pp. 1–27, 2016.
- [22] L. Da Xu, W. He, and S. Li, “Internet of Things in industries: A survey,” IEEE Transactions on Industrial Informatics, vol. 10, no. 4, 2014.
- [23] D. Meltzer, “Securing the industrial Internet of Things,” Information Systems Security Association Journal, pp. 24–30, 2015.
- [24] J. Lee, B. Bagheri, and H.-A. Kao, “A cyber-physical systems architecture for industry 4.0-based manufacturing systems,” Manufacturing Letters, vol. 3, pp. 18–23, 2015.
- [25] Q. Jing, A. V. Vasilakos, J. Wan, J. Lu, and D. Qiu, “Security of the Internet of Things: perspectives and challenges,” Wireless Networks, vol. 20, no. 8, pp. 2481–2501, 2014.
- [26] H. Suo, J. Wan, C. Zou, and J. Liu, “Security in the Internet of Things: a review,” in Procedings of the International Conference on Computer Science and Electronics Engineering (ICCSEE), 2012, pp. 648–651.
- [27] S. Kartakis, “Next generation cyber-physical water distribution systems,” Ph.D. dissertation, Imperial College London, 2016.
- [28] “Intelligent urban water supply testbed,” http://www.iiconsortium.org/intelligent-urban-water-supply.htm, accessed: 2018-04-25.
- [29] Z. Liu and Y. Kleiner, “Computational intelligence for urban infrastructure condition assessment: Water transmission and distribution systems,” IEEE Sensors Journal, vol. 14, no. 12, pp. 4122–4133, 2014.
- [30] I. Stoianov, L. Nachman, S. Madden, T. Tokmouline, and M. Csail, “PIPENET: A wireless sensor network for pipeline monitoring,” in Proceedings of the 6th International Symposium on Information Processing in Sensor Networks (IPSN). IEEE, 2007, pp. 264–273.
- [31] I. Stoianov, L. Nachman, A. Whittle, S. Madden, and R. Kling, “Sensor networks for monitoring water supply and sewer systems: Lessons from Boston,” in Proceedings of the 8th Annual Water Distribution Systems Analysis Symposium (WDSA), 2006, pp. 1–17.
- [32] S. Ali, S. B. Qaisar, H. Saeed, M. F. Khan, M. Naeem, and A. Anpalagan, “Network challenges for cyber physical systems with tiny wireless devices: A case study on reliable pipeline condition monitoring,” Sensors, vol. 15, no. 4, pp. 7172–7205, 2015.
- [33] S. A. McKenna, M. Wilson, and K. A. Klise, “Detecting changes in water quality data,” American Water Works Association Journal, vol. 100, no. 1, p. 74, 2008.
- [34] M. V. Storey, B. Van der Gaag, and B. P. Burns, “Advances in on-line drinking water quality monitoring and early warning systems,” Water Research, vol. 45, no. 2, pp. 741–747, 2011.
- [35] R. Perez, G. Sanz, V. Puig, J. Quevedo, M. A. C. Escofet, F. Nejjari, J. Meseguer, G. Cembrano, J. M. M. Tur, and R. Sarrate, “Leak localization in water networks: a model-based methodology using pressure sensors applied to a real network in Barcelona [applications of control],” IEEE Control Systems, vol. 34, no. 4, pp. 24–36, 2014.
- [36] L. S. Perelman, W. Abbas, X. Koutsoukos, and S. Amin, “Sensor placement for fault location identification in water networks: A minimum test cover approach,” Automatica, vol. 72, pp. 166–176, 2016.
- [37] S. Yoon, W. Ye, J. Heidemann, B. Littlefield, and C. Shahabi, “SWATS: Wireless sensor networks for steamflood and waterflood pipeline monitoring,” IEEE Network, vol. 25, no. 1, 2011.
- [38] M. Torbol, S. Kim, and P. Chou, “Remote structural health monitoring systems for next generation SCADA,” Smart Structures and Systems, vol. 11, 2013.
- [39] G. Suciu, L. Bezdedeanu, A. Vasilescu, and V. Suciu, “Unified intelligent water management using cyberinfrastructures based on cloud computing and IoT,” in Proceedings of the 21st International Conference on Control Systems and Computer Science (CSCS). IEEE, 2017, pp. 606–611.
- [40] L. Perelman and S. Amin, “A network interdiction model for analyzing the vulnerability of water distribution systems,” in Proceedings of the 3rd International Conference on High Confidence Networked Systems. ACM, 2014, pp. 135–144.
- [41] S. Amin, X. Litrico, S. Sastry, and A. M. Bayen, “Cyber security of water SCADA systems—part I: Analysis and experimentation of stealthy deception attacks,” IEEE Transactions on Control Systems Technology, vol. 21, no. 5, pp. 1963–1970, 2013.
- [42] D. Antonioli, G. Bernieri, and N. O. Tippenhauer, “Taking control: Design and implementation of botnets for cyber-physical attacks with cpsbot,” arXiv preprint arXiv:1802.00152, 2018.
- [43] C. M. Ahmed, V. R. Palleti, and A. P. Mathur, “WADI: A water distribution testbed for research in the design of secure cyber physical systems,” in Proceedings of the 3rd International Workshop on Cyber-Physical Systems for Smart Water Networks. ACM, 2017, pp. 25–28.
- [44] M. Ghanavati, A. Chakravarthy, and P. P. Menon, “Analysis of automotive cyber-attacks on highways using partial differential equation models,” IEEE Transactions on Control of Network Systems, 2017.
- [45] J. Reilly, S. Martin, M. Payer, and A. M. Bayen, “Creating complex congestion patterns via multi-objective optimal freeway traffic control with application to cyber-security,” Transportation Research Part B: Methodological, vol. 91, pp. 366–382, 2016.
- [46] T. Jeske, “Floating car data from smartphones: What google and waze know about you and how hackers can control traffic,” Proceedings of BlackHat Europe, pp. 1–12, 2013.
- [47] S. Grad, “Engineers who hacked into LA traffic signal computer, jamming streets, sentenced,” Los Angeles Times, December 2009.
- [48] K. Zetter, “Hackers can mess with traffic lights to jam roads and reroute cars,” WIRED, https://www.wired.com/2014/04/traffic-lights-hacking/, April 2014.
- [49] N. Tufnell, “Students hack Waze, send in army of traffic bots,” WIRED UK, http://www.wired.co.uk/article/waze-hacked-fake-traffic-jam, March 2014.
- [50] J. M. Ernst and A. J. Michaels, “Framework for evaluating the severity of cybervulnerability of a traffic cabinet,” Transportation Research Record: Journal of the Transportation Research Board, no. 2619, pp. 55–63, 2017.
- [51] Y. Feng, S. Huang, Q. A. Chen, H. X. Liu, and Z. M. Mao, “Vulnerability of traffic control system under cyber-attacks using falsified data,” in Annual Meeting of the Transportation Research Board, 2018.