EUROPEAN ORGANIZATION FOR NUCLEAR RESEARCH
CERN-EP-2018-231
August 27, 2018
Measurement of the form factors of
charged kaon semileptonic decays
The NA48/2 Collaboration
Abstract
A measurement of the form factors of charged kaon semileptonic decays is presented, based on () and () decays collected in 2004 by the NA48/2 experiment. The results are obtained with improved precision as compared to earlier measurements. The combination of measurements in the and modes is also presented.
To be submitted for publication to JHEP
The NA48/2 Collaboration
J.R. Batley,
G. Kalmus,
C. Lazzeroni 111Corresponding authors, email: Dmitri.Madigojine@cern.ch, Sergey.Shkarovskiy@cern.ch,222Deceased,
D.J. Munday 111Corresponding authors, email: Dmitri.Madigojine@cern.ch, Sergey.Shkarovskiy@cern.ch,
M.W. Slater 111Corresponding authors, email: Dmitri.Madigojine@cern.ch, Sergey.Shkarovskiy@cern.ch,
S.A. Wotton
Cavendish Laboratory, University of Cambridge, Cambridge, CB3 0HE, UK 333Funded by the UK Particle Physics and Astronomy Research Council, grant PPA/G/O/1999/00559
R. Arcidiacono 444Now at: Università degli Studi del Piemonte Orientale e Sezione dell’INFN di Torino, I-10125 Torino, Italy, G. Bocquet, N. Cabibbo 222Deceased, A. Ceccucci, D. Cundy 555Now at: Istituto di Cosmogeofisica del CNR di Torino, I-10133 Torino, Italy,
V. Falaleev 666Now at: Joint Institute for Nuclear Research, 141980 Dubna (MO), Russia, M. Fidecaro, L. Gatignon, A. Gonidec, W. Kubischta,
A. Maier, A. Norton 777Now at: Dipartimento di Fisica e Scienze della Terra dell’Università e Sezione dell’INFN di Ferrara, I-44122 Ferrara, Italy, M. Patel 888Now at: Department of Physics, Imperial College, London, SW7 2BW, UK, A. Peters
CERN, CH-1211 Genève 23, Switzerland
S. Balev 222Deceased, P.L. Frabetti, E. Gersabeck 999Now at: School of Physics and Astronomy, The University of Manchester, Manchester, M13 9PL, UK, E. Goudzovski 111Corresponding authors, email: Dmitri.Madigojine@cern.ch, Sergey.Shkarovskiy@cern.ch,222Deceased,101010Supported by ERC Starting Grant 336581, P. Hristov 111111Now at: CERN, CH-1211 Genève 23, Switzerland,
V. Kekelidze, V. Kozhuharov 121212Now at: Faculty of Physics, University of Sofia “St. Kl. Ohridski”, BG-1164 Sofia, Bulgaria, funded by the Bulgarian National Science Fund under contract DID02-22,131313Also at: Laboratori Nazionali di Frascati, I-00044 Frascati, Italy, L. Litov 121212Now at: Faculty of Physics, University of Sofia “St. Kl. Ohridski”, BG-1164 Sofia, Bulgaria, funded by the Bulgarian National Science Fund under contract DID02-22, D. Madigozhin 111Corresponding authors, email: Dmitri.Madigojine@cern.ch, Sergey.Shkarovskiy@cern.ch, N. Molokanova,
I. Polenkevich, Yu. Potrebenikov, S. Shkarovskiy 111Corresponding authors, email: Dmitri.Madigojine@cern.ch, Sergey.Shkarovskiy@cern.ch, S. Stoynev 141414Now at: Fermi National Accelerator Laboratory, Batavia, IL 60510, USA, A. Zinchenko 222Deceased
Joint Institute for Nuclear Research, 141980 Dubna (MO), Russia
E. Monnier 151515Now at: Centre de Physique des Particules de Marseille, IN2P3-CNRS, Université de la Méditerranée, F-13288 Marseille, France, E. Swallow 222Deceased, R. Winston 161616Now at: School of Natural Sciences, University of California, Merced, CA 95343, USA
The Enrico Fermi Institute, The University of Chicago,
Chicago, IL 60126, USA
P. Rubin 171717Now at: School of Physics, Astronomy and Computational Sciences, George Mason
University, Fairfax, VA 22030, USA,
A. Walker
Department of Physics and Astronomy, University of Edinburgh, Edinburgh, EH9 3JZ, UK
P. Dalpiaz, C. Damiani, M. Fiorini, M. Martini, F. Petrucci, M. Savrié, M. Scarpa, H. Wahl
Dipartimento di Fisica e Scienze della Terra dell’Università e
Sezione dell’INFN di Ferrara,
I-44122 Ferrara, Italy
W. Baldini, A. Cotta Ramusino, A. Gianoli
Sezione dell’INFN di Ferrara, I-44122 Ferrara, Italy
M. Calvetti, E. Celeghini, E. Iacopini, M. Lenti, G. Ruggiero 181818Now at: Physics Department, University of Lancaster, Lancaster, LA1 4YW, UK
Dipartimento di Fisica dell’Università e Sezione
dell’INFN di Firenze,
I-50125 Sesto Fiorentino, Italy
A. Bizzeti 191919Also at Dipartimento di Scienze Fisiche, Informatiche e Matematiche, Università di Modena e Reggio Emilia, I-41125 Modena, Italy, M. Veltri 202020Also at Istituto di Fisica, Università di Urbino, I-61029 Urbino, Italy
Sezione dell’INFN di Firenze, I-50019 Sesto Fiorentino, Italy
M. Behler, K. Eppard, M. Hita-Hochgesand, K. Kleinknecht, P. Marouelli, L. Masetti,
U. Moosbrugger, C. Morales Morales, B. Renk, M. Wache, R. Wanke, A. Winhart 111Corresponding authors, email: Dmitri.Madigojine@cern.ch, Sergey.Shkarovskiy@cern.ch
Institut für Physik, Universität Mainz, D-55099 Mainz, Germany 212121Funded by the German Federal Minister for Education and research under contract 05HK1UM1/1
D. Coward 222222Now at: SLAC, Stanford University, Menlo Park, CA 94025, USA, A. Dabrowski 111111Now at: CERN, CH-1211 Genève 23, Switzerland, T. Fonseca Martin, M. Shieh, M. Szleper 232323Now at: National Center for Nuclear Research, P-05-400 Świerk, Poland,
M. Velasco, M.D. Wood 222222Now at: SLAC, Stanford University, Menlo Park, CA 94025, USA
Department of Physics and Astronomy, Northwestern
University, Evanston, IL 60208, USA
G. Anzivino,
E. Imbergamo,
A. Nappi 222Deceased,
M. Piccini,
M. Raggi 242424Now at: Università di Roma “La Sapienza”, I-00185 Roma, Italy,
M. Valdata-Nappi
Dipartimento di Fisica dell’Università e Sezione dell’INFN di Perugia, I-06100 Perugia, Italy
P. Cenci, M. Pepe, M.C. Petrucci
Sezione dell’INFN di Perugia, I-06100 Perugia, Italy
F. Costantini, N. Doble, L. Fiorini 252525Now at: Instituto de Física Corpuscular IFIC, Universitat de València, E-46071 València, Spain, S. Giudici, G. Pierazzini 222Deceased, M. Sozzi, S. Venditti
Dipartimento di Fisica dell’Università e Sezione dell’INFN di Pisa, I-56100 Pisa, Italy
G. Collazuol 262626Now at: Dipartimento di Fisica dell’Università e Sezione dell’INFN di Padova, I-35131 Padova, Italy, L. DiLella 272727Now at: Dipartimento di Fisica dell’Università e Sezione dell’INFN di Pisa, I-56100 Pisa, Italy, G. Lamanna 272727Now at: Dipartimento di Fisica dell’Università e Sezione dell’INFN di Pisa, I-56100 Pisa, Italy, I. Mannelli, A. Michetti
Scuola Normale Superiore e Sezione dell’INFN di Pisa, I-56100 Pisa, Italy
C. Cerri, R. Fantechi
Sezione dell’INFN di Pisa, I-56100 Pisa, Italy
B. Bloch-Devaux 282828Now at: Dipartimento di Fisica dell’Università di Torino, I-10125 Torino, Italy, C. Cheshkov 292929Now at: Institut de Physique Nucléaire de Lyon, IN2P3-CNRS, Université Lyon I, F-69622 Villeurbanne, France, J.B. Chèze, M. De Beer, J. Derré,
G. Marel, E. Mazzucato, B. Peyaud, B. Vallage
DSM/IRFU – CEA Saclay, F-91191 Gif-sur-Yvette, France
M. Holder, M. Ziolkowski
Fachbereich Physik, Universität Siegen, D-57068 Siegen, Germany 303030Funded by the German Federal Minister for Research and Technology (BMBF) under contract 056SI74
S. Bifani 111Corresponding authors, email: Dmitri.Madigojine@cern.ch, Sergey.Shkarovskiy@cern.ch, M. Clemencic 111111Now at: CERN, CH-1211 Genève 23, Switzerland, S. Goy Lopez 313131Now at: Centro de Investigaciones Energeticas Medioambientales y Tecnologicas, E-28040 Madrid, Spain
Dipartimento di Fisica dell’Università e
Sezione dell’INFN di Torino,
I-10125 Torino, Italy
C. Biino, N. Cartiglia, F. Marchetto
Sezione dell’INFN di Torino, I-10125 Torino, Italy
H. Dibon, M. Jeitler, M. Markytan, I. Mikulec, G. Neuhofer, L. Widhalm 222Deceased
Österreichische Akademie der Wissenschaften, Institut
für Hochenergiephysik,
A-10560 Wien, Austria 323232Funded by the Austrian Ministry for Traffic and
Research under the contract GZ 616.360/2-IV GZ 616.363/2-VIII, and
by the Fonds für Wissenschaft und Forschung FWF Nr. P08929-PHY
1 Introduction
The NA48/2 experiment at the CERN SPS was designed primarily to search for direct CP violation in decays to three pions [1]. It used simultaneous and beams with momenta of . Data were collected in 2003–2004, providing reconstructed decays. Additionally, a data set was recorded at reduced beam intensity using a minimum bias trigger during a 52-hour long data-taking period in 2004.
The (, with ) decays contribute to the precise determination of the CKM matrix element [2], which requires the knowledge of both branching ratios and form factors (FFs). Measurements of the vector and scalar FFs based on the above minimum bias data set are presented here.
In absence of electromagnetic effects, the differential decay rate is described in the () Dalitz plot as [3]:
| (1) |
where and are the lepton and pion energies in the kaon rest frame; is the 4-momentum transfer to the leptonic system; is a numerical factor; ; and are the charged kaon and neutral pion masses [4]. The kinematic factors are
| (2) | ||||
Here , is the charged lepton mass, and is the neutrino energy in the kaon rest frame. For decays, the factors and , which are proportional to , become negligible and only the vector FF contributes within the experimental precision.
The FF parameterizations considered are described in Table 1. They include a Taylor expansion in the variable [4], where is the charged pion mass, a parameterization assuming vector and scalar pole masses and [5, 6] and a more physical dispersive parameterization [7]. The Taylor expansion is affected by large correlations between the measured parameters. The pole parameterization has a physical interpretation for related to the scattering pole, but not for with no corresponding pole. The dispersive parameterization makes use of general chiral symmetry and analyticity constraints, and external inputs from – scattering data, via the functions and :
| (3) | ||||
with , and the numerical values of the parameters [7]:
| (4) | ||||
| Taylor expansion | ||
|---|---|---|
| Pole | ||
| Dispersive |
2 Beams and detectors
Detailed descriptions of the NA48/2 beam line and detectors are available in Refs. [1, 8]. Two simultaneous charged hadron beams produced by protons impinging on a beryllium target were used. Kaons represented 6% of the total beam flux and the flux ratio was 1.79. Particles of opposite charge with a central momentum of and a momentum band of (RMS) were selected by a system of dipole magnets, focusing quadrupoles, muon sweepers and collimators. The decay volume was contained in a 114 m long vacuum tank with a diameter of 1.92 m for the first 66 m, and 2.40 m downstream. The two beams were superimposed in the decay volume along a common axis which defined the Z axis of the coordinate system. The Y axis pointed vertically up, and the X axis was directed horizontally to form a right-handed system.
Charged particles from decays were measured by a magnetic spectrometer consisting of four drift chambers (DCH1–DCH4) and a dipole magnet between DCH2 and DCH3. Each chamber consisted of four staggered double planes of sense wires measuring the coordinates transverse to the beam axis along the 0∘, 90∘ and 45∘ directions. The spectrometer was located in a tank filled with helium at nearly atmospheric pressure and separated from the vacuum tank by a 0.3% thick Kevlar® window. A 15.8 cm diameter evacuated aluminium tube traversing the centre of the main detectors allowed the undecayed beam particles and the muon halo from beam pion decays to continue their path in vacuum. The spectrometer momentum resolution was , with the momentum expressed in . The spectrometer was followed by a scintillator hodoscope (HOD) consisting of two planes segmented into horizontal and vertical strips and arranged in four quadrants.
A liquid krypton calorimeter (LKr) was used to reconstruct decays and for charged particle identification. It is a 27 thick quasi-homogeneous ionization chamber with an active volume of 7 m3 of liquid krypton, segmented transversally into 13248 cm2 projective cells. It provided an energy resolution , a resolution on the transverse coordinates of an isolated electromagnetic shower cm, and a time resolution ns, with expressed in GeV. A hodoscope (NHOD) consisting of a plane of scintillating fibers, located inside the LKr calorimeter, was used for triggering purposes.
The LKr was followed by a hadronic calorimeter with a total iron thickness of 1.2 m. A muon detector (MUV), located further downstream, consisted of three planes of 2.7 m long and 2 cm thick scintillator strips (28 strips in total) read out by photomultipliers at both ends. Each plane was preceded by a 80 cm thick iron wall. The strips were aligned horizontally in the first and the last planes, and vertically in the second plane.
During the considered data-taking period, events were recorded using a minimum bias trigger condition requiring a coincidence of signals in the two HOD planes in the same quadrant and an energy deposit above 10 GeV in the LKr. The data set is divided into twelve sub-samples according to the polarities of the beam line and spectrometer magnets that interchanged the paths of the positive and negative beams.
3 Monte Carlo simulation
A GEANT3-based [9] Monte Carlo (MC) simulation including beam line, detector geometry and material description is used to evaluate the detector response. The beam simulation is tuned using the kaon momentum and direction distributions as measured from reconstructed decays. MC samples of () decays corresponding to 3 (5) times the data samples have been produced.
The decays are modelled according to [10] including both the Dalitz plot density of Eq. (1) and radiative corrections, with exactly one photon emitted in each decay, and tracked through the detector if its energy in the laboratory frame is above 1 MeV. This approach takes into account the infrared divergence of photon radiation by extending the soft-photon approximation [11] to the whole energy range. The implementation has been validated in [10] using the experimental data available at the time [12, 13]: photon energy and photon-lepton angle distributions have been found to agree with the data within 1–5% systematic uncertainty. However this uncertainty includes the effect of a 100% variation of the vector FF slope. Therefore the distributions considered are not sensitive to the FF description at the level of precision required for the present study.
On the other hand, model-independent (universal) radiative corrections have been proposed in [14]. Using these corrections, the effects of model- and approximation-dependent interplay between QED and QCD are absorbed in the measured effective FFs. These FFs are free from uncertainties due to radiative corrections by construction, and their deviation from FFs defined in absence of electromagnetic interaction can be estimated within the formalism used by [14]. However this approach does not include real photon emission.
In this analysis, the approach of [10] is used, and the Dalitz plot density is corrected by event-by-event weights equal to the ratio of densities obtained within the formulations of [14] and [10]. In the case, the weighting leads to variations as large as 2%. In the case, the weights have been found to be within the required precision. A linear approximation for the vector and scalar FFs is used to generate the simulated samples.
4 Event selection and reconstruction
Charged particles (trajectories and momenta) and LKr energy deposition clusters (energies and positions) are reconstructed as described in [1]. The energy scale correction applied to LKr clusters is established from a study of the energy-to-momentum ratio of reconstructed electrons.
4.1 Neutral pion selection
Photon candidates are defined as LKr clusters satisfying the following requirements: energy above 3 GeV; distances to impact points at the LKr front plane of each in-time (within 10 ns) track larger than 15 cm; distances to other in-time (within 5 ns) clusters larger than 10 cm. In addition, photon candidates are required to be at least 8 cm away from the LKr edges and 2 cm away from each of the 49 inactive cells to reduce the effects of energy losses.
A pair of in-time (within 5 ns) photon candidates is considered as a decay candidate if there are no additional photon candidates within 5 ns of their average time, the distance between them is larger than 20 cm, and the sum of their energies is at least 15 GeV. The latter condition ensures a high trigger efficiency.
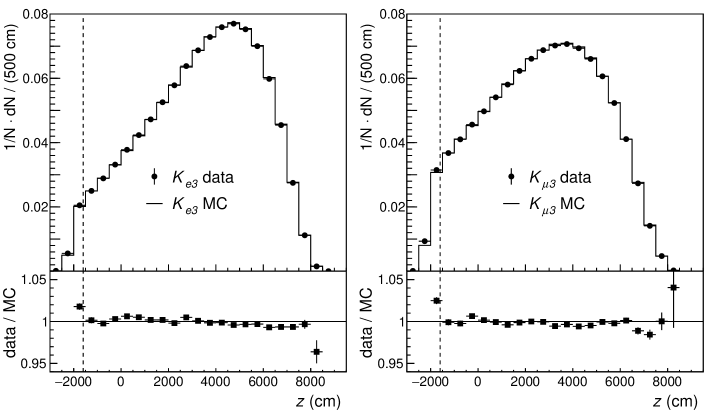
The position of the decay vertex is computed from photon candidate positions and energies assuming the nominal mass [4]. It is required to be at least 2 m downstream of the final beam collimator to suppress production in the material of the collimator (Fig. 1). In addition, photons are required not to intercept DCH beam pipe flanges [15].
4.2 Charged lepton selection
Lepton candidates are defined as reconstructed DCH tracks satisfying the following requirements. Their momentum should be at least 5 (10) for () candidates, the latter ensuring high muon identification efficiency. The distance from the track impact point at the LKr front plane to the closest inactive cell should exceed 2 cm, and the distance to the Z axis in each DCH plane should be at least 15 cm. The track should be in time (within 10 ns) with a candidate, and no additional tracks are allowed within 8 ns of the track.
Tracks with the ratio of LKr energy deposit to momentum in the range are identified as electrons (). Tracks with and associated signals in the first two MUV planes are identified as muons. Extrapolated muon track positions at the first MUV plane are required to be at least 30 (20) cm away from the Z axis (detector outer edges) to reduce geometrical inefficiencies due to multiple scattering in the preceding material.
The decay vertex is defined as follows: its coordinate is that of the decay (Section 4.1), and its transverse coordinates are those of the lepton track at this plane.
4.3 Beam profiles
The specific beam conditions of the data sample triggered further studies of the transverse beam profiles with fully reconstructed decays. These studies showed evidence for a diverging beam component surrounding the core and giving rise to kaon decay vertices a few centimetres off the Z axis. This component, which is likely to arise from quasi-elastic kaon scattering in the beam line, is described using the following variable:
| (5) |
where are the decay vertex coordinates, , are the measured central positions of the beam profiles at the vertex position, and , are their Gaussian widths which decrease from 1 cm at the beginning to 0.6 cm at the end of the decay volume. The beam profile characteristics are obtained from reconstructed decays.
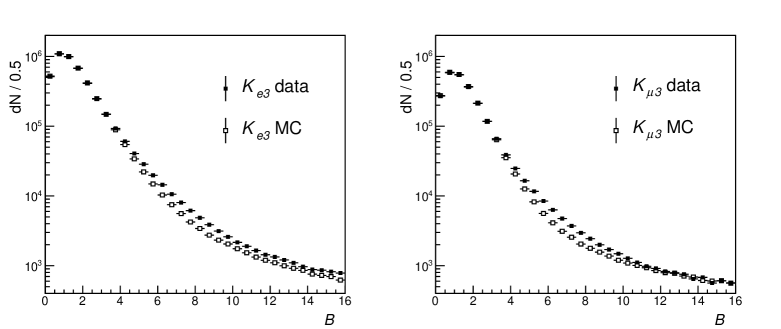
The distributions of data and MC simulated events are shown in Fig. 2. The data distributions are well described by simulation in the core region (), while the diverging beam component in the data, which is not simulated, can be seen at larger values. Quasi-elastic scattering affects marginally the kaon momentum magnitude. Scattered beam kaons are conservatively considered in the analysis by requiring , which minimizes the effect of correlations between kaon directions and momenta. This condition also reduces the background from decays in flight (Section 4.5).
4.4 Kaon and neutrino momenta reconstruction
A more precise estimate of the momentum magnitude () in the laboratory frame than the beam average value is obtained by imposing energy-momentum conservation in the kaon decay under the assumption of a missing neutrino, and fixing the kaon mass to its nominal value and the kaon direction to the measured beam axis direction. This leads to two solutions:
| (6) |
| (7) |
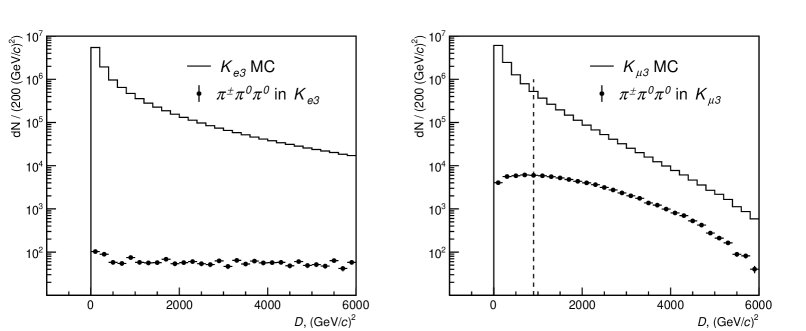
If is negative due to resolution effects, a value is used in the calculation. Here , and are the energy, longitudinal and transverse momentum components (with respect to the beam axis) of the system in the laboratory frame. The distributions of the variable for MC simulated events are shown in Fig. 3. The solution that is closer to the average beam momentum (measured from decays) is chosen, and required to satisfy .
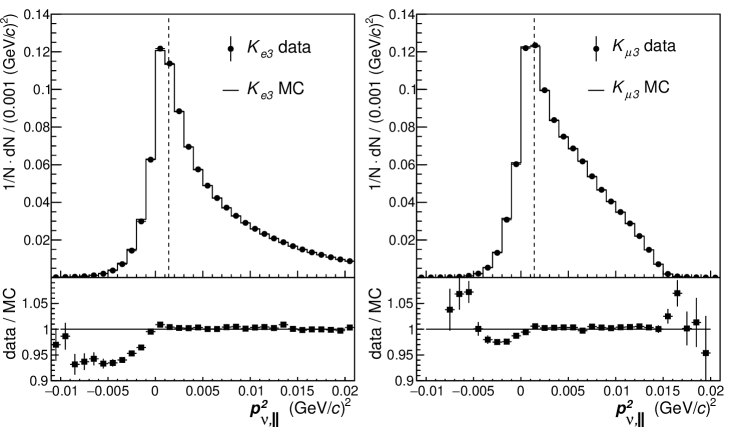
Distributions of the squared neutrino longitudinal momentum in the kaon rest frame, , where is the system energy in the kaon rest frame, are shown in Fig. 4. The simulated spectra are sensitive to details of the beam geometry description at small values, and negative values originate from resolution effects. To ensure good agreement of data and simulation, it is required that (corresponding to ) which rejects 29% of the events in both decay modes.
4.5 Background suppression
The decays contribute to the background if one of the mesons is not detected, and the either decays or is misidentified. This background affects mainly the sample, and is reduced by requiring in this case, as illustrated in Fig. 3.
The background in the sample arising from misidentification is characterized by small total transverse momentum and is reduced by requiring , taking into account resolution and beam divergence effects.
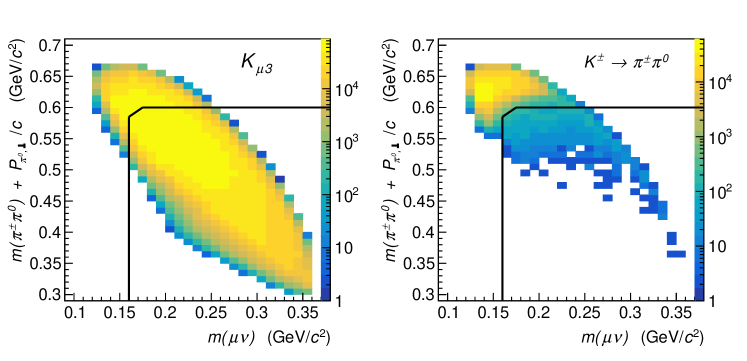
The background to decays arises from misidentification and decay. The former process is suppressed by requiring the mass, reconstructed in the mass hypothesis for the lepton candidate, to be , which is below the mass considering the resolution of . The latter process is suppressed by requiring the reconstructed invariant mass to be , which is above the mass considering the resolution of . Additionally, it is required that , where is the transverse momentum component with respect to the beam axis. The selection conditions, illustrated in Fig. 5, lead to 17% signal loss and reject 99.5% of the background.
Other background sources considered are followed by ; ; ; . The background to decays arising from muon decay in flight is also considered. All these backgrounds are found to be negligible. The main background sources are summarized in Table 2.
| Process | [] | [] |
|---|---|---|
| 0.286(6) | 2.192(32) | |
| 0.271(6) | 0.392(10) |
5 Form factor measurement
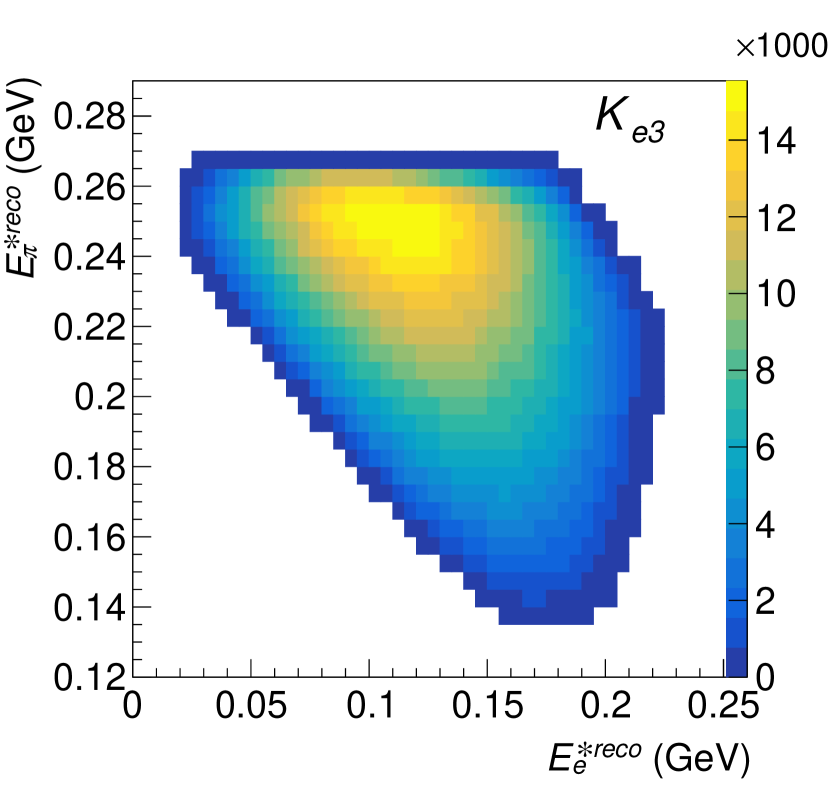
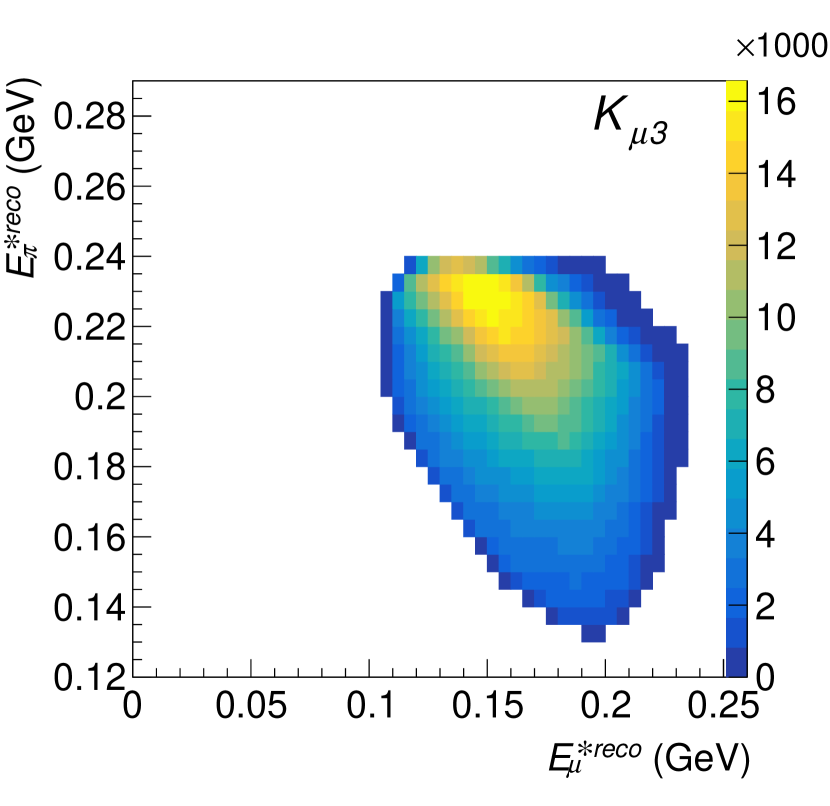
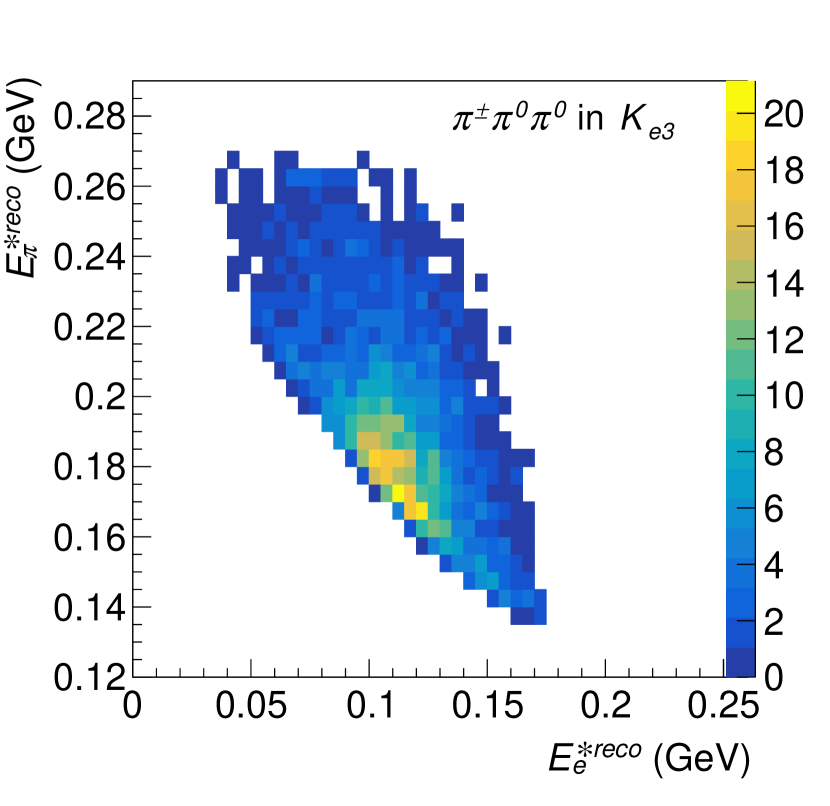
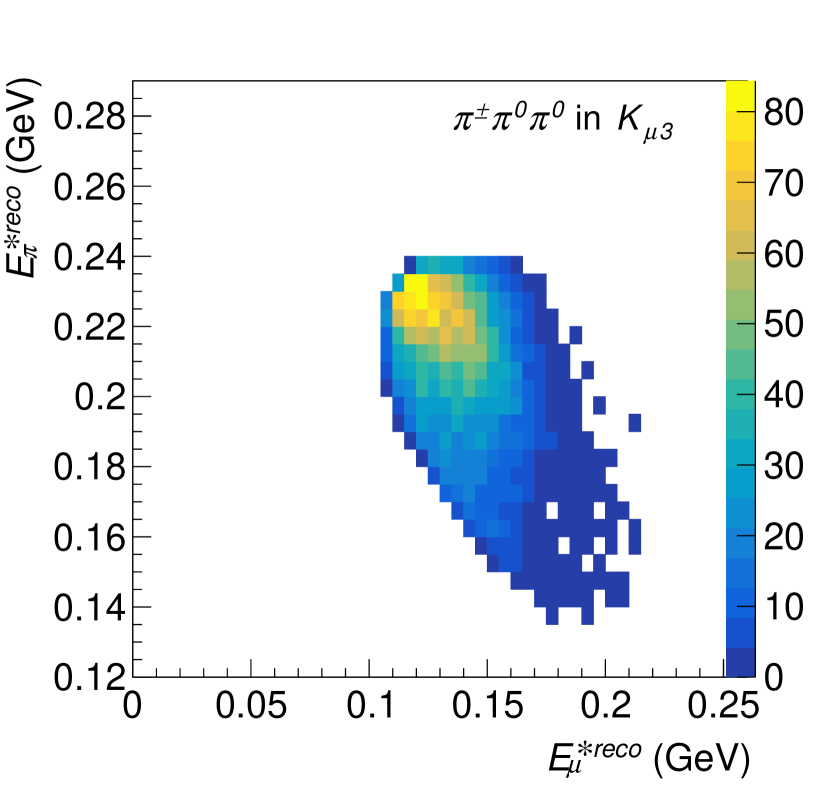
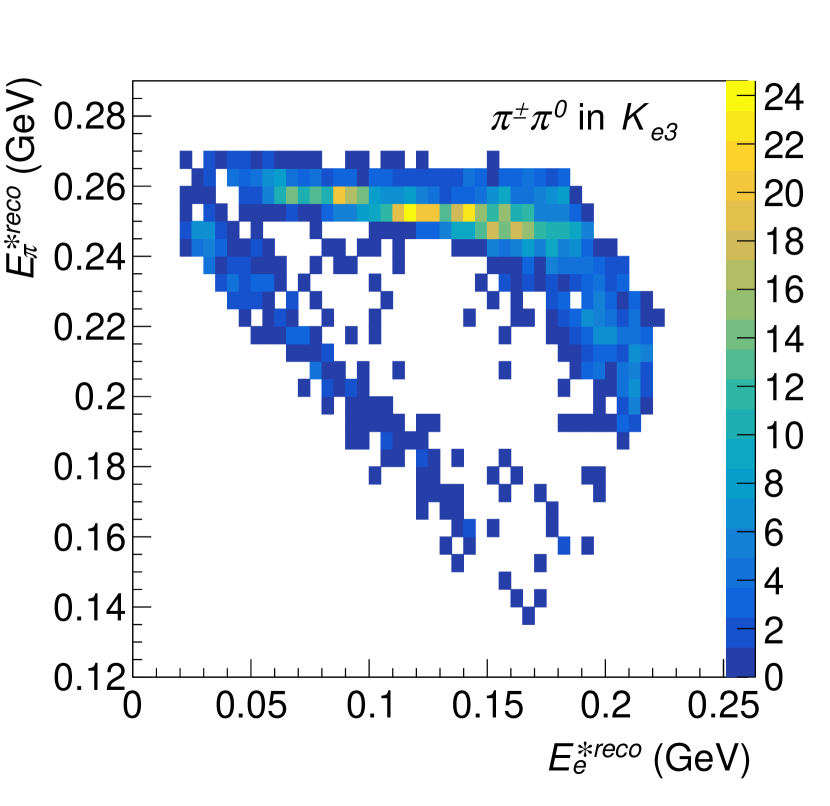
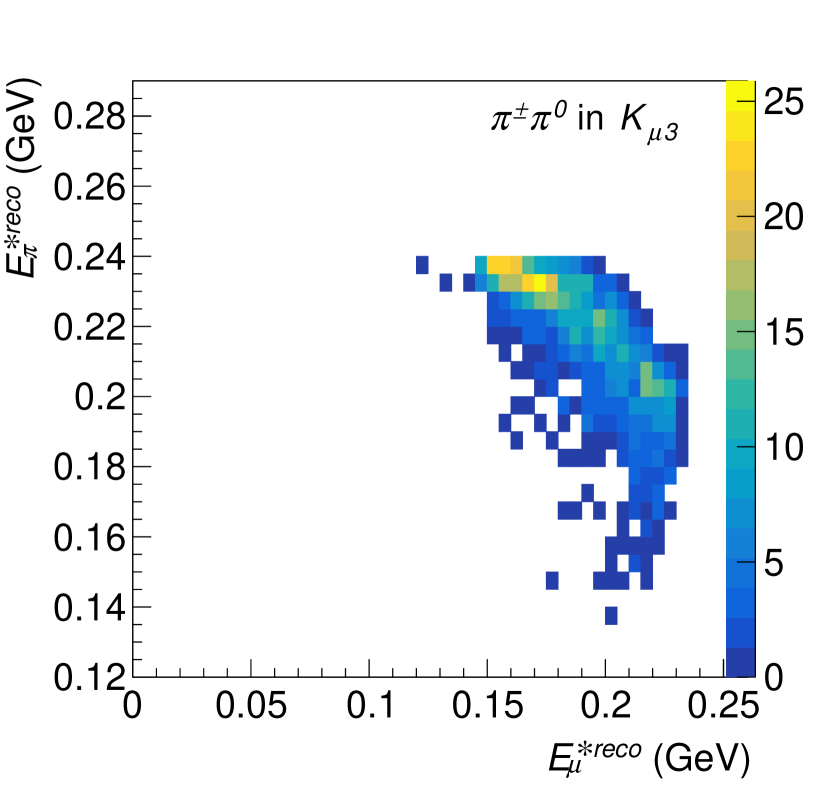
In total, reconstructed () candidates are selected from the data sample. The Dalitz plot distributions, as defined in Eq. (1) and based on reconstructed energies, are shown in Fig. 6 for the data and the main simulated backgrounds.
The FF parameters are measured independently for each of the two decay modes. A joint analysis is also performed by fitting simultaneously the two Dalitz plots with a common set of FF parameters. A set of FF parameters in each parameterization is measured by minimizing an estimator
| (8) |
where the sum runs over all 5 5 MeV2 Dalitz plot cells which have their centres inside the kinematically allowed region of non-radiative events and contain at least 20 reconstructed data events. Here is the population in cell of the reconstructed data Dalitz plot; and are the expected signal and background populations estimated from simulations; , and are the corresponding statistical errors; is a normalization factor that guarantees that the simulated sample is normalized to the data sample.
The quantities are obtained at each iteration by applying a weight to each simulated signal event, equal to the ratio of the Dalitz plot density corresponding to the parameter set and the generated Dalitz plot density. This approach accounts for the universal radiative corrections described in Section 3. The -dependence of the background contribution arises from the dependence of the signal acceptances on the FFs.
6 Systematic uncertainties
The following sources of systematic uncertainties are considered. The resulting error estimates are assumed to be uncorrelated.
6.1 Experimental systematic uncertainties
Beam modelling
The diverging beam component which is not simulated (Section 4.3) gives rise to one of the largest systematic effects. This effect is evaluated by adding specific samples of events, generated according to the measured transverse beam profile, to the simulated signal samples, improving the Data/MC agreement of the spectra. The imperfect simulation of the kaon beam spectrum leads to variations of the Data/MC ratio of reconstructed momentum spectra as a function of momentum within a few percent. The corresponding systematic effect on the FF measurement is evaluated by assigning momentum-dependent weights to the simulated events. To evaluate the sensitivity of the results to the beam average momentum value used in the selection (Section 4.4), which is reproduced by the MC simulation to a precision of 0.03 , the analysis is repeated with the value shifted conservatively by .
LKr energy scale and non-linearity
The reconstruction is sensitive to the LKr energy scale and non-linearities. The systematic uncertainty on the energy scale is 0.1% (correlated between data and simulated samples) while the energy scale difference between data and simulation is known to 0.03% precision. The systematic uncertainties on the FF measurement are estimated by varying the energy scale corrections within their uncertainties. Cluster energies below 10 GeV are affected by non-linearities in the energy scale. This is corrected for, and the residual systematic effects are estimated by variation of the correction method as detailed in [15].
Residual background
Systematic uncertainties on the background estimates are evaluated by studying the level of Data/MC agreement in background-enhanced control regions defined as for the selection, and (corresponding to off-axis decay vertices, see Section 4.3) for the selection. The uncertainties assigned to background contributions are and . They are propagated to the results, together with those listed in Table 2.
Particle identification
Electron identification efficiency is determined by the lower condition. Using an almost background-free data sample selected kinematically, the efficiency has been measured as a function of momentum to increase from 98% at 5 to 99.6% above . Efficiency measurements for data and simulated samples agree to better than 0.2%. Systematic uncertainties due to electron identification are evaluated by weighting MC events to correct for the residual Data/MC disagreement. Muon identification inefficiency for decays is reduced to the 0.1% level, without dependence on the kinematic variables, by the minimum muon momentum and MUV geometrical acceptance requirements. The corresponding systematic effect on the FF measurement is negligible.
Event pileup
Pileup of signal events with independent kaon decays is not described by the simulation. Effects of pileup are estimated by doubling the size of the maximum allowed time difference between the accepted photon candidates, and between the accepted lepton and candidates. The shifts in the results are considered as systematic uncertainties.
Acceptance
The Data/MC ratios of the decay vertex position distributions (Fig. 1) reflect the quality of the acceptance simulation. To account for the residual variation of these ratios, the transverse cuts in DCH, LKr and MUV detector planes are widened by a factor of 1.002 in the selection for the simulated samples. The resulting variations of the FF parameters are considered as systematic uncertainties.
Neutrino momentum resolution
The cut on the squared longitudinal neutrino momentum is applied in the core region of the distribution (Fig. 4). A mismatch in resolution between data and simulation can therefore bias the results. Introducing an additional smearing for the simulated events, that is increasing the deviation of the reconstructed from its true value by 1.5%, leads to an improvement of the Data/MC agreement near the peak of the distribution. The resulting variations are taken as corresponding systematic uncertainties
Trigger efficiency
The trigger is based on uncorrelated HOD and LKr information (Section 2). Within the selection, the HOD trigger efficiency is measured to be 0.9973(2) using a control sample triggered by the NHOD, while the LKr trigger efficiency is measured to be 0.9987(1) using a control sample triggered by the HOD. The total trigger efficiency is obtained as the product of these two components. No statistically significant variations of the trigger efficiencies with the Dalitz plot variables are observed. Each efficiency component is measured as a function of and variables and parameterized with second order polynomial functions. The statistical uncertainties on the parameters of these functions are propagated to the FF measurements, and the resulting variations considered as systematic uncertainties.
Dalitz plot binning and resolution
The fit has been repeated with a Dalitz plot cell size reduced from 5 5 to 2.5 2.5 . The resulting FF parameter variations stay within the statistical errors. However they are considered as systematic uncertainties to account for a possible imperfect description of the Dalitz plot density by the parameterizations. To address the resolution effects, the FF measurement has been repeated using a different method, performing a fit of the acceptance-corrected Dalitz plot by the density function (1). Unlike the primary fit method, this procedure introduces a bias to the results due to Dalitz plot resolution effects. This bias is estimated by performing the same fit procedure for simulated signal samples with known input FF parameters replacing the data. The differences of the fit results between the two methods, corrected for the bias, are considered as systematic uncertainties.
6.2 External sources of systematics effects
Radiative corrections
The FF parameters measured using the universal radiative corrections [14] are not affected by theoretical uncertainties by construction. Nevertheless, for comparison with other measurements and calculations, the FF fits have also been performed using radiative corrections computed within the ChPT approximation [14]. The differences between the two sets of results are quoted as external uncertainties.
External inputs
The uncertainties on the numerical inputs to the dispersive parameterization (3) are propagated to the FF fit results under the assumption that they are not correlated.
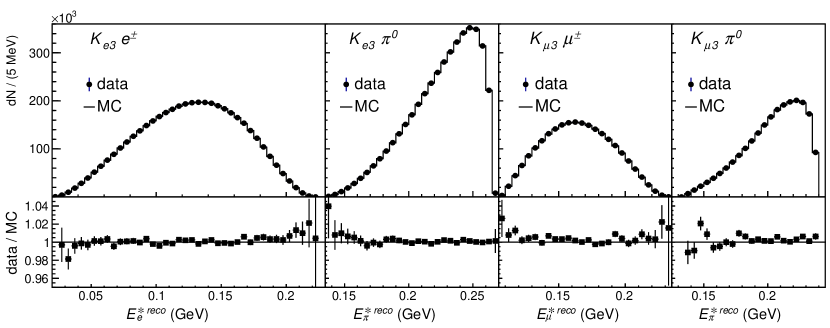
7 Results
Lepton and pion energy projections of the reconstructed Dalitz plots for the data and the simulated samples corresponding to the fit results, along with their ratios Data/MC, are shown in Fig. 7. The fit results are listed in Tables 3, 4 and 5 for , and the joint analysis, respectively. The fit quality is satisfactory in all cases, as quantified by the values. The quoted correlation coefficients are derived from sums of the covariance matrices of the statistical and the systematic uncertainties. Form factor measurements from and decays are in agreement.
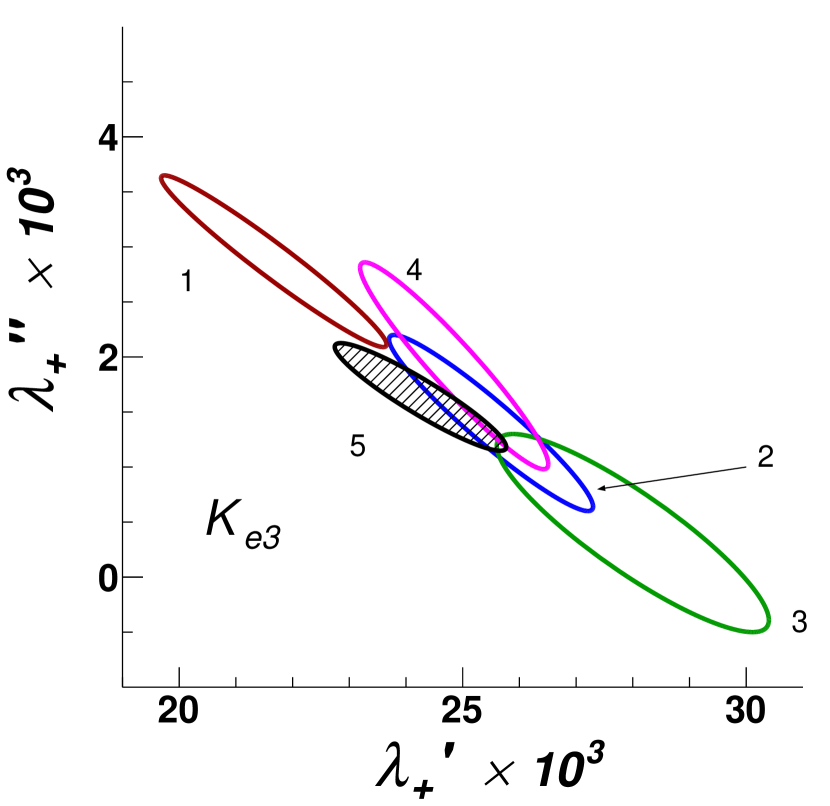
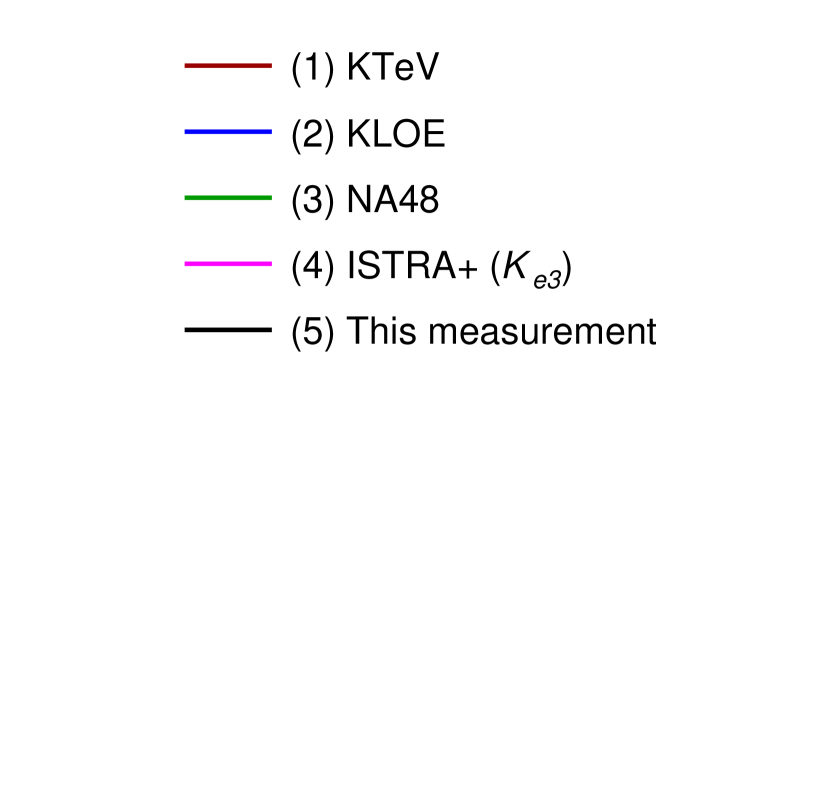
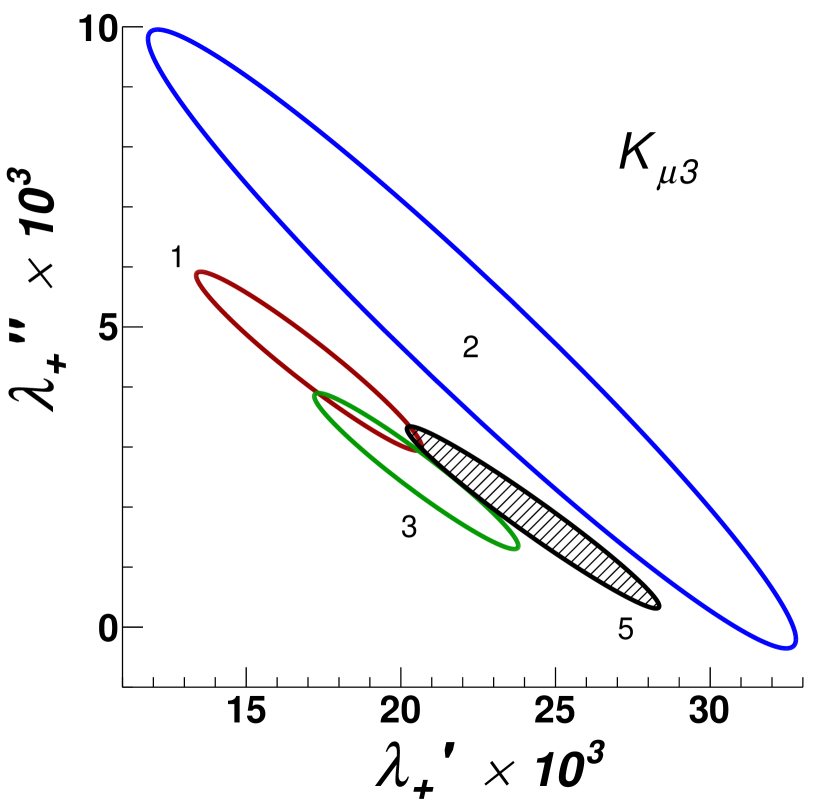
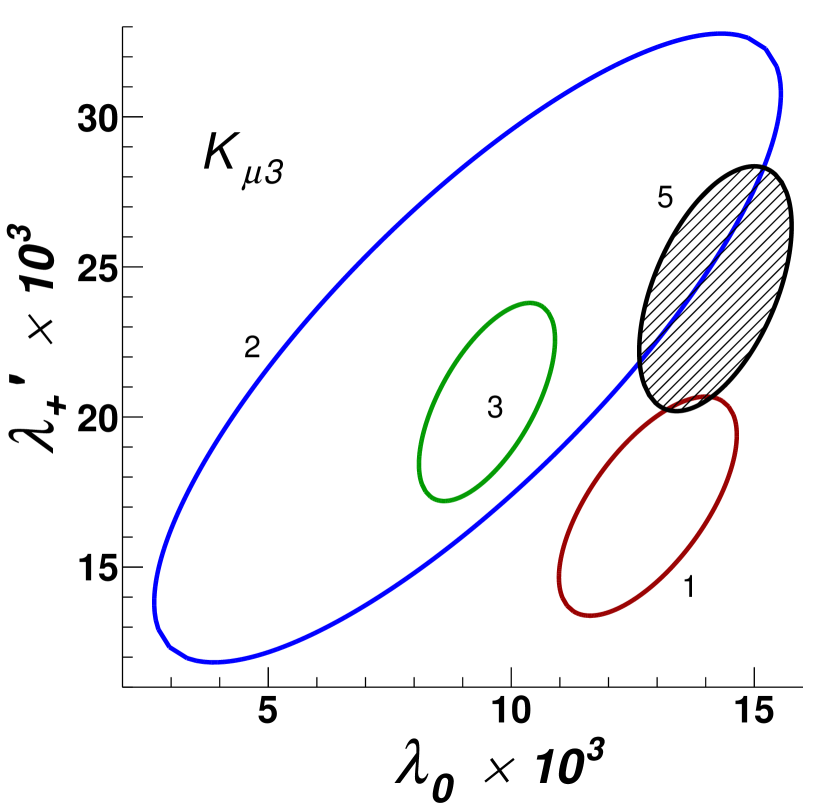
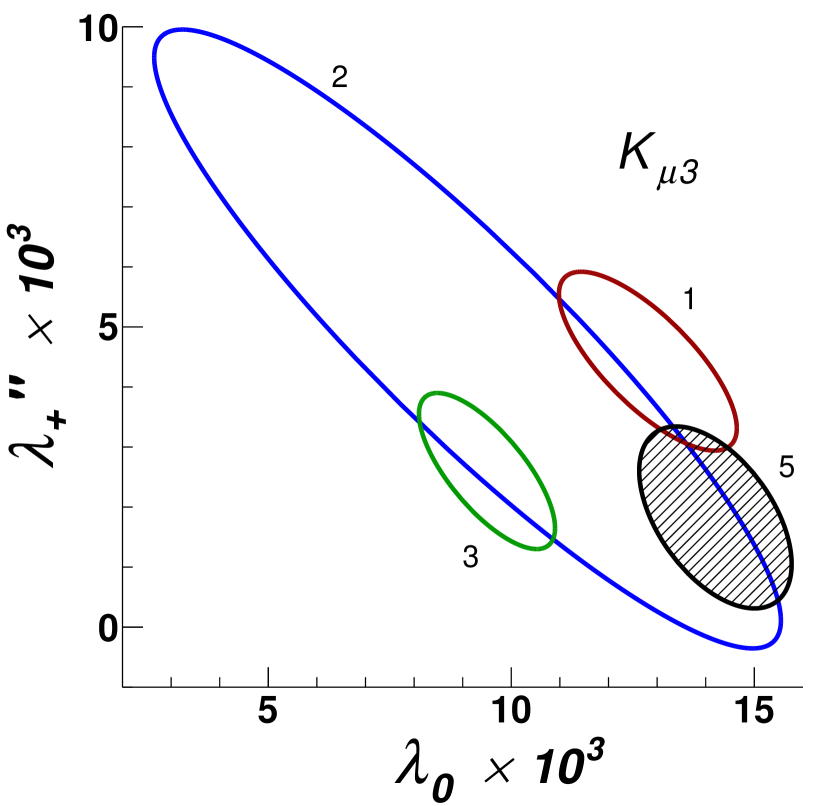
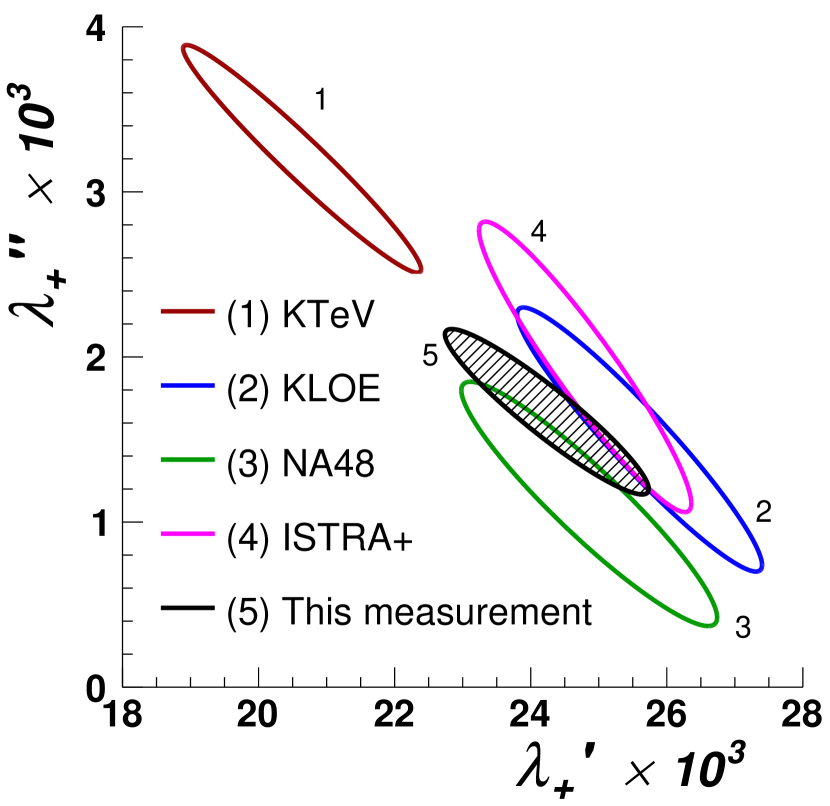
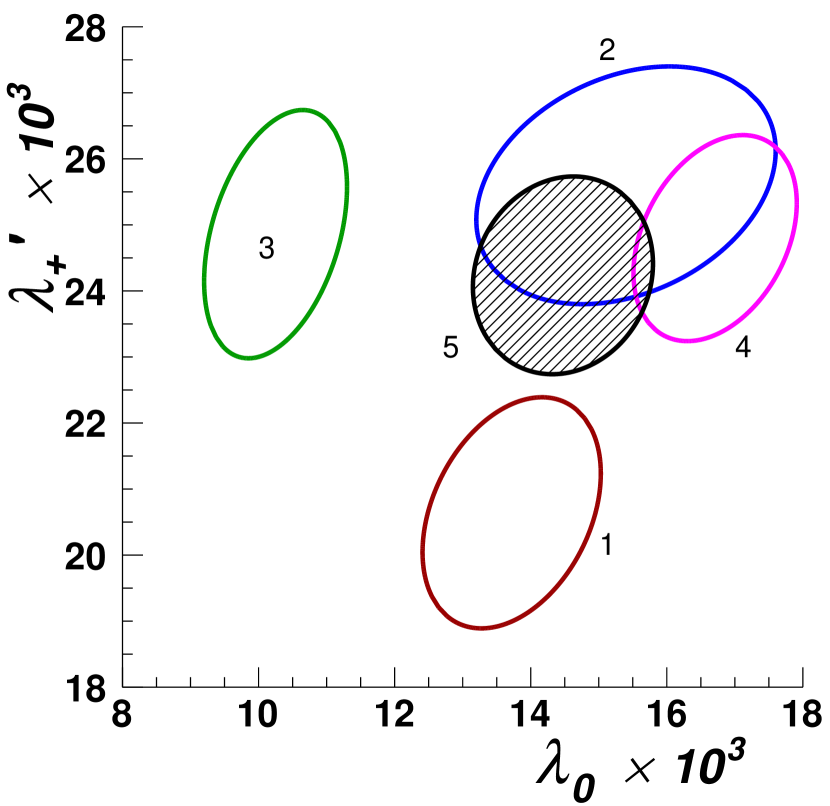
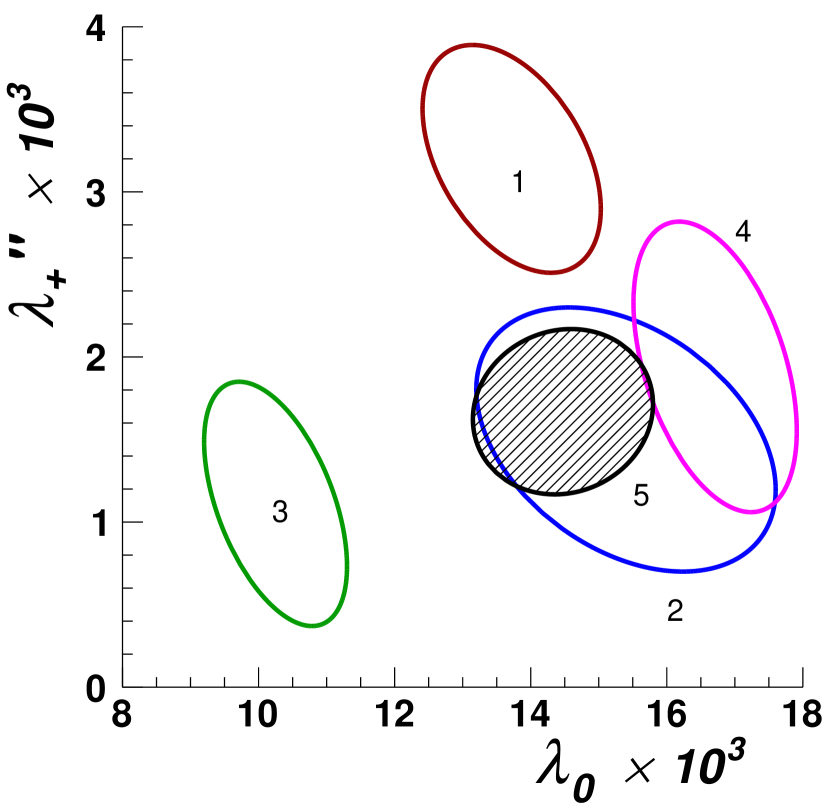
The results of the present analysis for the Taylor expansion parameterization, together with the earlier results from KTeV [16], KLOE [17, 18], NA48 [19, 20], and ISTRA+ [21, 22] experiments, as reviewed in [2], are shown in Fig. 8, 9. The present results are in agreement with the previous measurements and have similar or better precision.
| Central values | 24.26 | 1.64 | 885.2 | 24.94 |
| Statistical error | 0.78 | 0.30 | 3.3 | 0.21 |
| Diverging beam component | 0.89 | 0.31 | 1.4 | 0.10 |
| Kaon momentum spectrum | 0.00 | 0.00 | 0.1 | 0.01 |
| Kaon mean momentum | 0.03 | 0.01 | 0.1 | 0.01 |
| LKr energy scale | 0.69 | 0.14 | 5.0 | 0.33 |
| LKr non-linearity | 0.28 | 0.01 | 3.4 | 0.22 |
| Residual background | 0.08 | 0.04 | 0.4 | 0.02 |
| Electron identification | 0.02 | 0.01 | 0.2 | 0.01 |
| Event pileup | 0.24 | 0.08 | 0.5 | 0.03 |
| Acceptance | 0.29 | 0.08 | 1.2 | 0.08 |
| Neutrino momentum resolution | 0.18 | 0.04 | 1.1 | 0.07 |
| Trigger efficiency | 0.33 | 0.13 | 1.0 | 0.07 |
| Dalitz plot binning | 0.07 | 0.01 | 0.7 | 0.05 |
| Dalitz plot resolution | 0.06 | 0.04 | 0.4 | 0.02 |
| Radiative corrections | 0.20 | 0.01 | 2.9 | 0.19 |
| External inputs | 0.44 | |||
| Systematic error | 1.30 | 0.39 | 7.2 | 0.64 |
| Total error | 1.51 | 0.49 | 7.9 | 0.67 |
| Correlation coefficient | — | — | ||
| /NDF | 569.1/687 | 568.9/688 | 569.0/688 | |
| Central values | 24.27 | 1.83 | 14.20 | 878.4 | 1214.8 | 25.36 | 182.17 |
|---|---|---|---|---|---|---|---|
| Statistical error | 2.88 | 1.05 | 1.14 | 8.8 | 23.5 | 0.58 | 6.31 |
| Diverging beam component | 2.03 | 0.78 | 0.13 | 0.9 | 30.9 | 0.04 | 8.98 |
| Kaon momentum spectrum | 0.08 | 0.02 | 0.00 | 0.1 | 0.9 | 0.01 | 0.24 |
| Kaon mean momentum | 0.06 | 0.00 | 0.06 | 0.8 | 2.4 | 0.06 | 0.63 |
| LKr energy scale | 0.31 | 0.01 | 0.53 | 4.5 | 19.4 | 0.30 | 5.55 |
| LKr non-linearity | 0.93 | 0.38 | 0.25 | 1.3 | 21.7 | 0.08 | 6.26 |
| Residual background | 0.13 | 0.00 | 0.02 | 1.7 | 1.3 | 0.11 | 0.31 |
| Event pileup | 0.04 | 0.01 | 0.03 | 0.0 | 0.7 | 0.00 | 0.18 |
| Acceptance | 0.70 | 0.18 | 0.18 | 2.9 | 0.3 | 0.20 | 0.14 |
| Neutrino momentum resolution | 0.09 | 0.03 | 0.08 | 0.2 | 2.1 | 0.01 | 0.59 |
| Trigger efficiency | 0.60 | 0.08 | 0.23 | 5.1 | 5.7 | 0.35 | 1.72 |
| Dalitz plot binning | 1.50 | 0.63 | 0.63 | 2.8 | 3.6 | 0.18 | 0.85 |
| Dalitz plot resolution | 0.04 | 0.01 | 0.02 | 0.1 | 0.4 | 0.01 | 0.18 |
| Radiative corrections | 0.32 | 0.10 | 0.54 | 0.7 | 23.7 | 0.04 | 6.73 |
| External inputs | 0.46 | 2.87 | |||||
| Systematic error | 2.89 | 1.09 | 1.07 | 8.3 | 49.2 | 0.72 | 14.45 |
| Total error | 4.08 | 1.52 | 1.57 | 12.1 | 54.5 | 0.92 | 15.76 |
| Correlation coefficients | () | ||||||
| () | |||||||
| () | |||||||
| /NDF | 409.9/381 | 409.9/382 | 410.3/382 | ||||
| Central values | 24.24 | 1.67 | 14.47 | 884.4 | 1208.3 | 24.99 | 183.65 |
|---|---|---|---|---|---|---|---|
| Statistical error | 0.75 | 0.29 | 0.63 | 3.1 | 21.2 | 0.20 | 5.92 |
| Diverging beam component | 0.97 | 0.35 | 0.55 | 1.1 | 32.2 | 0.08 | 9.43 |
| Kaon momentum spectrum | 0.00 | 0.00 | 0.02 | 0.1 | 0.7 | 0.00 | 0.19 |
| Kaon mean momentum | 0.04 | 0.01 | 0.04 | 0.2 | 1.7 | 0.01 | 0.47 |
| LKr energy scale | 0.66 | 0.12 | 0.61 | 4.9 | 17.4 | 0.32 | 5.16 |
| LKr non-linearity | 0.20 | 0.01 | 0.55 | 3.1 | 19.6 | 0.20 | 5.77 |
| Residual background | 0.08 | 0.03 | 0.04 | 0.1 | 0.7 | 0.01 | 0.16 |
| Electron identification | 0.01 | 0.01 | 0.01 | 0.2 | 0.2 | 0.01 | 0.05 |
| Event pileup | 0.23 | 0.08 | 0.08 | 0.4 | 0.2 | 0.03 | 0.07 |
| Acceptance | 0.23 | 0.07 | 0.03 | 0.7 | 4.3 | 0.05 | 1.11 |
| Neutrino momentum resolution | 0.16 | 0.04 | 0.04 | 0.9 | 3.3 | 0.06 | 0.88 |
| Trigger efficiency | 0.29 | 0.13 | 0.20 | 1.1 | 9.9 | 0.07 | 2.82 |
| Dalitz plot binning | 0.05 | 0.04 | 0.06 | 0.9 | 1.1 | 0.06 | 0.29 |
| Dalitz plot resolution | 0.02 | 0.01 | 0.03 | 0.0 | 1.3 | 0.00 | 0.39 |
| Radiative corrections | 0.17 | 0.01 | 0.57 | 2.5 | 20.1 | 0.16 | 5.92 |
| External inputs | 0.44 | 2.94 | |||||
| Systematic error | 1.30 | 0.41 | 1.17 | 6.7 | 47.5 | 0.62 | 14.25 |
| Total error | 1.50 | 0.50 | 1.32 | 7.4 | 52.1 | 0.65 | 15.43 |
| Correlation coefficient | () | ||||||
| () | |||||||
| () | |||||||
| /NDF | 979.6/1070 | 979.3/1071 | 979.7/1071 | ||||
Acknowledgements
We gratefully acknowledge the CERN SPS accelerator and beam line staff for the excellent performance of the beam and the technical staff of the participating institutes for their efforts in the maintenance and operation of the detector, and data processing. We are grateful to Matthew Moulson for useful discussions.
References
- [1] J.R. Batley et al. (NA48/2 Collaboration), Eur. Phys. J. C (2007) 875.
- [2] M. Antonelli et al. (FlaviaNet Working Group on Kaon Decays), Eur. Phys. J. C (2010) 399.
- [3] L.M. Chounet, J.-M. Gaillard, M.-K. Gaillard, Phys. Rept. (1972) 199.
- [4] M. Tanabashi et al. (Particle Data Group), Phys. Rev. D (2018) 030001.
- [5] P. Dennery, H. Primakoff, Phys. Rev. (1963) 1334.
- [6] P. Lichard, Phys. Rev. D (1997) 5385.
- [7] V. Bernard, M. Oertel, E. Passemar, J. Stern, Phys. Rev. D (2009) 034034.
- [8] V. Fanti et al. (NA48 Collaboration), Nucl. Instrum. Methods A (2007) 443.
- [9] GEANT detector description and simulation tool, CERN program library long writeup W, CERN, Geneva, Switzerland (1994).
- [10] C. Gatti, Eur. Phys. J. C (2006) 417.
- [11] S. Weinberg, Phys. Rev. (1965) B516.
- [12] T. Alexopoulos et al. (KTEV Collaboration), Phys. Rev. D (2005) 012001.
- [13] A. Lai et al. (NA48 Collaboration), Phys. Lett. B (2005) 247.
- [14] V. Cirigliano, M. Knecht, H. Neufeld, H. Rupertsberger, P. Talavera, Eur. Phys. J. C (2002) 121.
- [15] J.R. Batley et al. (NA48/2 Collaboration), Eur. Phys. J. C (2009) 589.
- [16] T. Alexopoulos et al. (KTeV Collaboration), Phys. Rev. D (2004) 092007.
- [17] F. Ambrosino et al. (KLOE Collaboration), Phys. Lett. B (2006) 166.
- [18] F. Ambrosino et al. (KLOE Collaboration), JHEP (2007) 105.
- [19] A. Lai et al. (NA48 Collaboration), Phys. Lett. B (2004) 1.
- [20] A. Lai et al. (NA48 Collaboration), Phys. Lett. B (2007) 341.
- [21] O. Yushchenko et al., (ISTRA+ Collaboration), Phys. Lett. B (2004) 31.
- [22] O. Yushchenko et al., (ISTRA+ Collaboration), Phys. Lett. B (2004) 111.