Stellar 36,38ArAr reactions and their effect on light neutron-rich nuclide synthesis
Abstract
The 36ArAr ( = 35 d) and 38ArAr (269 y) reactions were studied for the first time with a quasi-Maxwellian ( keV) neutron flux for Maxwellian Average Cross Section (MACS) measurements at stellar energies. Gas samples were irradiated at the high-intensity Soreq applied research accelerator facility-liquid-lithium target neutron source and the 37Ar/36Ar and 39Ar/38Ar ratios in the activated samples were determined by accelerator mass spectrometry at the ATLAS facility (Argonne National Laboratory). The 37Ar activity was also measured by low-level counting at the University of Bern. Experimental MACS of 36Ar and 38Ar, corrected to the standard 30 keV thermal energy, are 1.9(3) mb and 1.3(2) mb, respectively, differing from the theoretical and evaluated values published to date by up to an order of magnitude. The neutron capture cross sections of 36,38Ar are relevant to the stellar nucleosynthesis of light neutron-rich nuclides; the two experimental values are shown to affect the calculated mass fraction of nuclides in the region A=36-48 during the weak -process. The new production cross sections have implications also for the use of 37Ar and 39Ar as environmental tracers in the atmosphere and hydrosphere.
The argon isotopes 36Ar and 38Ar are among the rare stable nuclides for which no experimental neutron-capture cross sections exist above thermal energy. While the abundances of 36,38Ar in terrestrial atmospheric argon are very low relative to 40Ar (produced mainly from 40K decay von ; Anders ), 36Ar (84.59%) and 38Ar (15.38%) are the major argon isotopes in the solar system Lodders and likely so in stellar matter. They are expected, together with the branching point 39Ar, to play a role in nucleosynthesis of light neutron-rich nuclei (e.g. 36S, 40Ar, 40K), believed to be produced during the weak -process phase of stellar evolution Hoffman ; Reifarth . The 40K (=1.248(3) Gy 40K ) nuclide, in particular, is an important cosmo- or geochronometer and was used to estimate the age and duration of the -process as 10 Gy B2FH ; Beer_Pen . 40K can be produced also in explosive oxygen burning Clayton as a primary nucleosynthesis product in a massive star of initially pure hydrogen while the (secondary) -process production of 40K requires initial abundances of heavy species. A better understanding of Ar cross sections will help clarify the relative primary vs. secondary production of 40K. In a different realm of study, the half-life of 37Ar (=35.011(19) d NDS_37 ) makes this isotope an ideal chronometer for studying circulation and mixing Loosli1 , and that of 39Ar (269(3) y 39Ar_t ) for dating groundwater Corcho ; Loosli2 and ocean water up to about 1000 years Schlosser . The atmospheric steady state concentrations of 37Ar and 39Ar are mainly determined by the spallation reactions 40ArAr and 40ArAr and at lower neutron energies by the 36ArAr and 38ArAr reactions Loosli1 . The latter are also relevant for the estimation of anthropogenic emissions from nuclear installations or for nuclear explosion monitoring LLC2 .
We measured the 36Ar and 38Ar neutron capture cross sections by activation with quasi-Maxwellian neutrons produced by the 7Li reaction at the superconducting linear accelerator of Soreq applied research accelerator facility (SARAF) SARAF1 ; SARAF2 and the Liquid-Lithium Target (LiLiT) LiLiT1 ; LiLiT2 . The activation products 37Ar and 39Ar were counted offline by accelerator mass spectrometry (AMS); 37Ar production was also determined by Low-Level Counting (LLC). Neutron irradiation of separate 36Ar and 38Ar samples was performed at the pneumatic transfer tube (rabbit) of the Soreq IRR-1 nuclear reactor in order to re-measure the respective thermal neutron capture cross sections. Preliminary results of these experiments were reported in INPC16 ; AMS14 .
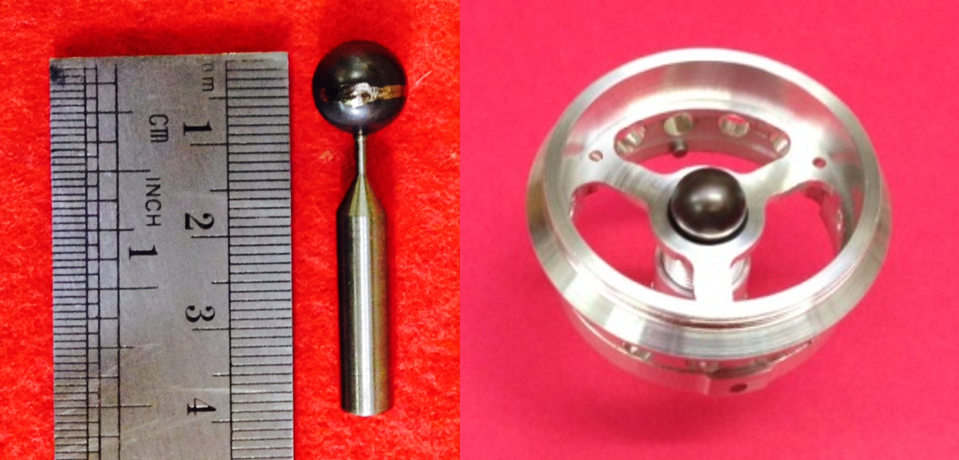
Enriched 36Ar, 38Ar and mixed 38Ar+natAr gas samples were filled into Ti spheres (10 mm outer diameter, 0.2 mm thick Ti shell) sphere . Due to the thermodynamical properties of Ar, the filling was made by successive compression with a custom-made piston and cryogenic pumping in order to achieve the required pressure (30 bar). The samples used are listed in Table 1.
| Sphere # | AAr (mg) | A+1Ar/AAr ratio |
|---|---|---|
| 39 (LiLiT) | 36Ar (24.5) | |
| 52a (reactor, Cd) | 36Ar (19.9) | |
| 60 (reactor) | 36Ar (22.6) | |
| 59 (LiLiT) | 38Ar (19.5) | |
| 54 (reactor) | 38,natAr (12.8) | |
| 52b (reactor) | 38,natAr (15.8) |
For the samples irradiated at SARAF-LiLiT (Table 1), each gas sphere was placed with a 25 mm-diameter Au foil (12.5 m thick), used as a neutron fluence monitor in an evacuated chamber downstream of LiLiT (Fig. 1). LiLiT consists of a windowless film of liquid lithium (1.5 mm thick, 18 mm wide) flowing at 2-3 m/s, serving as both the neutron-producing target and the kW-power beam dump for the incident 1.5 mA proton beam LiLiT1 ; LiLiT2 . The distance from the neutron source to the center of the Ar-filled sphere was 11.3 mm, intercepting 30% of the outgoing neutrons.
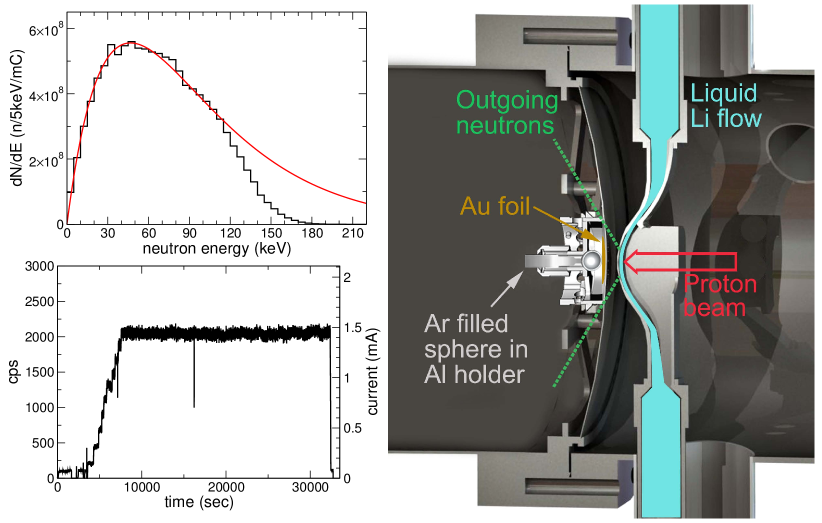
The proton beam energy, measured by Rutherford back scattering off a Au target after the acceleration module, was found to be () keV for the 36Ar (38Ar) irradiation. A proton beam energy spread of 15 keV, estimated from beam dynamics calculations, was verified experimentally gitai_thesis . Auto-radiographic scans nic13 of the Au foils were conducted to determine proton beam centering. An offset of 2.0 (2.2) mm for the 36Ar (38Ar) irradiation was found; this offset was accounted for in our simulations. The neutron yield was continuously monitored with a fission-product ionization chamber FC , located 80 cm downstream the target at 0. The fission chamber count rate was calibrated to beam current (at low intensity) using a Faraday cup located 1 m upstream of the Li target. The total integrated current was 10.8 (7.35) milliampere hour for the 36Ar (38Ar) irradiation (Fig. 1).
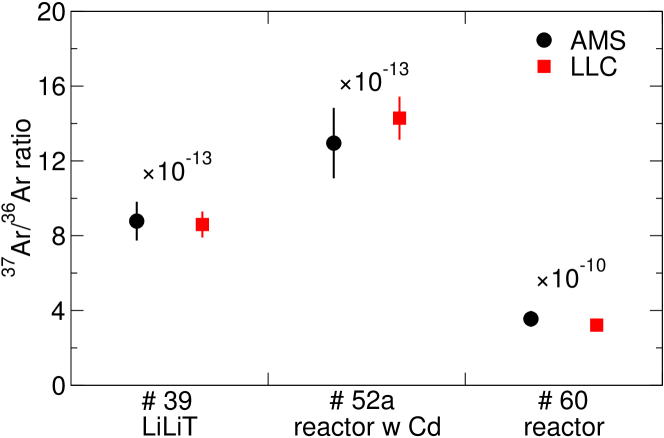
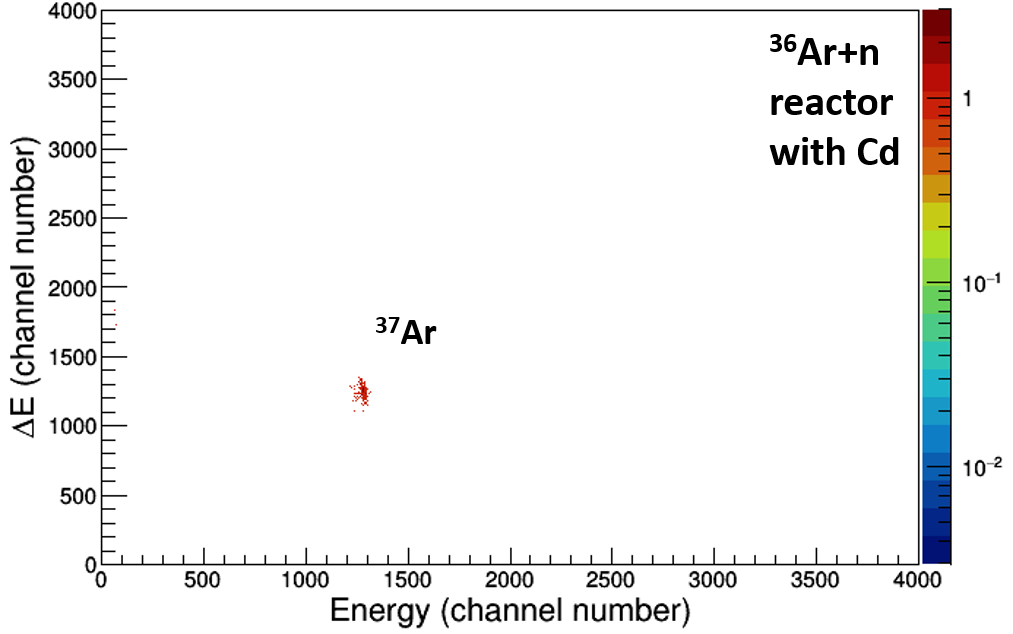
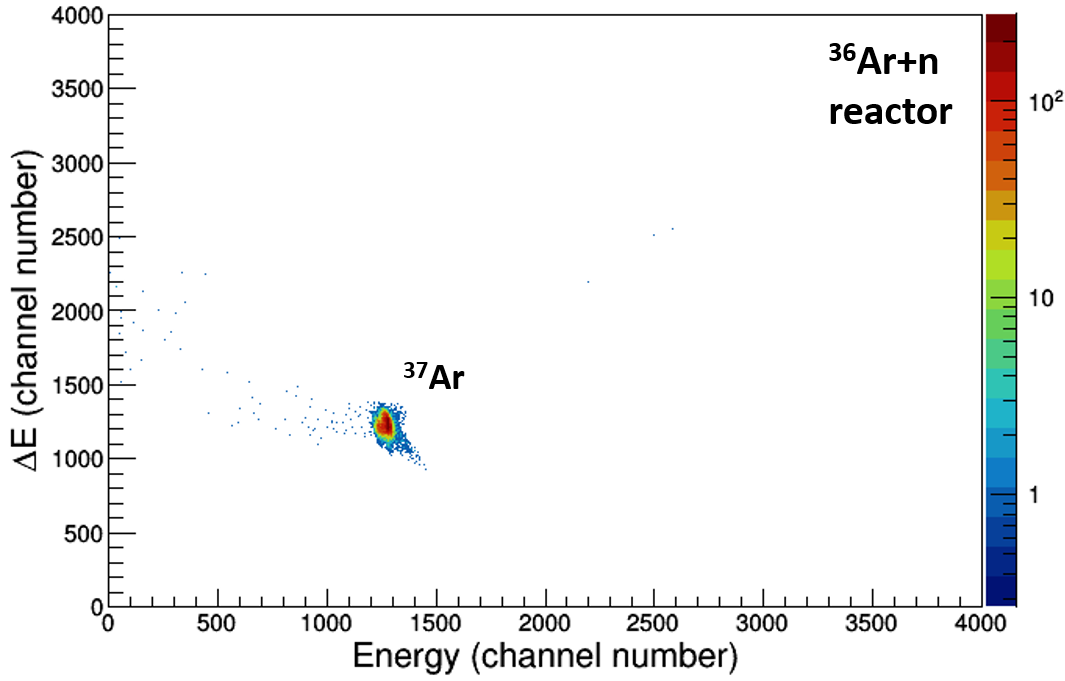
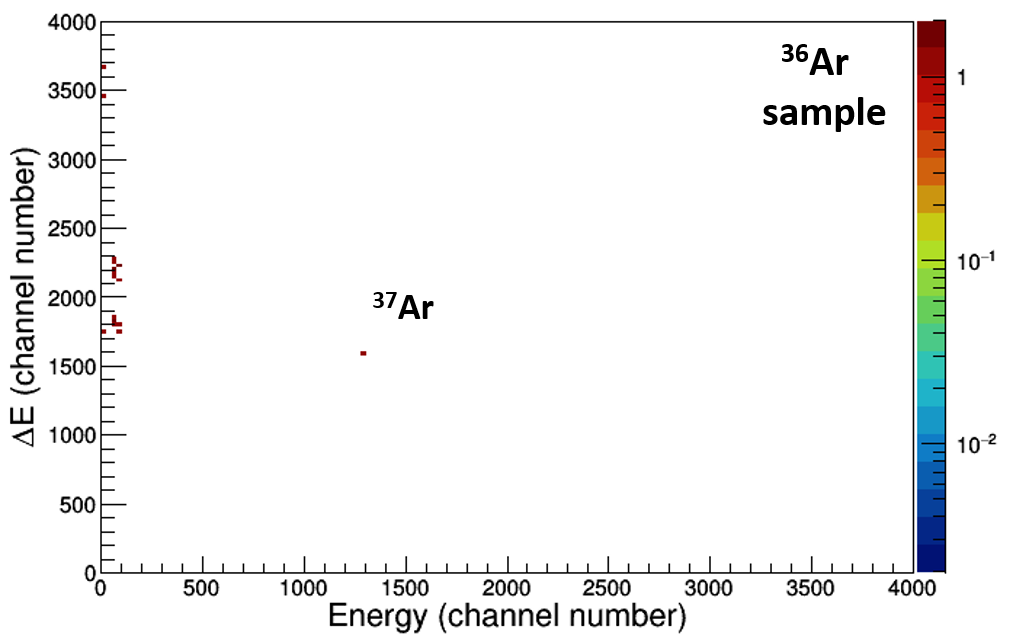
The 37Ar nuclide decays by pure electron capture with no -ray emission; 37Ar is notable for its role in Davis’ solar neutrino experiment Davis where its production via 37ClAr was detected by Auger electron counting. We detected and counted for the first time 37Ar by Accelerator Mass Spectrometry (AMS) at the ATLAS facility of Argonne National Laboratory to measure the 37Ar/36Ar ratio of the irradiated samples. Ar gas was directly fed from the sphere container into an Electron Cyclotron Resonance (ECR) ion source through a remote-controlled sapphire leak valve. 36,37Ar8+ ions were extracted from the ion source and accelerated alternately through ATLAS at an energy of 6 MeV/ by appropriate scaling of all accelerator elements. It was found necessary to strip the 37Ar8+ ions and count 37Ar18+ (fully stripped) in order to suppress the 37Cl (Z=17) background. Stripping was done with a 200 g/cm2 C foil at an intermediate stage of the ATLAS linear accelerator. The stripping process (normally not used in AMS measurements at ATLAS) however produced an isotope fractionation and the effective beam transmission efficiency () was determined by interpolation between the measured 36Ar and 38Ar transmissions. The 37Ar18+ ions were counted using a E-E telescope of Si detectors, 50 and 300 m thick, respectively, showing background-free spectra; the detection sensitivity in the present experiment was 37Ar/Ar (see Supplemental Material Supp ).
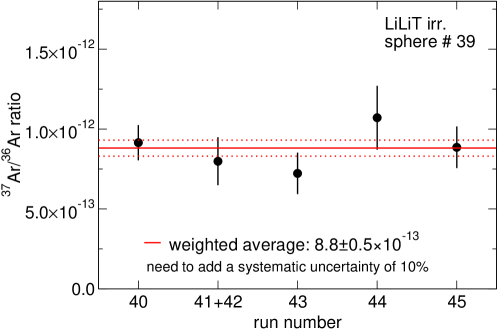
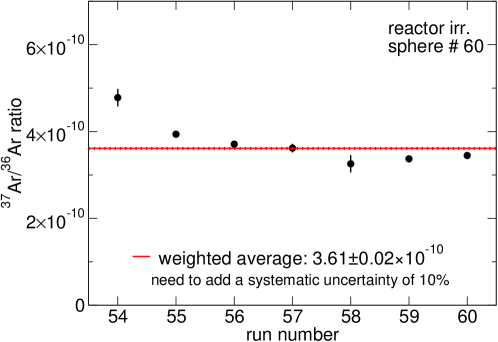
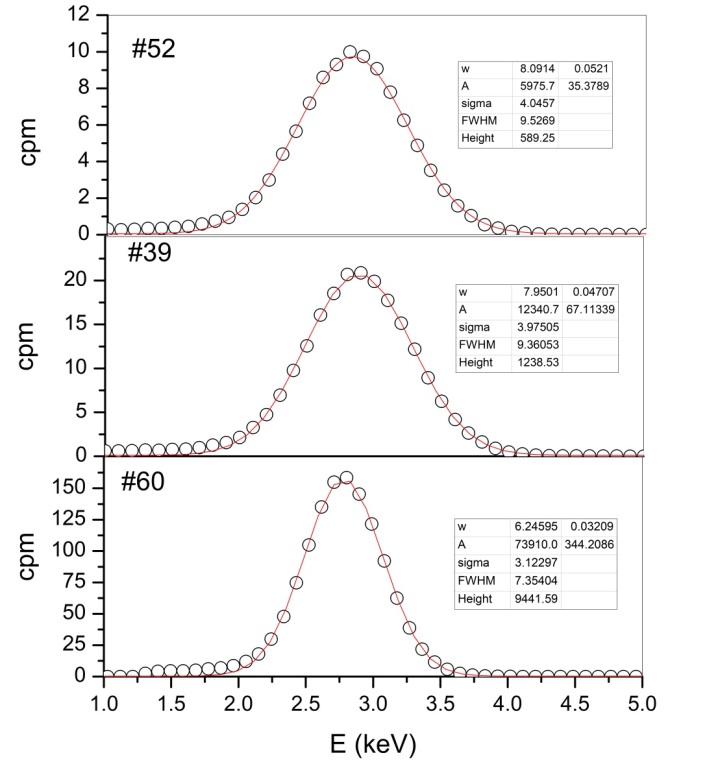
The 37Ar activity of the same samples was also determined by ultra-low-level counting (LLC) in a second stage. Stainless steel vials containing 1 cm3 aliquots of the same activated samples were shipped to the University of Bern. Each gas was quantitatively transferred into a 100 cm3 copper proportional counter which was then filled with P6 gas (6% methane + 94% commercial 37Ar-free argon) to a pressure of 6 bars. The 37Ar activity was measured by detecting Auger electrons in an underground LLC laboratory during 1-2 days LLC1 ; LLC2 . Energy calibration was performed with copper K-shell X-rays (E=8.133 keV) induced by an external 241Am source. The 37Ar peak was identified at the K-capture decay energy of 2.82 keV LLC3 and integrated by means of a Gaussian fit Supp . The amount of 36Ar in the sample was determined, after 37Ar counting, from the filling pressure of the detector and the 40Ar/36Ar ratio measured by mass spectrometry Finn using established procedures. The overall uncertainty of 8% of the final 37Ar/36Ar ratio is dominated by counting statistics and the uncertainties of counting yield (5%) Supp . A comparison of the 37Ar/36Ar ratios measured by AMS and LLC is illustrated in Fig. 2.
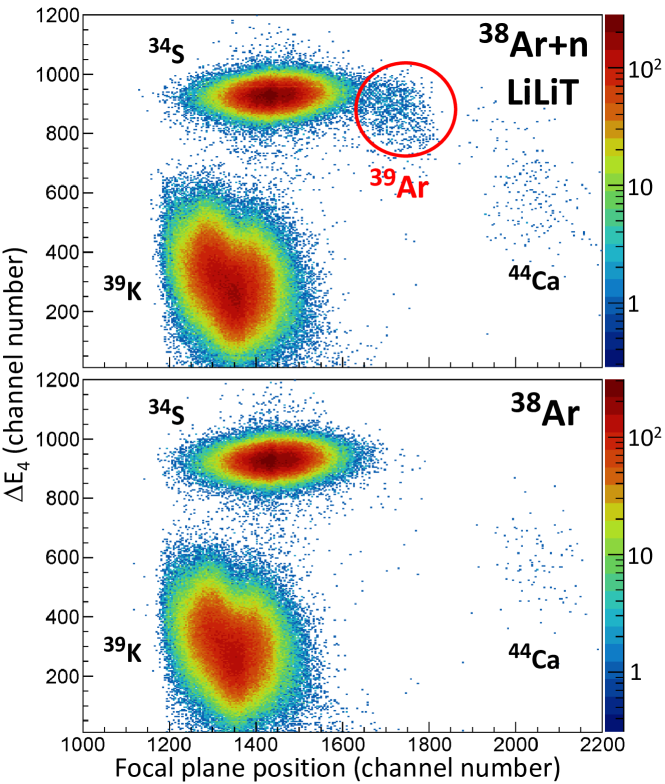
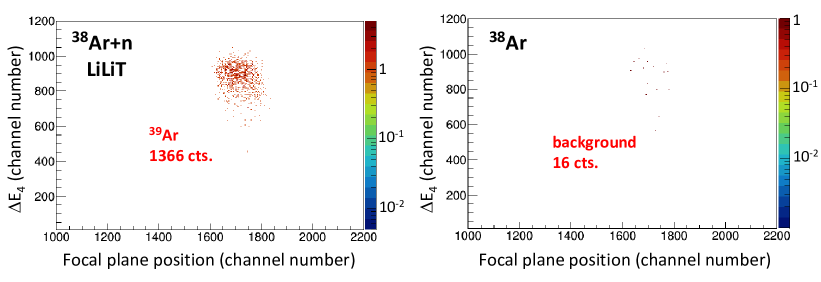
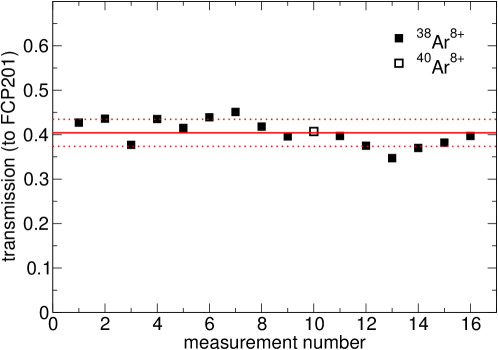
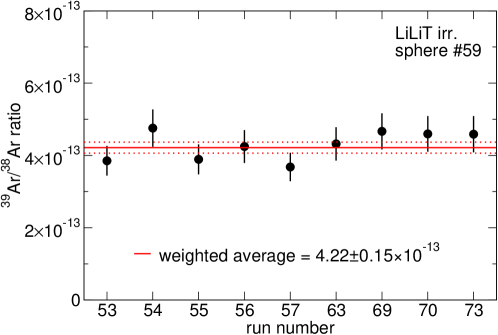
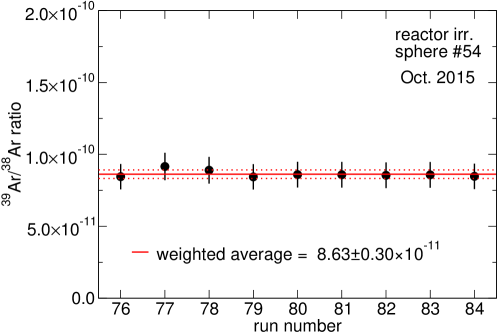
Accelerator Mass Spectrometry of 39Ar has been previously performed at ATLAS Ar39_ANL1 ; Ar39_ANL2 . A high ion energy is essential for the separation and discrimination of 39Ar from the extremely intense source background of the stable 39K isobar. In our experiment, the ECR was operated at low power to reduce as much as possible impinging of the plasma onto the chamber walls, believed to be a source of 39K contamination. 38,39,40Ar8+ ions were accelerated to 6 MeV/, similarly as described before and 39Ar8+ ions were analyzed in the Enge gas-filled magnetic spectrograph GFM , which physically separates 39Ar from beam contaminants, e.g. 39K8+ and 34S7+, which have close-by m/q values (Fig. 3). The accelerator transmission efficiency for 39Ar8+ (0.40(3)) was interpolated between those of 38Ar8+ and 40Ar8+ Supp .
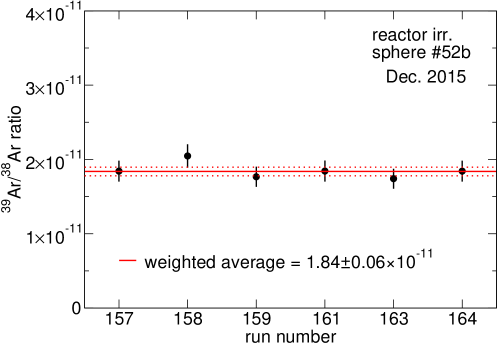
The ratios Ar/AAr at the end of irradiation are determined by where is the number of A+1Ar detected, is the detector efficiency (measured to be 0.91(3) for 38Ar due to grid shadowing in the spectrograph focal-plane detector), the counting time, is the ion charge state (18 for 37Ar and 8 for 39Ar), is the electronic charge in coulomb, and the AArq+ beam intensity (nanoampere); is the A+1Ar decay constant and is the time between the end of irradiation and counting. The final results of the A+1Ar/AAr ratios for all gas samples are presented in Table 1.
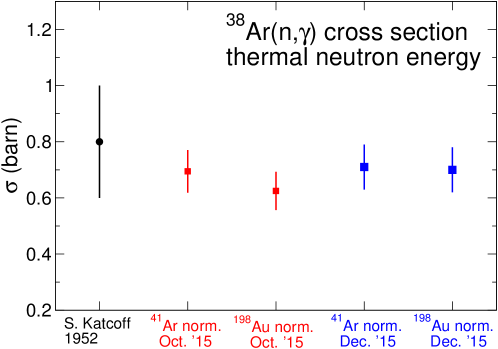
In the reactor irradiations, two small Au samples were attached to the 36Ar and 38Ar spheres for neutron monitoring, using 98.65(9) b Atlas for the 197Au thermal neutron capture cross section. A minor correction for the epithermal activation of Au was applied, using the 198Au activity measured for a gas sphere entirely shielded with 1 mm thick Cd. In contrast to the 36Ar sample, two 38Ar samples irradiated at the reactor (Table 1) were mixed with natAr to use 41Ar (Ar)=0.66(1) b Atlas ) as an internal neutron monitor in addition to the Au monitors; excellent agreement was obtained between the two neutron fluence calibrations Supp . The 36,38Ar measured thermal capture cross sections are listed in Table 2. Uncertainties (1) for 36Ar (38Ar) are 3% (2%) and 7% (11%) from the neutron fluence and atom ratio determinations, respectively.
For the LiLiT irradiated samples, the average experimental cross section, , is obtained by , where is the effective neutron fluence (n/cm2). In view of the complex geometry of the gas sphere irradiation, is calculated as where (0.46 cm3) is the gas sphere’s volume, is the length a neutron travels inside the Ar gas and is the sum of the lengths traveled by all the neutrons inside the Ar gas sphere during the irradiation. is calculated by a detailed simulation (see below), taking a statistically representative sample of neutrons and scaling by the Au activity. The validity of the expression for the neutron fluence, , was confirmed by comparing the value calculated in this way for the Au (planar) monitor with its measured activity; experimental and calculated values agree within 0.5%. The values of (n/cm2) and for 36Ar (38Ar) are 6.2(1) (4.22(9)) and 1.4(1) mb (0.95(10) mb), respectively. Uncertainties (1) for the 36Ar (38Ar) experimental cross section are 2% (2%) and 7% (11%) from the neutron fluence and atom ratio determinations, respectively.
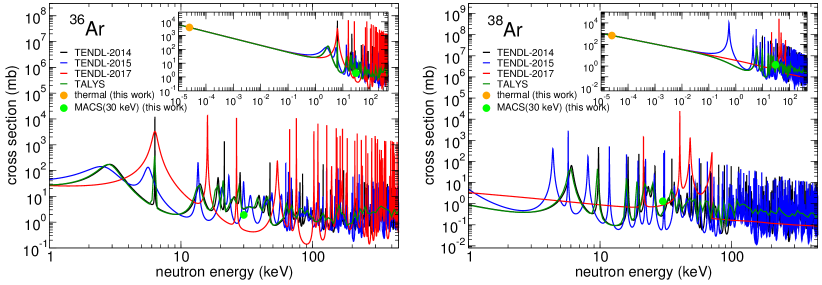
The experimental cross section measured in our experiments is an energy-averaged value over the neutron spectrum and interpretation in terms of a Maxwellian Averaged Cross Section (MACS) requires knowledge of the shape of the spectrum. The integral neutron spectrum seen by the targets under the irradiation conditions of the experiment is however not measurable. Instead we rely on detailed simulations using the codes SimLiT SimLiT for the thick-target 7Li neutron yield, and GEANT4 GEANT4 for neutron transport (Fig. 1) PLB_Zr . The SimLiT-GEANT4 simulations have been carefully benchmarked in separate experiments and excellent agreement with experimental time-of-flight and (differential and integral) energy spectra was obtained PLB_Zr ; SimLiT ; Gitai . The simulated neutron spectrum, is well fitted in the range keV ( 90% of the incident neutrons) by a Maxwell-Boltzmann (MB) flux with keV (Fig. 1). The quantitative normalization of the neutron spectrum, , was obtained by comparing the experimental number of 198Au nuclei (measured by gamma activity with a high-purity germanium detector) in the Au foil monitor with the number of 198Au nuclei calculated in the detailed simulation of the entire setup (see PLB_Zr for details).
We calculate the MACS at a given thermal energy with the procedure developed in PLB_Zr ; PLB_Zr2 , using the expression where the correction factor is given by
| (1) |
may have coherent contributions from compound-resonances and (weakly energy dependent) direct captures (DC). We note here that includes all contributions in the experimental energy range; we use in Eq. (1) the Hauser-Feshbach model for the energy dependence of in the wider MB range and estimate the additional uncertainties associated with direct capture. In order to account for the sensitivity to the low density of available compound states in 37,39Ar, we apply different codes Supp : TENDL-2014 TENDL14 , -2015 TENDL15 , -2017 TENDL17 and TALYS-1.8 TALYS with a microscopic level density and average the values obtained; the greater of 20% of the correction or their standard deviation is attributed to the MACS corrections. It should however be noted that the extrapolation of the MACS to different thermal energies and determination of their uncertainties were made using a limited number of theoretical models, due to the total absence of experimental knowledge of resonances in the 37,39Ar compound nuclei. We also add an estimated independent 15% uncertainty from s-wave and p-wave DC contributions. Detailed calculations of the correction factor and its uncertainties will be included in an expanded version of this Letter. Our MACS values and uncertainties are listed in Table 2 and compared to existing theoretical values.
| Year [Ref.] | 36Ar | 38Ar |
|---|---|---|
| thermal cross section (b) | ||
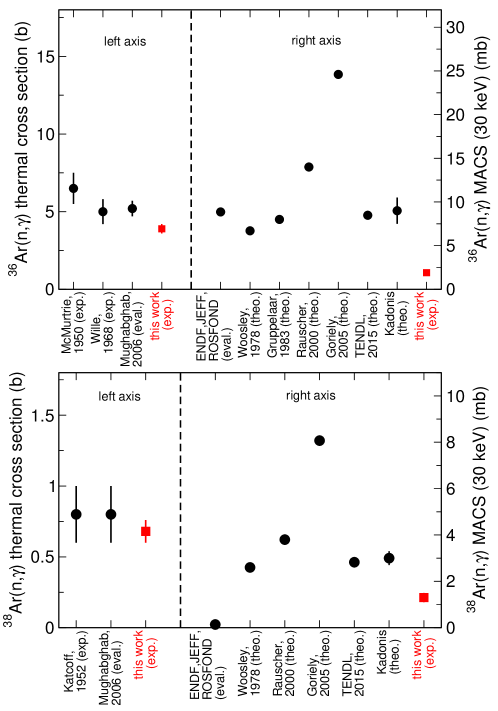
| 1950 McMurtie | 6.5(10) | |
| 1968 Wille | 5.0(8) | |
| 1952 Katcoff | 0.8(2) | |
| 2006 Atlas | 5.2(5) | 0.8(2) |
| This work | 3.9(3) | 0.68(8) |
| MACS(30 keV) (mb) | ||
| 1978 Woosley | 6.7 | 2.6 |
| 1983 Grup | 8 | |
| 2000 Rauscher | 14 | 3.9 |
| 2005 Goriely | 24.6 | 8.07 |
| 2011 ENDF ; Jeff ; Rosfond | 8.86 | 0.137 |
| 2015 TENDL15 | 8.48 | 2.82 |
| Kadonis Kadonis | 9.0(15) | 3.0(3) |
| This work (30 keV) | 1.9(3) | 1.3(2) |
| This work (47 keV) | 1.4(2) | 0.92(16) |
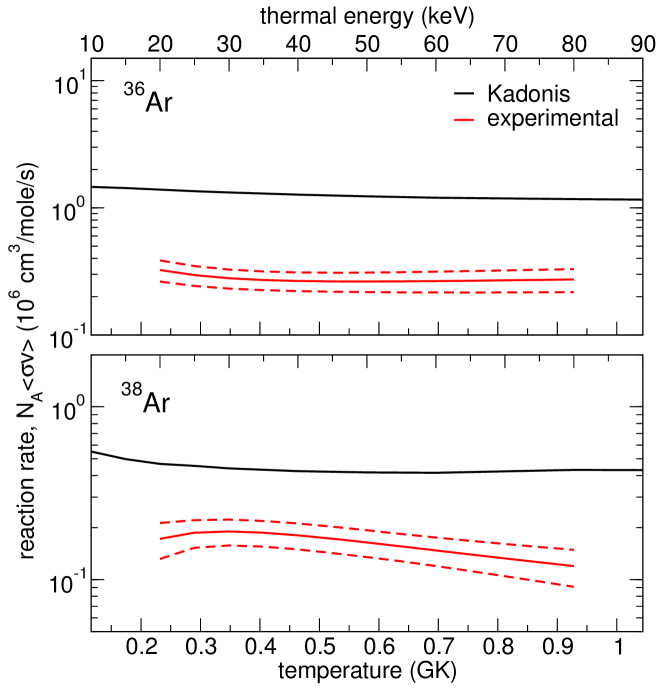
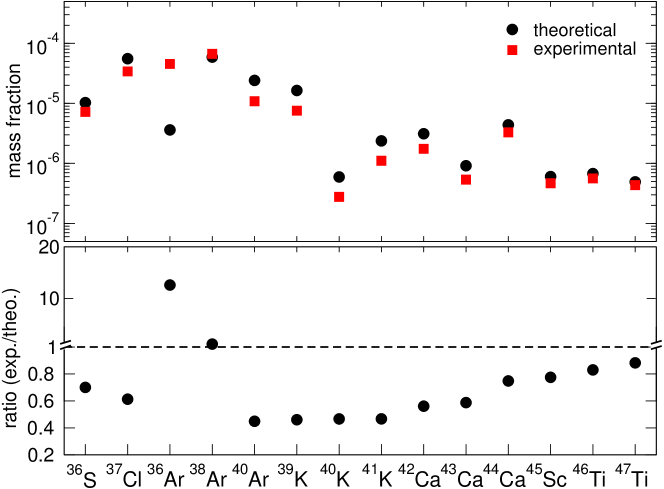
The experimental MACS values (Table 2) obtained in this work are notably different from previous calculations. Fig. 4 shows the 36,38Ar reaction rates () based on our measurements and extrapolation to different temperatures, compared to the rates adopted so far Kadonis .
In order to show the potential effect of these experimental rates on stellar nucleosynthesis, we performed a single-zone network calculation using physical conditions appropriate for the He core burning phase of a massive star in which the new 36,38Ar rates are used, leaving all others unchanged Kadonis . The calculations are done using the single-zone NucNet Tools reaction network code nucnet starting at the H-burning phase with solar abundances Lodders and continuing into a single-zone He core burning (T= 300 MK, density of 1 kg/cm3). Substantial (10-50%) changes in the calculated mass fractions for neutron-rich light nuclides between 34S and 58Fe are observed (Fig. 5), reminiscent of the sensitivity observed in the weak -process region (A56-70) due to the change of a single cross section Nassar . The mass fraction of 36Ar itself is observed to increase by a factor of 10 due to its lower measured capture-cross section. Especially interesting is the 45% decrease in the calculated mass fraction of the important cosmo/geo-chronometer 40K implying a weaker contribution of the secondary -process relative to primary production. As shown in Frank et al. Frank , the mass fraction of 40K differs considerably over time whether it is primary only or secondary only. For example, with a larger primary production of 40K which is the dominant initial heat generator in Earth-like exoplanets, considerable heating would occur in these worlds even early in the Galaxy history.
The measurements of the 36Ar cross sections affect also the calculation of the natural 37Ar background activity in the atmosphere, the interpretation of 37Ar emission rates in underground nuclear explosion monitoring LLC2 and the investigation of atmospheric air circulation Loosli1 . The detection of 37Ar by AMS demonstrated here opens the way to an alternative method for the monitoring of environmental samples AMS14 . Similarly to 37Ar, the 38ArAr reaction contributes to the 39Ar production rate in the atmosphere Loosli1 and determines the initial value for the use of 39Ar as a groundwater dating chronometer Corcho ; Loosli2 ; Collon . In summary, first measurements of the neutron capture cross sections of 36Ar and 38Ar at stellar energies were performed. The experimental value for 36Ar, in particular, is smaller than the one adopted so far from theoretical calculations and evaluations by a factor of 10. Nucleosynthesis calculations for the weak -process regime using the measured cross sections are shown to increase the mass fraction of 36Ar by a factor of 10 and lower the residual mass fraction of neutron-rich nuclides in the region A=36-48 by 10 to 50%. The 36,38Ar cross sections affect the interpretation of environmental monitoring using 37Ar or 39Ar as geophysical tracers.
Acknowledgements.
We would like to thank the SARAF and LiLiT (Soreq NRC) and the ATLAS operation staffs for their dedicated help during the experiments. This work was supported in part by the Israel Science Foundation (Grant No. 1387/15), by the Pazy Foundation (Israel), the Israel Ministry of Science (Eshkol Grant No. 18145), the US Department of Energy, Office of Nuclear Physics, under Award No. DE-AC02-06CH11357. D.S.G. acknowledges the support by the U.S. Department of Energy, Office of Nuclear Physics, under Award No. DE-FG02-96ER40978. This research has received funding from the European Research Council under the European Unions’s Seventh Framework Program (FP/2007-2013)/ERC Grant Agreement No. 615126.References
- (1) C. F. von Weizsäcker, The possibility of a dual -decomposition in potassium, Phys. Z. 38, 623 (1937).
- (2) E. Anders and T. Owen, Mars and Earth: origin and abundance of volatiles, Science 198, 453 (1977).
- (3) K. Lodders, Solar system abundances and condensation temperatures of the elements, Astrophys. J. 591, 1220 (2003).
- (4) R. D. Hoffman, S. E. Woosley, T. A. Weaver, T. Rauscher, and F.-K. Thielemann, The reaction rate sensitivity of nucleosynthesis in type II supernovae, Astrophys. J. 521, 735 (1999).
- (5) R. Reifarth, K. Schwarz, and F. Käppeler, The stellar neutron-capture rate of 34S: the origin of 36S challenged, Astrophys. J. 528, 573 (2000).
- (6) J. Chen, Nuclear data sheets for A = 40, Nucl. Data Sheets 140, 1 (2017).
- (7) E. M. Burbidge, G. R. Burbidge, W. A. Fowler, and F. Hoyle, Synthesis of the elements in stars, Rev. Mod. Phys. 29, 547 (1957).
- (8) H. Beer and R. D. Penzhorn, Measurement of the neutron capture cross section of Ar-40 and an s-process analysis from S-34 to Ca-42, Astron. Astrophys. 174, 323 (1987).
- (9) D. D. Clayton, Handbook of the Isotopes in the Cosmos (Cambridge University Press, Cambridge, England, 2003).
- (10) J. Cameron, J. Chen, B. Singh, and N. Nica, Nuclear data sheets for A = 37, Nucl. Data Sheets 113, 365 (2012).
- (11) H. H. Loosli, H. Oeschger, and W. Wiest, Argon 37, argon 39, and krypton 81 in the atmosphere and tracer studies based on these isotopes, J. Geophys. Res. 75, 2895 (1970).
- (12) B. Singh and J. A. Cameron, Nuclear data sheets for A = 39, Nucl. Data Sheets 107, 225 (2006).
- (13) J. A. Corcho Alvarado, R. Purtschert, F. Barbecot, C. Chabault, J. Rueedi, V. Schneider, W. Aeschbach-Hertig, R. Kipfer, and H. H. Loosli, Constraining the age distribution of highly mixed groundwater using 39Ar: A multiple environmental tracer (3H/3He, 85Kr, 39Ar, and 14C) study in the semiconfined Fontainebleau Sands Aquifer (France) Water Resour. Res. 43, W03427 (2007).
- (14) H. H. Loosli, A dating method with 39Ar, Earth Planet. Sci. Lett. 63, 51 (1983).
- (15) P. Schlosser, B. Kromer, G. Östlund, B. Ekwurzel, G. Bönisch, H. H. Loosli, and R. Putschert, On the 14C and 39Ar Distribution in the Central Arctic Ocean: Implications for Deep Water Formation, Radiocarbon 36, 327 (1994).
- (16) R. Riedmann and R. Purtschert, Natural 37Ar concentrations in soil air: implications for monitoring underground nuclear explosions, Environ. Sci. Technol. 45, 8656 (2011).
- (17) A. Kreisel et al., Phase-I proton/deuteron linac beam operation status, in Proceedings of Linac 2014, Geneva (Switzerland), (WEIOB02, 770, 2014), and references therein, http://accelconf.web.cern.ch/AccelConf/LINAC2014/papers/weiob02.pdf.
- (18) I. Mardor et al., The Soreq Applied Research Accelerator Facility (SARAF): overview, research programs and future plans, Eur. Phys. J. A 54, 91 (2018).
- (19) S. Halfon et al., High-power liquid-lithium jet target for neutron production, Rev. Sci. Instr. 84, 123507 (2013).
- (20) S. Halfon et al., Note: Proton irradiation at kilowatt-power and neutron production from a free-surface liquid-lithium target, Rev. Sci. Instr. 85, 056105 (2014).
- (21) M. Paul et al., Nucleosynthesis reactions with the high-intensity SARAF-LiLiT neutron source, Proc. Sci., INPC2016 (2017) 139; https://pos.sissa.it/281/139/pdf.
- (22) M. Paul et al., Positive-ion accelerator mass spectrometry at ATLAS: peaks and pits, in Proceedings of the Fourteenth International AMS Conference (AMS14), 2017, Ottawa (Canada); (to be published.
- (23) G. Rupp, D. Petrich, F. Käppeler, J. Kaltenbaek, B. Leugers, and R. Reifarth, High pressure gas spheres for neutron and photon experiments, Nucl. Instrum. Methods Phys. Res., Sect. A 608, 152 (2009).
- (24) G. Feinberg, Study of the 7Li Reaction Towards Measurements of Neutron-Capture Cross Sections in the Astrophysical -process With the SARAF Accelerator and a Liquid-Lithium Target, Ph.D. thesis, Hebrew University, 2014 (unpublished); http://arad.mscc.huji.ac.il/dissertations/W/JSL/001975970.pdf.
- (25) M. Paul et al., First nuclear-astrophysics experiments with high-intensity neutrons form the liquid-lithium target LiLiT, Proc. Sci. NIC, XIII2014 (2014) 059, http://pos.sissa.it/archive/conferences/204/059/NIC%20XIII_059.pdf.
- (26) Model PFC16A, Centronics Ltd., UK, http://www.centronic.co.uk/.
- (27) Trace Sciences International Corporation, http://www.tracesciences.com/.
- (28) See Supplemental Material (following these references) for additional information.
- (29) R. Davis, A review of the homestake solar neutrino experiment, Prog. Part. Nucl. Phys. 32, 13 (1994).
- (30) H. H. Loosli, M. Möll, H. Oeschger, and U. Schotterer, Ten years low-level counting in the underground laboratory in Bern, Switzerland, Nucl. Instrum. Methods Phys. Res., Sect. B 17, 402 (1986).
- (31) J. P. Renier, H. Genz, K. W. D. Ledingham, and R. W. Fink, orbital-electron-capture ratio in Ar37 decay and the fraction of X rays in the series of chlorine, Phys. Rev. 166, 935 (1968).
- (32) Thermo Finnigan MAT 253, Thermo Electron Corporation, http://www.thermo.com.
- (33) P. Collon et al., Development of an AMS method to study oceanic circulation characteristics using cosmogenic 39Ar, Nucl. Instrum. Methods Phys. Res., Sect. B 223, 428 (2004).
- (34) P. Collon et al., Reducing potassium contamination for AMS detection of 39Ar with an electron-cyclotron-resonance ion source, Nucl. Instrum. Methods Phys. Res., Sect. B 283, 77 (2012).
- (35) M. Paul, B. G. Glagola, W. Henning, J. G. Keller, W. Kutschera, Z. Liu, K. E. Rehm, B. Schneck, and R. H. Siemssen, Heavy ion separation with a gas-filled magnetic spectrograph, Nucl. Instrum. Methods Phys. Res., Sect. A 277, 418 (1989).
- (36) M. Paul, B. Harss, D. Henderson, C. L. Jiang, and K. E. Rehm, A new large area focal plane detector for the ATLAS split pole spectrograph, Argonne National Laboratory, Argonne, Illinois, USA, Physics Division Annual Report No. ANL-97/14, 1997 p. 79, https://inldigitallibrary.inl.gov/Reports/ANL-97-14.pdf.
- (37) S.F. Mughabghab, Atlas of Neutron Resonances (Elsevier Science, New York, 2006); data available online: https://www-nds.iaea.org/relnsd/NdsEnsdf/neutroncs.html.
- (38) G. E. McMurtrie and D. P. Crawford, The thermal neutron-capture cross section of A36, Phys. Rev. 77, 840 (1950).
- (39) P. Wille, The decay of 37Ar following neutron capture in 36Ar, Atomkernenergie 13, 383 (1968).
- (40) S. Katcoff, Thermal neutron capture cross section of A40 and observation of A42, Phys. Rev. 87, 886 (1952).
- (41) S. E. Woosley, W. A.Fowler, J. A. Holmes, and B. A. Zimmerman, Semiempirical thermonuclear reaction-rate data for intermediate-mass nuclei, At. Data Nucl. Data Tables 22, 371 (1978).
- (42) H. Gruppelaar and H. A. J. van der Kamp, Evaluation of activation cross sections of corrosion products, cover-glass nuclides and other nuclides in the primary cooling circuit of a fast power reactor, Nuclear Data for Science and Technology, edited by K. Böckhoff (D. Reidel Publishing Company, Dordrecht, Holland, 1983), p. 643.
- (43) T. Rauscher and F.-K. Thielemann, Astrophysical reaction rates from statistical model calculations, At. Data Nucl. Data Tables 75 ,1 (2000).
- (44) S. Goriely, Hauser-Feshbach rates for neutron-capture reactions, Ver. 8/29/2005, http://www-astro.ulb.ac.be/Html/hfr.html.
- (45) M. B. Chadwick, et al., ENDF/B-VII.1 nuclear data for science and technology: cross sections, covariances, fission product yields and decay data, Nucl. Data Sheets 112, 2887 (2011).
- (46) JEFF-3.2 Library, Joint Evaluated Fission and Fusion (2014), https://www.oecd-nea.org/dbforms/data/eva/evatapes/jeff_32/.
- (47) ROSFOND-2010 Library, Institute of Physics and Power Engineering (2010), http://www.ippe.ru/podr/abbn/libr/rosfond.php.
- (48) A. J. Koning et al., TENDL-2015, https://tendl.web.psi.ch/tendl_2015/tendl2015.html.
- (49) I. Dillmann et al., KADoNiS‐ The Karlsruhe Astrophysical Database of Nucleosynthesis in Stars, AIP Conf. Proc. 819, 123 (2006); available online: http://www.kadonis.org/.
- (50) M. Friedman et al., Simulation of the neutron spectrum from the 7Li reaction with a liquid-lithium target at Soreq Applied Research Accelerator Facility, Nucl. Instrum. Methods Phys. Res., Sect. A 698, 117 (2013).
- (51) S. Agostinelli et al., Geant4 - a simulation toolkit, Nucl. Instrum. Methods Phys. Res., Sect. A 506, 250 (2003).
- (52) M. Tessler et al., Stellar 30-keV neutron capture in 94,96Zr and the 90ZrZr photonuclear reaction with a high-power liquid-lithium target, Phys. Lett. B 751, 418 (2015).
- (53) G. Feinberg et al., Quasi-stellar neutrons from the 7LiBe reaction with an energy-broadened proton beam, Phys. Rev. C 85, 055810 (2012).
- (54) M. Tessler et al., Stellar 30-keV neutron capture in 94,96Zr and the 90ZrZr photonuclear reaction with a high-power liquid-lithium target, Supp. Mat., Phys. Lett B 751, 418 (2015); https://ars.els-cdn.com/content/image/1-s2.0-S0370269315008175-mmc1.pdf.
- (55) A. J. Koning and D. Rochman, Modern nuclear data evaluation with the TALYS code system, Nucl. Data Sheets 113, 2841 (2012); available online:ftp://ftp.nrg.eu/pub/www/talys/tendl2014/tendl2014.html.
- (56) A. J. Koning et al., TENDL-2017, https://tendl.web.psi.ch/tendl_2017/tendl2017.html.
- (57) A. Koning, S. Hilaire, and S. Goriely, TALYS-1.8, NRG-1755 ZG Petten, The Netherlands (2015), http://www.talys.eu/home/.
- (58) https://sourceforge.net/projects/nucnet-tools/.
- (59) H. Nassar et al., Stellar cross section of 62Ni, Phys. Rev. Lett. 94, 092504 (2005).
- (60) E. A. Frank, B. S. Meyer, and S.J. Mojzsis, A radiogenic heating evolution model for cosmochemically Earth-like exoplanets, Icarus 243, 274 (2014).
- (61) P. Collon, W. Kutschera, and Z. T. Lu, Tracing noble gas radionuclides in the environment, Annu. Rev. Nucl. Part. Sci. 54, 39 (2004).
Supplementary material
We present here supplementary material referred to in the paper.
| Sphere # | AAr gas | AAr mass (mg) | Irradiation | A+1Ar/AAr ratio |
|---|---|---|---|---|
| 39 | 36Ar | 24.5 | LiLiT | |
| 52a | 36Ar | 19.9 | reactor, 20 min., 80 kW, w/ Cd | |
| 60 | 36Ar | 22.6 | reactor, 20 min., 80 kW, w/o Cd | |
| 59 | 38Ar | 19.5 | LiLiT | |
| 54 | 38,natAr | 12.8 (38Ar/natAr = 11.7) | reactor, 40 sec, 5 MW | |
| 52b | 38,natAr | 15.8 (38Ar/natAr = 10.2) | reactor, 20 sec, 3 MW |

| run # | time (sec) | (nA) | 37Ar/36Ar ratio | |
| 40 | 94(10) | 5207.8 | 1.66(1) | |
| 41+42 | 68(8) | 4333.8 | 1.6(3) | |
| 43 | 37(6) | 3866.7 | 1.1(1) | |
| 44 | 50(7) | 3918.6 | 1.00(5) | |
| 45 | 55(7) | 3489.1 | 1.50(6) | |
| weighted | ||||
| average |
| run # | time (sec) | (nA) | 37Ar/36Ar ratio | |
| 52 | 48(7) | 2526.3 | 1.4(4) | |
| 53 | 122(11) | 3135.3 | 1.9(1) | |
| weighted | ||||
| average |
| run # | time (sec) | (nA) | 37Ar/36Ar ratio | |
| 54 | 10990(105) | 579.2 | 2.7(1) | |
| 55 | 9228(96) | 563.2 | 2.85(3) | |
| 56 | 8574(93) | 566.6 | 2.79(3) | |
| 57 | 8595(93) | 567.5 | 2.86(7) | |
| 58 | 7293(85) | 564.8 | 2.7(2) | |
| 59 | 8942(95) | 644.9 | 2.81(2) | |
| 60 | 9402(97) | 645.5 | 2.89(7) | |
| weighted | ||||
| average |
| sample | 37Ar/36Ar ratio |
|---|---|
| LiLiT | |
| reactor with Cd | |
| reactor (w/o Cd) |
| run # | time (sec) | (A) | 39Ar/38Ar ratio | |
|---|---|---|---|---|
| 53 | 680(19) | 3584 | 0.69(7) | |
| 54 | 589(20) | 3606 | 0.48(5) | |
| 55 | 756(19) | 3855 | 0.71(7) | |
| 56 | 610(17) | 3584 | 0.56(6) | |
| 57 | 656(18) | 3538 | 0.71(7) | |
| 63 | 659(18) | 3653 | 0.60(6) | |
| 69 | 783(23) | 3697 | 0.64(6) | |
| 70 | 791(23) | 3698 | 0.65(7) | |
| 73 | 374(14) | 1826 | 0.63(6) | |
| weighted | ||||
| average | ||||
| blank | ||||
| final ratio | a |
-
a
including the 3.3% uncertainty of the detector efficiency.
| run # | time (sec) | (A) | 39Ar/38Ar ratio | |
|---|---|---|---|---|
| 76 | 91629(1392) | 3628 | 0.42(2) | |
| 77 | 65234(1081) | 3606 | 0.28(3) | |
| 78 | 76924(1236) | 3102 | 0.39(4) | |
| 79 | 115416(1847) | 3601 | 0.53(5) | |
| 80 | 103310(1616) | 3542 | 0.48(5) | |
| 81 | 119096(1939) | 3381 | 0.58(6) | |
| 82 | 124323(1979) | 3545 | 0.58(6) | |
| 83 | 119768(1980) | 3580 | 0.55(6) | |
| 84 | 115483(1880) | 3587 | 0.53(5) | |
| weighted | ||||
| average | ||||
| blank | ||||
| final ratio | a |
-
a
including the 3.3% uncertainty of the detector efficiency.
| run # | time (sec) | (A) | 39Ar/38Ar ratio | |
|---|---|---|---|---|
| 157 | 3597(47) | 900 | 0.30(2) | |
| 158 | 3349(56) | 908 | 0.25(2) | |
| 159 | 3192(46) | 901 | 0.28(2) | |
| 161 | 3180(53) | 900 | 0.27(2) | |
| 163 | 6674(110) | 1231 | 0.44(3) | |
| 164 | 11207(259) | 2037 | 0.42(3) | |
| weighted | ||||
| average | ||||
| blank | ||||
| final ratio | a |
-
a
including the 3.3% uncertainty of the detector efficiency.