Collective Mode Interferences in Light-Matter Interactions
Abstract
We present a theoretical and experimental analysis of transient optical properties of a dense cold atomic gas. After the rapid extinction of a weak coherent driving field (mean photon number ), a transient ‘flash’ is observed. Surprisingly the decay of the ‘flash’ is faster than the decay of the fastest superradiant mode of the system. We show that this ‘faster than superradiance decay’ is expected due to the interference between collective eigenmodes that exhibit a range of frequency shifts away from the bare atomic transition. Experimental results confirm that the initial decay rate of the superradiant flash increases with optical depth, in agreement with the numerical simulations for the experimental conditions.
The optical properties of an ensemble of light scatterers can be dramatically modified when the scatterers behave collectively rather than independently. Certain collective effects such as superradiance and subradiance are well known and have been observed in a wide variety of systems Guerin et al. (2016); Facchinetti et al. (2016); Meir et al. (2014); Javanainen et al. (2017); Peyrot et al. (2018); Guerin et al. (2016); Facchinetti et al. (2016); Roof et al. (2016); Corman et al. (2017); Cottier et al. (2018); Guerin and Kaiser (2017); Bromley et al. (2016); Araújo et al. (2016); Jenkins et al. (2016); Jennewein et al. (2016, 2018); Keaveney et al. (2012); Meir et al. (2014); Javanainen et al. (2017); Peyrot et al. (2018); Meir et al. (2014); Jenkins and Ruostekoski (2013); Hopkins et al. (2013); Bradac et al. (2017); Röhlsberger et al. (2010); van Loo et al. (2013); Mlynek et al. (2014); Svidzinsky et al. (2010). The phenomenon of superradiance derives its origins from the 1954 paper by Dicke Dicke (1954) who predicted that a fully excited ensemble of quantum emitters enclosed within a volume much smaller than the resonant wavelength, , can decay with a peak intensity enhanced by a factor of , although in practice this enhancement is strongly suppressed by interactions Gross and Haroche (1982). Collective behavior however can also occur even with just a single excitation and in extended samples with dimension larger than a wavelength. For single excitation the field excites a superposition of many-body collective eigenmodes with decay rates between and , where is the single emitter decay rate, depending on the geometry. Interestingly, one can exploit geometry to engineer the collective response and enhance the light-matter coupling for applications such as photon memories and gates Bettles et al. (2016); Shahmoon et al. (2017); Jenkins and Ruostekoski (2013); Facchinetti et al. (2016); Manzoni et al. (2018); Scuri et al. (2018); Mahmoodian et al. (2018).
For large ensembles, each atom (or, more generally, emitter) can be modelled as a driven-dissipative electric dipole which interacts with every other dipole in the ensemble. The resulting recurrent scattering of each photon can modify the ensemble decay rate and linewidth as well as introducing lineshifts and many other phenomena. This can occur even when the inter-atomic spacing is greater than the wavelength, as is the case in this paper. Investigation of collective behavior in atomic clouds has a rich history Roof et al. (2016); Corman et al. (2017); Cottier et al. (2018); Guerin and Kaiser (2017); Bromley et al. (2016); Araújo et al. (2016); Jenkins et al. (2016); Jennewein et al. (2016, 2018); Scully (2009); Svidzinsky et al. (2010); do Espirito Santo et al. (2020). Other collective interference effects have been previously observed in many experiments such as quantum interference beats between different quantum states Haroche (1976) or as a result of the relative motion of atoms Whiting et al. (2017). However, the interference between collective eigenmodes predicted and observed in this letter has not previously been discussed.
In this paper, we investigate ‘single-photon superradiance’ in a dense cold ensemble with dimension larger than the optical wavelength. We present a striking example where interference between simultaneously excited collective eigenmodes leads to faster than expected superradiant population dynamics and photon emission. Unlike previous works observing a so-called ‘super-flash’ which decays faster than the lifetime due to motional dephasing Chalony et al. (2011); Kwong et al. (2014, 2015), in our experiment the atomic motion is frozen over the timescale of the decay and the observed speed-up is due to collective interference effects. In addition, we observe that perhaps counter-intuitively, even for a simple system of two-level emitters, the resonance linewidth, , is not trivially related to the collective emission time scale, , . By careful simulations of the many-body collective response we show how these results arise from interference between collective modes. Since collective mode interference is, in fact, common in most many-body light-matter interactions and important with regard to many applications, for example, in the stability of atomic clocks Bromley et al. (2016), a deeper understanding of its significance is vital to advances in quantum technology.
The paper is organised as follows: First we outline the theoretical model of collective eigenmodes in an atomic ensemble. Next, we describe the experiment and present data on the measurement of the flash decay rates as a function of the optical depth of the medium. Finally, we show that the faster than expected superradiant decay is predicted by the coupled collective mode model and arises due to collective mode interference.
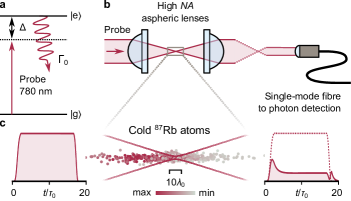
Both numerically and experimentally, we investigate the optical signal collected by a single mode fibre downstream of a cloud of cold atoms driven by a tightly focused weak laser beam (probe, -waist radius ) resonant with a two-level electric dipole transition. After the laser is switched on, the atomic dipoles are driven into a collective steady state. The emission dynamics are observed in the laser propagation direction by turning the laser off on a timescale faster than the resonant excitation lifetime . The atomic polarization decays producing a bright fluorescent flash due to the sudden cancellation of the extinction Chalony et al. (2011); Kwong et al. (2014, 2015). The atomic density is varied by varying the number of atoms in the trap.
To understand the resulting emission dynamics, we consider the simplest configuration first: a pair of two-level atoms. This will allow us to observe the behaviour of an individual eigenmode. For atoms, there are two collective eigenmodes; one ‘symmetric’ where the dipoles oscillate in phase with each other, and one ‘anti-symmetric’ where the dipoles oscillate out of phase with each other. The eigenmodes can be determined numerically by treating each atom as a driven classical electric dipole with fixed polarization (see Supplementary Material). Fig. 1a plots the decay rate and lineshift of the symmetric (dark blue) and anti-symmetric (light blue) modes for varying atomic spacing after a laser pulse with duration. As decreases, the magnitudes of both and spiral outwards. Putting the dipoles side-by-side perpendicularly to the propagation direction of the laser beam means that both atoms see an identical driving field such that the overlap between the field vector and the anti-symmetric mode vector is zero, leaving just the symmetric mode. For , the decay rate of the symmetric eigenmode is . The fluorescence in the forward direction at the end of the driving pulse is plotted in Fig. 1c, where is the total collected signal and is the signal during the steady state of the driving pulse in the absence of atoms. As soon as the driving field is switched off, the signal decays exponentially as with a constant decay rate of (Fig. 1e, where we define the decay rate as ), equal to the decay rate of the symmetric eigenmode which entirely determines the atomic dynamics. For the resonance lineshape of the steady state (inset, Fig. 1c), we also observe a Lorentzian with Full-Width–Half-Maximum (FWHM) and linecentre at around zero detuning , again as predicted by the single symmetric eigenmode.
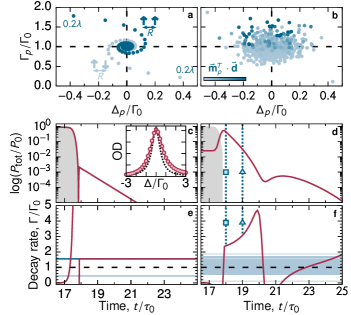
The picture is significantly more complicated when there are many atoms which are arranged randomly. In Fig. 1b,d,f we consider atoms in a cigar shaped cloud (Gaussian density distribution with standard deviations (radial) and (axial), using the experimental parameters and ) centred at the focus of a circularly polarised probe. In Fig. 1b we observe that for a single realisation, many of the possible eigenmodes now couple strongly to the driving field (dark blue markers), resulting in a time-dependent decay rate (f). 111The coupling strength between any individual eigenmode and the driving field is determined by the mode overlap between the two. A changing decay rate is a natural consequence of faster superradiant modes decaying away, leaving only the slower subradiant modes Guerin et al. (2016). However, simulations reveal an oscillatory behaviour and the effective decay rate can even temporarily become negative. Because of this oscillation, the initial decay rate () is actually faster than the decay of even the fastest single collective eigenmode () 222Our claim is not that the decay is faster than but rather the fastest possible eigenmode decay for an eigenmode of the considered configuration333For further analysis of the eigenmodes, see Fig. S1 of [SuppMat]. This effect has also recently been seen in numerical simulations of a similar system Cottier et al. (2018). The reason for this faster initial decay and oscillation is that shifted frequencies of the eigenmodes (dispersion in the eigenfrequencies) also significantly affect the dynamical behaviour. As we saw for the pair of atoms in Fig. 1a,c,e, each individual eigenmode is a mode of oscillation with its own distinct decay rate and resonance frequency. The total scattered field is then a sum of the emission from individual eigenmodes with shifted frequencies. These eigenfrequencies beat against each other and interfere. This interference can artificially change the transient decay rate and can thus result in decay rates significantly faster than any individual mode. The plots in Fig. 1 are for a single realization, although the behavior does not change significantly when averaging over many random realizations.
We employ the experimental setup shown in Fig. 2a, details of which can be found elsewhere Busche et al. (2016, 2017). In summary, a microscopic, cigar-shaped ensemble of a few thousand cold 87Rb atoms is confined in tightly focussed optical tweezers with estimated dimensions of (radial) and (axial). The circularly polarised probe light (see Fig. 2b) is tightly focussed into the ensemble (-waist radius ) with detuning from the transition at with a natural linewidth of . Both probe and trap light are focussed using an aspheric lens (focal length , numerical aperture ). The light emitted from the ensemble in the forward direction is collected by a second, identical lens and detected behind a single-mode fibre which is aligned onto the mode of the incoming probe beam.
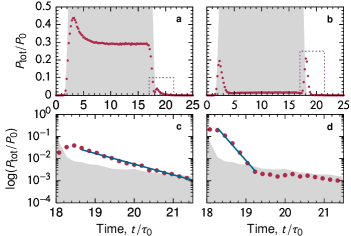
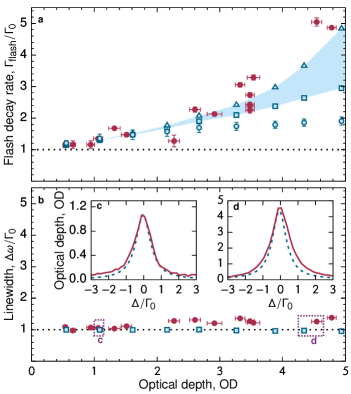
Fig. 3 shows the experimental signal before, during, and after the optical driving pulse, for low (a,c) and high (b,d) atomic density. As in the numerics, we observe a flash after the pulse is switched off which decays exponentially for to before noise obscures the signal. Comparing the fitted decay rates with the numerical decay rates 444We quote the numerical decay rate immediately after and one lifetime after the pulse is switched off, as this corresponds to the shortest overall time window in any of our experiments before the signal became dominated by noise, Fig. 3d. in Fig. 4a we find that both experiment and theory demonstrate a clear positive trend of increasing initial decay rate with increasing optical depth [see [SuppMat] for details on determining and varying ], which are both in excess of even the fastest eigenmode decay rate (blue cirles). The increase with (and thus with increasing number density as the cloud dimensions remain similar) is further evidence of the superradiance being a collective effect Araújo et al. (2016). Contrary to numerical simulations, we do not observe any oscillation of the decay rate during the specified time window. This could be a result of the higher atomic density required or the short accessible time window in the experiment.
Time–frequency correspondence implies that a change to the decay rate produces a change to the linewidth. For example, the decay rate and Full-Width–Half-Maximum (FWHM) linewidth for any given eigenmode are both . However, despite the significant increase in the initial decay rate, we find that both experimentally and numerically there is relatively little increase in the linewidth. Initially, this seems counterintuitive and unphysical, but the linewidth–decay-rate correspondence does not take into account the large interferences we observe between the different eigenmode frequencies. Our decay rate window is defined only for the first one lifetime, where the superradiant modes are dominant. This picture is incomplete, as we have observed that within this time period the decay rate can vary greatly and be independent of linewidth. Investigation times are ultimately limited by the signal-to-noise ratio, defining the experimentally accessible region, and this must be accounted for when comparing decay rates and linewidths.
There is good agreement between experiment and theory in the steady state lineshapes and overall trend of the linewidth and decay rate. One surprise is that we need far fewer atoms ( for the maximum optical depth in Fig. 4) in the simulations than we expect there to be in the experiment (). This could imply that there are fewer atoms in the experiment than expected or that the numerics overestimates the true optical depth, which would also explain why the numerical decay rates and linewidths tend to be lower than the experimental ones. Other factors including beam misalignment, trap distortion or atomic dephazing may also have an effect. We are confident that we are in the weak driving regime, as the mean photon number per pulse is and also the measured decay rate is unaffected by varying the driving strength.
In summary, we have observed that interference between eigenmodes of collectively excited ensembles of optical dipoles can lead to counter-intuitive emission dynamics with decay rates seemingly faster than any individual superradiant eigenmode. The results presented imply a profound rethink of our understanding of light-matter interactions, in particular the relationship between resonance width and lifetime no longer necessarily holds in the presence of collective effects, especially when only considering dynamics over a short period of time. At the same time, the good agreement between our simulations and experimental data provides a solid foundation to exploit collective mode engineering for applications in quantum technology.
Acknowledgements.
R.J.B. thanks K. Mølmer and J. Ruostekoski for illuminating discussions. This project has received funding from the European Union’s Horizon 2020 research and innovation programme under grant agreement No. 640378 (FET-PROACT project “RySQ”). This project has received funding from the European Union’s Horizon 2020 research and innovation programme under grant agreement No. 660028 (Marie Skłodowska-Curie Individual Fellowship to P.H.). This project has received funding from the European Union’s Horizon 2020 research and innovation programme under grant agreement No. 845218 (Marie Skłodowska-Curie Individual Fellowship to H.B.). We acknowledge funding from EPSRC through grant agreements EP/M014398/1 (“Rydberg soft matter”), EP/R002061/1 (“Atom-based Quantum Photonics”), EP/L023024/1 (“Cooperative quantum optics in dense thermal vapours”), EP/P012000/1 (“Solid State Superatoms”), EP/R035482/1 (“Optical Clock Arrays for Quantum Metrology”), EP/S015973/1 (“Microwave and Terahertz Field Sensing and Imaging using Rydberg Atoms”), as well as, DSTL, and Durham University. R.J.B acknowledges financial support from the CELLEX-ICFO-MPQ Research Fellowships, MINECO Severo Ochoa Grant No. SEV 2015-0522, CERCA Programme/Generalitat de Catalunya, and Fundacio Privada Cellex. The data presented in this letter are available at (DOI TO BE ADDED IN PROOF).References
- Guerin et al. (2016) W. Guerin, M. O. Araújo, and R. Kaiser, Phys. Rev. Lett. 116, 083601 (2016).
- Facchinetti et al. (2016) G. Facchinetti, S. D. Jenkins, and J. Ruostekoski, Phys. Rev. Lett. 117, 243601 (2016).
- Meir et al. (2014) Z. Meir, O. Schwartz, E. Shahmoon, D. Oron, and R. Ozeri, Phys. Rev. Lett. 113, 193002 (2014).
- Javanainen et al. (2017) J. Javanainen, J. Ruostekoski, Y. Li, and S.-M. Yoo, Phys. Rev. A 96, 033835 (2017).
- Peyrot et al. (2018) T. Peyrot, Y. R. P. Sortais, A. Browaeys, A. Sargsyan, D. Sarkisyan, J. Keaveney, I. G. Hughes, and C. S. Adams, Phys. Rev. Lett. 120, 243401 (2018).
- Roof et al. (2016) S. J. Roof, K. J. Kemp, M. D. Havey, and I. M. Sokolov, Phys. Rev. Lett. 117, 073003 (2016).
- Corman et al. (2017) L. Corman, J. L. Ville, R. Saint-Jalm, M. Aidelsburger, T. Bienaimé, S. Nascimbène, J. Dalibard, and J. Beugnon, Phys. Rev. A 96, 053629 (2017).
- Cottier et al. (2018) F. Cottier, R. Kaiser, and R. Bachelard, Phys. Rev. A 98, 013622 (2018).
- Guerin and Kaiser (2017) W. Guerin and R. Kaiser, Phys. Rev. A 95, 053865 (2017).
- Bromley et al. (2016) S. L. Bromley, B. Zhu, M. Bishof, X. Zhang, T. Bothwell, J. Schachenmayer, T. L. Nicholson, R. Kaiser, S. F. Yelin, M. D. Lukin, A. M. Rey, and J. Ye, Nat. Commun. 7, 11039 (2016).
- Araújo et al. (2016) M. O. Araújo, I. Krešić, R. Kaiser, and W. Guerin, Phys. Rev. Lett. 117, 073002 (2016).
- Jenkins et al. (2016) S. D. Jenkins, J. Ruostekoski, J. Javanainen, S. Jennewein, R. Bourgain, J. Pellegrino, Y. R. P. Sortais, and A. Browaeys, Phys. Rev. A 94, 023842 (2016).
- Jennewein et al. (2016) S. Jennewein, M. Besbes, N. J. Schilder, S. D. Jenkins, C. Sauvan, J. Ruostekoski, J.-J. Greffet, Y. R. P. Sortais, and A. Browaeys, Phys. Rev. Lett. 116, 233601 (2016).
- Jennewein et al. (2018) S. Jennewein, L. Brossard, Y. R. P. Sortais, A. Browaeys, P. Cheinet, J. Robert, and P. Pillet, Phys. Rev. A 97, 053816 (2018).
- Keaveney et al. (2012) J. Keaveney, A. Sargsyan, U. Krohn, I. G. Hughes, D. Sarkisyan, and C. S. Adams, Phys. Rev. Lett. 108, 173601 (2012).
- Jenkins and Ruostekoski (2013) S. D. Jenkins and J. Ruostekoski, Phys. Rev. Lett. 111, 147401 (2013).
- Hopkins et al. (2013) B. Hopkins, A. N. Poddubny, A. E. Miroshnichenko, and Y. S. Kivshar, Phys. Rev. A 88, 053819 (2013).
- Bradac et al. (2017) C. Bradac, M. T. Johnsson, M. van Breugel, B. Q. Baragiola, R. Martin, M. L. Juan, G. K. Brennen, and T. Volz, Nat. Commun. 8, 1205 (2017).
- Röhlsberger et al. (2010) R. Röhlsberger, K. Schlage, B. Sahoo, S. Couet, and R. Rüffer, Science 328, 1248 (2010).
- van Loo et al. (2013) A. F. van Loo, A. Fedorov, K. Lalumiere, B. C. Sanders, A. Blais, and A. Wallraff, Science 342, 1494 (2013).
- Mlynek et al. (2014) J. A. Mlynek, A. A. Abdumalikov, C. Eichler, and A. Wallraff, Nat. Commun. 5, 5186 (2014).
- Svidzinsky et al. (2010) A. A. Svidzinsky, J. T. Chang, and M. O. Scully, Phys. Rev. A 81, 053821 (2010).
- Dicke (1954) R. Dicke, Phys. Rev. 93, 99 (1954).
- Gross and Haroche (1982) M. Gross and S. Haroche, Phys. Rep. 93, 301 (1982).
- Bettles et al. (2016) R. J. Bettles, S. A. Gardiner, and C. S. Adams, Phys. Rev. Lett. 116, 103602 (2016).
- Shahmoon et al. (2017) E. Shahmoon, D. S. Wild, M. D. Lukin, and S. F. Yelin, Phys. Rev. Lett. 118, 113601 (2017).
- Manzoni et al. (2018) M. T. Manzoni, M. Moreno-Cardoner, A. Asenjo-Garcia, J. V. Porto, A. V. Gorshkov, and D. E. Chang, New J. Phys. 20, 083048 (2018).
- Scuri et al. (2018) G. Scuri, Y. Zhou, A. A. High, D. S. Wild, C. Shu, K. De Greve, L. A. Jauregui, T. Taniguchi, K. Watanabe, P. Kim, M. D. Lukin, and H. Park, Phys. Rev. Lett. 120, 037402 (2018).
- Mahmoodian et al. (2018) S. Mahmoodian, M. Čepulkovskis, S. Das, P. Lodahl, K. Hammerer, and A. S. Sørensen, Phys. Rev. Lett. 121, 143601 (2018).
- Scully (2009) M. O. Scully, Phys. Rev. Lett. 102, 143601 (2009).
- do Espirito Santo et al. (2020) T. S. do Espirito Santo, P. Weiss, A. Cipris, R. Kaiser, W. Guerin, R. Bachelard, and J. Schachenmayer, Phys. Rev. A 101, 013617 (2020).
- Haroche (1976) S. Haroche, High-Resolution Laser Spectroscopy, Vol. 13 (Springer, 1976) p. 253.
- Whiting et al. (2017) D. J. Whiting, N. Šibalić, J. Keaveney, C. S. Adams, and I. G. Hughes, Phys. Rev. Lett. 118, 253601 (2017).
- Chalony et al. (2011) M. Chalony, R. Pierrat, D. Delande, and D. Wilkowski, Phys. Rev. A 84, 011401(R) (2011).
- Kwong et al. (2014) C. C. Kwong, T. Yang, M. S. Pramod, K. Pandey, D. Delande, R. Pierrat, and D. Wilkowski, Phys. Rev. Lett. 113, 223601 (2014).
- Kwong et al. (2015) C. C. Kwong, T. Yang, D. Delande, R. Pierrat, and D. Wilkowski, Phys. Rev. Lett. 115, 223601 (2015).
- Note (1) The coupling strength between any individual eigenmode and the driving field is determined by the mode overlap between the two.
- Note (2) Our claim is not that the decay is faster than but rather the fastest possible eigenmode decay for an eigenmode of the considered configuration.
- Note (3) For further analysis of the eigenmodes, see Fig. S1 of [SuppMat].
- Busche et al. (2016) H. Busche, S. W. Ball, and P. Huillery, Eur. Phys. J. Spec. Top. 225, 2839 (2016).
- Busche et al. (2017) H. Busche, P. Huillery, S. W. Ball, T. Ilieva, M. P. Jones, and C. S. Adams, Nat. Phys. 13, 655 (2017).
- Note (4) We quote the numerical decay rate immediately after and one lifetime after the pulse is switched off, as this corresponds to the shortest overall time window in any of our experiments before the signal became dominated by noise, Fig. 3d.