Electronic states realized by the interplay
between Li diffusion and Co3+Co4+ charge ordering in LixCoO2
Abstract
Measurements of dc magnetization () and electrical resistivity () have been carried out as a function of temperature () for layered oxide LixCoO2 (0.511.0) using single crystal specimens. After slow cooling of the specimens down to 10 K, both of the () and () curves are found to exhibit a clear anomaly due to the occurrence of Co3+Co4+ charge ordering (CO) at 155 K for 0.60.98 (at 180190 K for 0.50.55). After rapid cool of the specimens, additional anomalies are observed related to the onset of Li diffusion at 370 K andor =120130 K. Due to phase mixing with compositions of nearly LiCoO2 and Li2/3CoO2, the specimens with 0.70.9 show anomalies both at and . For 0.60.9, the resistivity measured after rapid cooling is found to be fairly larger than that measured after slow cooling below . The enhanced resistivity can be explained by the scenario that disordered Co3+Co4+ arrangements, which have been observed and revealed to have an insulating electronic structure contrasting to the regular CO state in the previous scanning tunneling microscopy measurements [Phys. Rev. Lett. 111, 126104 (2013)], are realized due to the formation of an amorphous-like structure of Li ions after rapid cooling via interlayer Coulomb coupling. An electronic phase diagram for 0.51.0 is proposed.
I Introduction
Li-ion batteries are now being widely used for mobile electronic devices and also electric vehicles, and have been the subject of intensive study to improve storage capacity and longevity.goodenough ; nitta One of the most common cathode materials used in commercial Li-ion batteries with high-energy density and a proper application voltage is layered oxide LixCoO2, in which both Li and Co atoms are octahedrally coordinated by oxygen atoms, forming a two-dimensional (2D) regular triangular lattice in each layer, and each layer is alternatively stacked along the c-axis. Much attention has been focused on the high mobility of Li ions in LixCoO2 for the application but various unconventional physical natures are expected as in the related material NaxCoO2, which has a similar structure consisting of Na and CoO2 layers. Indeed, NaxCoO2 has been under intensive study for the past two decades due to the various intriguing electronic properties, such as a large thermoelectric power (0.7),terasaki superconductivity (5 K) in the hydrated compound (0.35),takeda an insulating ground state induced by charge ordering (0.5),foo ; yokoi ; gasparovic ; ning a mass-enhanced Fermi-liquid ground state analogous to LiV2O4miyoshi , a spin-density-wave state,motohashi in addition to the characteristic Na order,zand ; chou1 ; weller ; meng ; roger ; julien ; morris ; alloul ; mukhamedshin ; schulze ; galeski ; medarde which has been found to be linked with Co3+Co4+ charge disproportionation, meng ; roger ; julien ; morris ; alloul ; mukhamedshin magnetic ordering,schulze ; galeski and structural transitions.medarde
In both compounds, Co ions are in a mixed valence state consisting of Co3+ () and Co4+ () having spins of =0 and =12, respectively,ray since the deintercalation of Li or Na ions from the mother compounds generates Co4+ on the 2D triangular lattice of Co3+. Thus, a hole doping in the orbital can be made by the deintercalation in LixCoO2, where the electrical resistivity drastically decreases and a metallic behavior appears in the () curve with decreasing from 1.0 to 0.9.menetrier ; kellerman ; miyoshi10 ; motohashi11 ; lin One of the most characteristic features of LixCoO2 is the Co3+Co4+ charge ordering (CO), which has been inferred from sharp anomalies observed in the dc magnetization,kellerman ; sugiyama05 ; mukai07 ; hertz ; motohashi09 resistivitymiyoshi10 ; motohashi11 , and specific heatmiyoshi10 data at =150170 K in wide range of , and found to have a characteristic 30∘ arrangement of Co4+ by recent scanning tunneling microscopy (STM) observations and density functional theory (DFT) calculations.iwaya
The ordering of Co3+Co4+ can be strongly affected by the dynamics of Li ions via interlayer Coulomb coupling. In a previous study, we have reported that the dc magnetization () versus temperature () curve measured after rapid cooling of the specimens is different from that measured after slow cooling below 120 K for =0.66,miyoshi10 suggesting that Li ions stop diffusing and become ordered below , since is similar to and determined by the measurements of NMRnakamura and muon spin rotation (SR)sugiyama09 , respectively, as the temperature below which Li ions start diffusing. The origin of the difference below is attributed to the difference in the Co3+Co4+ arrangement, which is expected to be disordered when the Li ions form an amorphous-like structure as in a glassy state after a rapid cooling down to a temperature far below . Indeed, it has been revealed in the previous STM observations at 5 K for Li0.66CoO2 that there is some disordered area on the crystal surface where the CO state is destroyed and an insulating gap in the spectrum is detected. Thus, the cooling-rate-dependent Li ordering might play a decisive role in determining the Co3+Co4+ arrangement.
High-quality single-crystal specimens of LixCoO2 used in the previous study have enabled us to understand the electronic properties through microscopic measurementsiwaya ; ikedo ; mizokawa ; simonelli ; okamoto , but the interplay between Li diffusion and Co3+Co4+ ordering, and the evolution of the charge ordering for the delithiation have remained unsolved. In the present paper, we have performed dc magnetization and electrical resistivity measurements for LixCoO2 using single-crystal specimens with a systematic change of Li content (0.51.0) to shed further light on the problems. It has been found that electrical resistivity for the specimens with 0.60.9 measured after rapid cooling of the specimens becomes much larger than that measured after slow cooling below 155 K. The results are consistent with the above-mentioned scenario that the region where the CO state is destroyed, having an insulating electronic structure, appears due to the amorphous-like structures in the Li layers induced by the rapid cooling. We have proposed an electronic phase diagram for 0.51.0 based on the results of the measurements using 12 single-crystal specimens with different .
II Experiment
Single crystal specimens of LixCoO2 (0.511.0) were obtained by chemically delithiating from LiCoO2 single-crystals, as described in a previous report.miyoshi10 In the first step, single crystals of Na0.75CoO2 were grown in an optical floating-zone furnace in a similar manner as described in the literature.chou04 The obtained single crystal rods of Na0.75CoO2 were crushed into small pieces, and then cleaved into thin slices with a thickness of 0.2 mm. In the next step, to obtain LiCoO2 single crystals by ion exchange reactions, the cleaved Na0.75CoO2 single crystals were embedded in Li2CO3 powder in an alumina boat, and heated 600 for 24 h in air, and then repeatedly washed with acetonitrile to remove Li2CO3 and Na2CO3. After annealing these crystals at 900 for 24 h in air, single crystal specimens of pristine LiCoO2 were obtained, which have a plate-like shape with a typical dimension of 220.2 mm3. In the final step, the delithiation from pristine LiCoO2 crystals was carried out by chemically extracting lithium using NO2BF4 as the oxidizer. The reaction was carried out in an argon atmosphere by immersing LiCoO2 crystals in an acetonitrile solution of NO2BF4 and heating at 50 for 72 h in a pressure vessel with a Teflon liner, and finally washed to remove LiBF4 by acetonitrile. The Li content (0.511.0) in the crystals was controlled by the molar ratio between LiCoO2 and NO2BF4 ranging from 1 : 0 (=1.0) to 1 : 1.5 (=0.51), and was determined by inductively coupled plasma atomic emission spectroscopy (ICP-AES) using a Perkin-Elmer Optima 2000 DV instrument. For all specimens, a part of the single crystal was crushed into powder and the phase purity of the specimens was confirmed by powder x-ray diffraction (XRD) measurements with a 2 range from 10∘ to 90∘ using a Rigaku RINT2200 diffractometer with Cu radiation. Almost all of the peaks were found to be ascribed to the LixCoO2 compound. XRD patterns of some specimens prepared by the same procedures for 10∘90∘ can be seen in the previous report.miyoshi10 dc magnetization measurements were performed by a Quantum Design magnetic property measurement system (MPMS). Electrical resistivity was measured by a standard four-probe technique. For the resistivity measurements, specimens were cooled by using a Gifford-McMahon (GM) refrigerator or a cryostat of the MPMS.
III Results and Discussion
III.1 Powder x-ray diffraction
The phase mixing of two hexagonal structures had been observed earlier in LixCoO2 for 0.750.90 through XRD measurements.menetrier ; motohashi09 ; reimers ; ohzuku ; amatucci ; ishida To investigate the evolution of the phase separation with decreasing , we focus here on the (003) reflection observed in the powder XRD measurements. As shown in Fig. 1(a), we observe a (003) peak accompanied by a shoulder at the lower angle side for =0.83 and 0.88, corresponding to the phase separation, but a (003) single peak for 0.961.0. Also, we observe a double peak for =0.73 and 0.75 but a single peak again for 0.64. As shown in Fig. 1(b), we can extract two components from the peak for 0.710.91. We assign the component with a smaller (larger) lattice constant as the hexagonal phase (I) [hexagonal phase (II)], which has higher (lower) Li content.why1 In Fig. 1(c), the lattice constant is plotted as a function of . Furthermore, we estimated the molar fraction of the hexagonal phase (I) (=) and (II) (=) for each from the integrated intensity of the peak. The results are plotted in Fig. 1(d), where it is shown that the system evolves from phase (I) to phase (II) with decreasing via the phase mixing state for 0.650.95. The variation of and shown in Fig. 1(d) is consistent with that observed in an earlier work.ishida
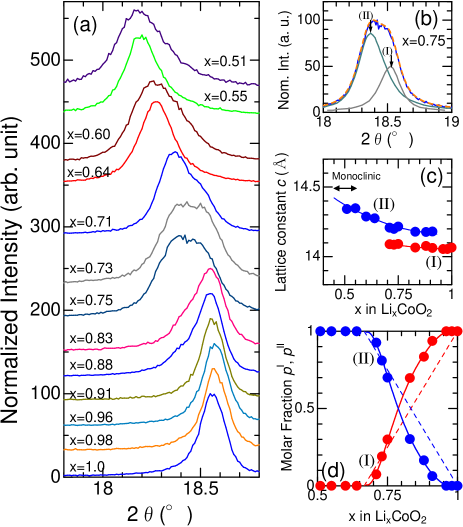
Here, we discuss the composition of the hexagonal phases (I) and (II). It is interesting to note that a small anomaly at which indicates the emergence of the CO state is observed even for a slightly delithiated specimen with =0.98 in the electrical resistivity and dc magnetization data, as seen later in Figs. 2(b) and 3(b). These behaviors let us imagine a simple situation that phases (I) and (II) are composed of LiCoO2 (=1.0) and Li2/3CoO2, respectively, and in the latter the CO state emerges below 155 K. Assuming this, the molar fraction of phases (I) and (II) can be given by the dashed lines shown in Fig. 1(d). Although the evolution of the molar fraction with decreasing is quadratic rather than linear, the end of the mixing state appears to be at around =23 as well as the simple model described by the dotted lines. Thus, for 0.91.0, it is likely that a part of the introduced Co4+ ions by the delithiation develops Li2/3CoO2 domains [phase (II)], while the rest provides holes to the LiCoO2 (=1.0) region [phase (I)], leading to a rapid decrease in electrical resistivity with decreasing , as seen later in Figs. 2(a)-2(c). The scenario explains why increases slower than the dashed line as decreasing . As discussed later, phases (I) and (II) can be regarded to have compositions of 1.0 and , respectively.
III.2 Electrical resistivity
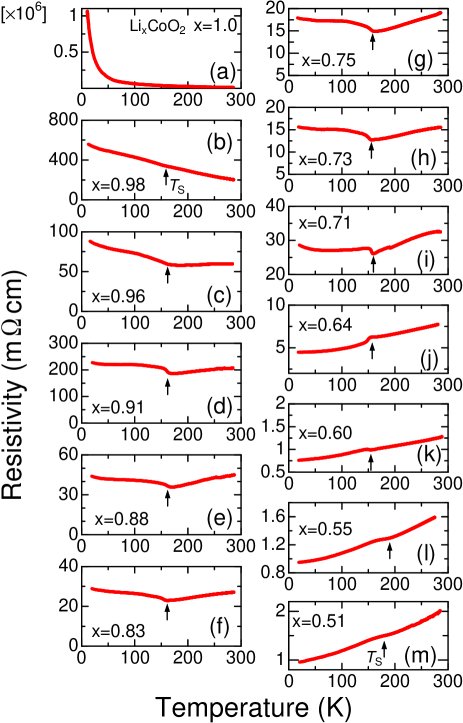
We show the temperature dependence of electrical resistivity () for LixCoO2 (0.511.0) in Figs. 2(a)-2(m). The data were collected during heating from 10 K to room temperature after slow cooling of the specimens by using a GM refrigerator at an averaged cooling rate 2 Kmin. As seen in Fig. 2(a), the curve for LiCoO2 (=1.0) shows an insulating behavior. The () curves for =0.98 and 0.96 in Figs. 2(b) and 2(c) also show an insulating behavior but the amplitude of resistivity is fairly smaller than that for =1.0. We should also note that both of the curves exhibit a slight anomaly at 155 K. These behaviors are consistent with the picture described in the previous section that the delithiation for 0.91.0 gives rise to hole doping in the LiCoO2 region [phase (I)] and also the construction of the Li2/3CoO2 domains [phase (II)], where the CO state appears below 155 K.
The () curves for 0.730.91 show a qualitatively similar temperature dependence, which is metallic above but insulating below . In contrast, the () curve for 0.64 shows a metallic behavior above and below . The metallic behavior below is consistent with the results of the DFT calculation and the STM observation on the CO state, both of which have revealed the metallic electronic structure of the CO state.iwaya The origin of the insulating behavior observed below for 0.73 is unclear but is likely to be related to the fact that the cobalt ions could not build a uniform CO state throughout the sample but a disordered one due to an excess of Co3+ for 23. As mentioned already, an insulating electronic structure has been revealed in the disordered CO state.iwaya It should be also noted that changes from 155 K for 0.600.98 to 180-190 K for =0.51 and 0.55. The different values at 12 could be a signature of the formation of another Co3+Co4+ arrangement with Co3+: Co4+= 1 : 1. Hereafter, we call the CO state with a formation of Co3+: Co4+= 2 : 1 and 1 : 1 as the CO23 and CO12 states, respectively.
III.3 dc magnetization
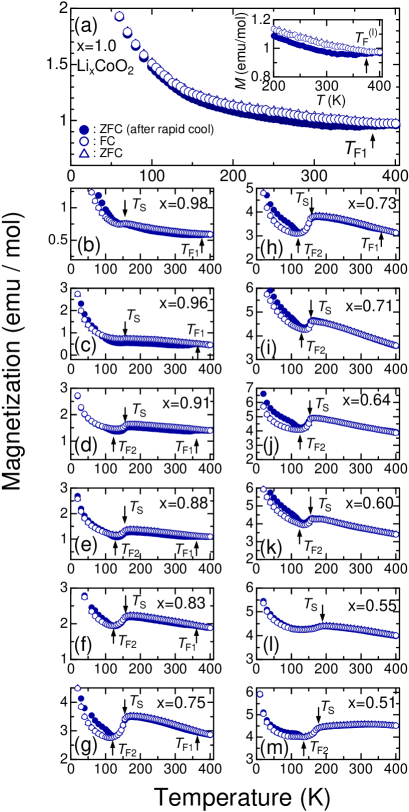
In Figs. 3(a)-3(m), the temperature dependences of dc magnetization () measured in a magnetic field parallel to the plane under zero-field-cooled (ZFC) and field-cooled (FC) conditions for the specimens with =0.511.0 are shown. The data were collected at first with increasing temperature from 10 K after rapid cooling of the specimens from 400 to 10 K in zero field, and then collected with increasing temperature after slow cooling at a cooling rate of 10 Kmin from 400 K in a magnetic field of =1 T and in zero field. For the rapid cooling, the specimens were quickly inserted in the chamber of a magnetometer kept at 10 K, after the specimens were taken from an oven heated above 400 K and quenched in acetonitrile to room temperature. The () curves for =1.0 in Fig. 3(a) measured after slow cooling show a Curie-Weiss type paramagnetic behavior without any difference between the curves in the ZFC and FC conditions. The () [=()] curves are fitted with the formula, = + (), yielding a constant susceptibility =7.9310-5 emu/mol/Oe, a Curie constant =7.2910-3 emumolKOe, and a Weiss temperature =4.80 K. An effective magnetic moment per Co ions is given to be =0.241 , which is very small but is similar to that obtained in the previous work for =0.99,miyoshi10 since Co3+ is supposed to be in the low spin state with =0.
The () curve for =1.0 measured after rapid cooling becomes different from those measured after slow cooling below 370 K. The () curves for =0.98 and 0.96 in Figs. 3(b) and 3(c) exhibit a slight anomaly at 155 K, in addition to the difference below . Furthermore, the () curves for 0.730.91 in Figs. 3(d)-3(h) show an abrupt decrease below , which is followed by an additional splitting below 120 K. The () curves for 0.600.71 in Figs. 3(i)-3(k) are similar to those observed for 0.730.91 but have no difference below 370 K. As mentioned in the Introduction, and are related to the temperatures, below which Li ions stop diffusing and order at the regular site. The difference in the amplitude of is attributed to the difference in the ordering pattern of Co3+Co4+, which depends on whether the Li ions sit on the regular site after slow cooling or exhibit amorphous-type ordering due to the glass-like freezing of Li+ motions after rapid cooling.miyoshi10 ; iwaya and seen in Figs. 3(a)-3(k) are thought to be related to the onset of the freezing of Li+ motions in the hexagonal phase (I) with 1.0 and the phase (II) with 23, respectively. The range for which anomalies are observed both at and is almost consistent with the nominal phase mixing region (0.70.9).
It is interesting to note that the amplitude of measured after rapid cooling is enhanced below but coincides with the () curve measured after slow cooling above . The behavior appears to be remarkable for 0.600.83. The enhancement of the amplitude of below is consistent with the destruction of the CO23 state after rapid cooling, since the charge disordered state (liquid state) above shows an enhanced amplitude compared with that below . One may consider that the intermediate state between and after rapid cooling is identical to the CO23 state realized after slow cooling. However, it will be seen later in Figs. 4(a) and 4(b) that those states may be similar but are not identical to each other. Another interesting feature is that the () curve for =0.55 measured after rapid cooling in Fig. 3(l) shows a broad anomaly at 190 K, much higher than of other specimens, and no visible anomaly at . The () curve for =0.51, however, shows sharp anomalies at 175 K and 135 K again, both of which are somewhat higher than those for 0.60. As noted in the previous section, the different may denote an emergence of the CO12 state. The possible mechanism is discussed later.
III.4 Enhanced resistivity measured after rapid cooling
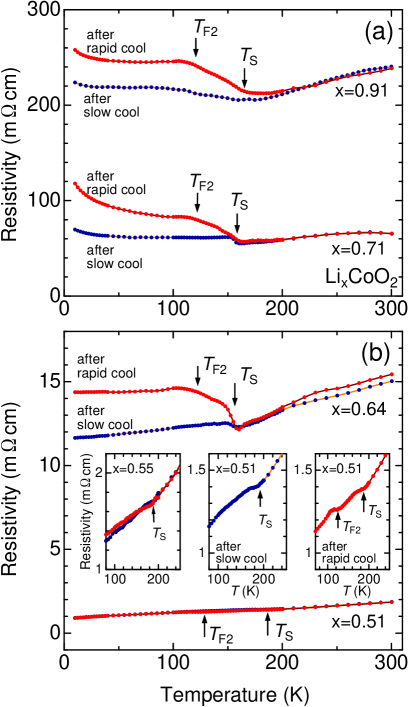
Previous STM observations at 5 K have revealed an insulating electronic structure in the region where disordered arrangements of Co3+Co4+ ions are observed.iwaya Therefore, in the case where Li ions have an amorphous-like disordered structure after rapid cooling, by which the CO state would be destroyed due to the interlayer Coulomb coupling, the electrical resistivity is expected to be extremely enhanced compared with that after slow cooling. Local distortions on the CoO2 layers induced by the amorphous-like structure of the Li ions may also contribute to the destruction of the CO2/3 state. To confirm the behavior described above, we have examined the () curve after rapid cooling for some specimens. For the () measurements, we used a cryostat of the MPMS. Rapid cooling of the specimens was done by the rapid insertion of the sample rod in the chamber of the magnetometer kept at 10 K. The results are displayed in Figs. 4(a) and 4(b). As seen in the figures, the () curves measured after rapid cooling for =0.64, 0.71 and 0.91 are found to be markedly enhanced compared with those after slow cooling below . The enhancement of resistivity at 10 K attains 70 of the original value for =0.71. Thus, we have certainly confirmed that Li ions probably enter an amorphous-like state after rapid cooling and destroy the CO23 state. A significant difference between the resistivity measured after slow and rapid cooling has been observed in some materials that undergo a metal-insulator transition. In these materials, a metastable high-temperature low-resistivity state are realized at low temperature by rapid cooling after pulsed laser heating.oike ; kagawa If our specimens are cooled more rapidly after local heating by pulsed laser radiation, the enhancement is expected to be more significant.
In contrast, for =0.51, the () curve after rapid cooling is not enhanced compared with that after slow cooling, as shown in the insets (center and right) of Fig. 4(b). For =0.51, an appearance of the CO12 state is expected but STM observations have never been conducted on the specimens with 0.5, so that the electronic properties of the state are unclear at the present stage. The results suggest either that the CO arrangement is not destroyed by the amorphous-like ordering of Li ions or that the arrangement is destroyed but the disordered state is also metallic. We also show the () curves for =0.55 in the left inset of Fig. 4(b), where no anomaly is observed at in both curves, which is the same as the () curves for =0.55 in Fig. 3(l). We should note here that all the () curves after rapid cooling in Figs. 4(a) and 4(b) show an anomaly not only at but also at , showing a broad peak just below . On the other hand, () curves after slow cooling show an anomaly only at . These features are consistent with those observed in the () curves. has been regarded as the temperature below which Li ions stop diffusing and enters into a solid state, since a characteristic splitting in the () curves has been observed depending on the cooling process below 120 K.miyoshi10 However, the () curves in Figs. 4(a) and 4(b) exhibits a splitting below , suggesting that Li ions start diffusing above rather than . Considering the interlayer Coulomb coupling, it is more likely that the ordering of Li ions also enters a liquid state above simultaneously with the transition of Co ions from the CO state to a charge liquid state. If so, what happens at ? Some amorphous metals, called metallic glasses, demonstrate a two-step transition from an amorphous glass state () to a liquid state () via an intermediate supercooled liquid state ().zhang91 ; peker One of the most exciting scenario is that the intermediate state between and in LixCoO2 is analogous to a supercooled liquid state observed in metallic glasses. To elucidate this, further investigations to confirm the thermodynamical properties by the measurements of specific heat and differential scanning calorimetry after rapid cooling of the specimens are desirable for a future study.
III.5 Ordering features and phase diagram
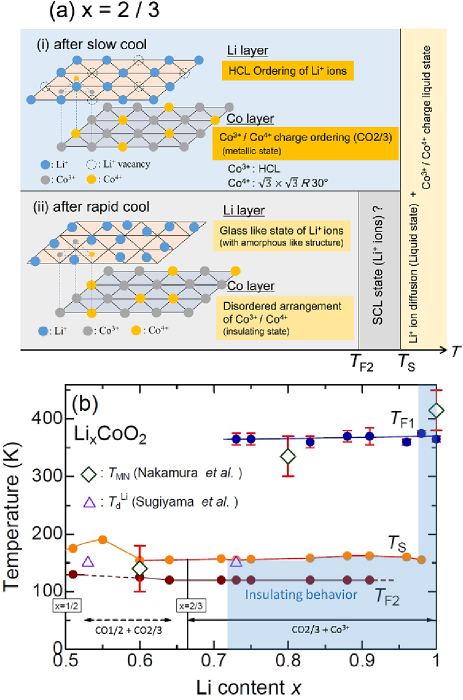
Here, we show the schematic image of the ordering in the Li and Co layers for =23 at low temperatures in Fig. 5(a). Above , Li ions can diffuse in the layers, and Co3+Co4+ ions are in a charge liquid state. After slow cooling, Li+ and Co3+ ions form a honey comb lattice (HCL) below , while Co4+ ions form a characteristic 30∘ structure.iwaya Contrasting to the regular structures after slow cooling, Co3+Co4+ ions have a disordered arrangement after rapid cooling, as discussed in the previous section. Also, it is inferred that Li ions are frozen in an amorphous state from a liquid state by rapid cooling, leading to a disordered Co3+Co4+ arrangement due to the interlayer Coulomb coupling. Amorphous structures in the Li layers have been also inferred for the specimen with =0.99 to explain the large thermal history dependence in the () curve below 380 K, which originates from the difference in the ordering pattern of Li ions depending on the cooling rate.miyoshi10 In the case that the Li site is fully occupied, the only way to give a different Li ordering pattern is to build an amorphous structure. For , we propose that the Li ions enter a supercooled liquid (SCL) state.
Next, we focus on the dependences of , and , which are summarized in Fig. 5(b). We notice that these temperatures are almost independent of , suggesting that the hexagonal phase (I) [phase (II)] has a similar composition of LiCoO2 (Li2/3CoO2) throughout for 0.731.0 (0.60.98). In Fig. 5(b), we also plot and determined by 7Li NMRnakamura and +SR experimentssugiyama09 , respectively, above which Li ions start diffusing. We note here that for =0.8 has been observed only for hexagonal phase (I),nakamura so that has a single value even in the two-phase region. and are shown to be consistent with and . Finally, we discuss how the charge ordering changes with decreasing from =, since an appearance of the CO state is expected at 0.5. The important point to note is the anomalous behaviors at =0.55, where is fairly enhanced and the anomaly at is absent in the () and () curves. The most plausible scenario is that the CO state survives with an excess of Co4+ for , but the CO state begins to coexist below certain and competes with the CO state near =0.55, and then the CO state becomes dominant for . Due to the competition between the CO and CO states, both arrangements of Li+ and Co3+Co4+ could be disordered even after slow cooling. Under the circumstance, we may expect either that Li ions do not undergo the transition at or that the arrangement of Co3+Co4+ remains disordered even across . In both cases, no anomaly would be observed at . Assuming that all Co3+Co4+ ions contribute to either CO or CO domains, the critical value of at which the occupied area by the CO and CO states is totally equivalent (i.e., the molar fraction = 3 2) is estimated to be 7120.583. The value is close to 0.55. The elucidation for the CO state and the ordering of Li ions at =0.5 by the combined study of the STM observation and DFT calculation must be the important step to understand the overall feature of LixCoO2
IV Summary
In the present paper, we have investigated the low temperature magnetic and electrical properties of LixCoO2 (0.511.0) using single-crystal specimens. The CO state has been found to appear in the wide range 0.600.98. In the powder XRD measurements, we have observed mixed hexagonal phases (I) and (II) for 0.710.91, each of which has a different lattice parameter , in other words, different Li content. Taking also the results of the () and () measurements into account, it is suggested that the composition of phase (I) [phase (II)] is nearly LiCoO2 (Li2/3CoO2), where the Li ions start diffusing above 370 K (120 K). Furthermore, we have successfully observed that the () curves are fairly enhanced after rapid cooling of the specimens below 155 K, as an evidence of the occurrence of the disordered Co3+Co4+ arrangement with an insulating electronic structure, which is led by an amorphous-like formation of Li ions. It is inferred that the CO state, which has an arrangement with Co3+ Co4+=1 1, is realized at and competes with the CO state for a certain range around =0.55. We have also suggested that the state after rapid cooling between and can be regarded as a supercooled liquid state as seen in metallic glass materials. Finally, we should note that LixCoO2 is a high energy cathode material for Li ion batteries, but also an electron system, which provides us a great opportunity to encounter unique low-temperature properties related to the Li ion dynamics, being a potential material to exhibit a rapid-cooling-induced giant resistivity which is led by a different mechanism. Great attention should be paid to the progress of these studies.
Acknowledgements.
The authors thank H. Katsube and K. Mihara for their technical assistance.References
- (1) J. B. Goodenough and Y. Kim, Chem. Mater. 22, 587 (2010).
- (2) N. Nitta, F. Wu and J. T. Lee, G. Yushin, Mater. Today 18, 587 (2015).
- (3) I. Terasaki, Y. Sasago, and K. Uchinokura, Phys. Rev. B 56, R12685 (1997).
- (4) K. Takeda, H. Sakurai, E. Takayama-Muromachi and F. Izumi, Nature 422, 53 (2003).
- (5) M. L. Foo, Y. Wang, S. Watauchi, H. W. Zandbergen, T. He, R. J. Cava and N. P. Ong, Phys. Rev. Lett. 92, 247001 (2004).
- (6) M. Yokoi, T. Moyoshi, Y. Kobayashi, M. Soda, Y. Yasui, M. Sato, and K. Kakurai, J. Phys. Soc. Japan 74, 3046 (2005).
- (7) G. Gsparovi, R. A. Ott, J. -H. Cho, F. C. Chou, Y. Chu, J. W. Lynn and Y. S. Lee, Phys. Rev. Lett. 96, 046403 (2006).
- (8) F. L. Ning, S. M. Golin, K. Ahilan, T. Imai, G. J. Shu, and F. C. Chou, Phys. Rev. Lett. 100, 086405 (2008).
- (9) K. Miyoshi, E. Morikuni, K. Fujiwara, J. Takeuchi, and T. Hamasaki, Phys. Rev. B 69, 132412 (2004).
- (10) T. Motohashi, R. Ueda, E. Naujalis, T. Tojo, I. Terasaki, T. Atake, M. Karppinen, and H. Yamauchi, Phys. Rev. B 67, 064406 (2003).
- (11) H. W. Zandbergen, M. L. Foo, Q. Xu, V. Kumar, and R. J. Cava, Phys. Rev. B 70, 024101 (2004).
- (12) F. C. Chou, M. -W. Chu, G. J. Shu, F.-T. Huang, W. W. Pai, H. S. Sheu, and P. A. Lee, Phys. Rev. Lett. 101, 127404 (2008).
- (13) M. Weller, A. Sacchetti, H. R. Ott, K. Mattenberger, and B. Batlogg, Phys. Rev. Lett. 102, 056401 (2009).
- (14) Y. S. Meng, A. Van der Ven, M. K. Y. Chan, and G. Ceder, Phys. Rev. B 72, 172103 (2005).
- (15) M. Roger, D. J. P. Morris, D. A. Tennant, M. J. Gutmann, J. P. Goff, J.-U. Hoffmann, R. Feyerherm, E. Dudzik, D. Prabhakaran, A. T. Boothroyd, N. Shannon, B. Lake, and P. P. Deen, Nature (London) 445, 631 (2007).
- (16) M. -H. Julien, C. de Vaulx, H. Mayaffre, C. Berthier, M. Horvati, V. Simonet, J. Wooldridge, G. Balakrishnan, M. R. Lees, D. P. Chen, C. T. Lin, and P. Lejay, Phys. Rev. Lett. 100, 096405 (2008).
- (17) D. J. P. Morris, M. Roger, M. J. Gutmann, J. P. Goff, D. A. Tennant, D. Prabhakaran, A. T. Boothroyd, E. Dudzik, R. Feyerherm, J.-U. Hoffmann, and K. Kiefer, Phys. Rev. B 79, 100103(R) (2009).
- (18) H. Alloul, I. R. Mukhamedshin1, T. A. Platova1, and A. V. Dooglav, EuroPhys. Lett. 85, 47006 (2009).
- (19) I. R. Mukhamedshin, A. V. Dooglav, S. A. Krivenko, and H. Alloul, Phys. Rev. B 90, 115151 (2014).
- (20) T. F. Schulze, P. S. Hfliger, Ch. Niedermayer, K. Mattenberger, S. Bubenhofer, and B. Batlogg, Phys. Rev. Lett. 100, 026407 (2008).
- (21) M. Medarde, M. Mena, J. L. Gavilano, E. Pomjakushina, J. Sugiyama, K. Kamazawa, V. Yu. Pomjakushin, D. Sheptyakov, B. Batlogg, H. R. Ott, M. Ma°nsson, and F. Juranyi, Phys. Rev. Lett. 110, 266401 (2013).
- (22) S. Galeski, K. Mattenberger, and B. Batlogg, Phys. Rev. B 94, 140402(R) (2016).
- (23) R. Ray, A. Ghoshray, K. Ghoshray, and S. Nakamura, Phys. Rev. B 59, 9454 (1999).
- (24) M. Mntrier, I. Saadoune, S. Levasseur, and C. Delmas, J. Mater. Chem. 9, 1135 (1999).
- (25) D. G. Kellerman, V. R. Galakhov, A. S. Semenove, Ya. N. Blinvskov, and O. N. Leonidova, Phys. Solid State 48, 548 (2006).
- (26) K. Miyoshi, C. Iwai, H. Kondo, M. Miura, S. Nishigori, and J. Takeuchi, Phys. Rev. B 82, 075113 (2010).
- (27) T. Motohashi, Y. Sugimoto, Y. Masubuchi, T. Sasagawa, W. Koshibae, T. Tohyama, H. Yamauchi, and S. Kikkawa, Phys. Rev. B 83, 195128 (2011).
- (28) Q. Lin, Q. Li, K. E. Gray, and J. F. Mitchell, J. Cryst. Growth Des. 12, 1232 (2012).
- (29) J. Sugiyama, H. Nozaki, J. H. Brewer, E. J. Ansaldo, G. D. Morris, and C. Delmas, Phys. Rev. B 72, 144424 (2005).
- (30) K. Mukai, Y. Ikedo, H. Nozaki, J. Sugiyama, K. Nishiyama, D. Andreica, A. Amato, P. L. Russo, E. J. Ansaldo, J. H. Brewer, K. H. Chow, K. Ariyoshi, and T. Ohzuku, Phys. Rev. Lett. 99, 087601 (2007).
- (31) J. T. Hertz, Q. Huang, T. McQueen, T. Klimczuk, J. W. G. Bos, L. Viciu, and R. J. Cava, Phys. Rev. B 77, 075119 (2008).
- (32) T. Motohashi, T. Ono, Y. Sugimoto, Y. Masubuchi, S. Kikkawa, R. Kanno, M. Karppinen, and H. Yamauchi, Phys. Rev. B 80, 165114 (2009).
- (33) K. Iwaya, T. Ogawa, T. Minato, K. Miyoshi, J. Takeuchi, A. Kuwabara, H. Moriwake, Y. Kim, and T. Hitosugi, Phys. Rev. Lett. 111, 126104 (2013).
- (34) K. Nakamura, H. Ohno, K. Okamura, Y. Michihiro, T. Moriga, I. Nakabayashi, and T. Kanashiro, Solid State Ionics 177, 821 (2006).
- (35) J. Sugiyama, K. Mukai, Y. Ikedo, H. Nozaki, M. Mansson, and I. Watanabe, Phys. Rev. Lett. 103, 147601 (2009).
- (36) K. Ikedo, Y. Wakisaka, T. Mizokawa, C. Iwai, K. Miyoshi, and J. Takeuchi, Phys. Rev. B 82, 075126 (2010).
- (37) T. Mizokawa, Y. Wakisaka, T. Sudayama, C. Iwai, K. Miyoshi, J. Takeuchi, H. Wadati, D. G. Hawthorn, T. Z. Regier, and G. A. Sawatzky, Phys. Rev. Lett. 111, 056404 (2013).
- (38) L. Simonelli, E. Paris, C. Iwai, K. Miyoshi, J. Takeuchi, T. Mizokawa, and N. L. Saini, J. Phys.:Condens. Matter 29, 105702 (2017).
- (39) Y. Okamoto, R. Matsumoto, T. Yagihara, C. Iwai, K. Miyoshi, J. Takeuchi, K. Horiba, M. Kobayashi, K. Ono, H. Kumigashira, N. L. Saini, and T. Mizokawa, Phys. Rev. B 96, 125147 (2017).
- (40) F. C. Chou, J. H. Cho, P. A. Lee, E. T. Abel, K. Matan, and Y. S. Lee, Phys. Rev. Lett. 92, 157004 (2004).
- (41) J. N. Reimers and J. R. Dahn, J. Electrochem. Soc. 139, 2091 (1992).
- (42) T. Ohzuku and A. Ueda, J. Electrochem. Soc. 141, 2972 (1994).
- (43) G. G. Amatucci, J. M. Tarascon, and L. C. Klein, J. Electrochem. Soc., 143, 1114 (1996).
- (44) Y. Ishida, A. Mizutani, K. Sugiura, H. Ohta, and K. Koumoto, Phys. Rev. B 82, 075325 (2010).
- (45) Generally, layered oxides xCoO2 (=alkali metal) have a tendency to have a larger lattice constant for smaller , because the interlayer Coulomb interactions are reduced and the interlayer distance is increased with decreasing the concentration of alkali ions.
- (46) H. Oike, F. Kagawa, N. Ogawa, A. Ueda, H. Mori, M. Kawasaki, and Y. Tokura, Phys. Rev. B 91, 041101(R) (2015).
- (47) F. Kagawa and H. Oike, Adv. Mater. 29, 1601979 (2017).
- (48) T. Zhang, A. Inoue, and T. Masumoto, Mater. Trans., JIM, 32, 1005 (1991).
- (49) A. Peker and W. L. Johnson, Appl. Phys. Lett. 63, 2342 (1995).