Model Building of Metal Oxide Surfaces and
Vibronic Coupling Density as a Reactivity Index:
Regioselectivity of CO2 Adsorption on Ag-loaded Ga2O3
Yasuro Kojima1, Wataru Ota1,2, Kentaro Teramura1,3, Saburo Hosokawa1,3, Tsunehiro Tanaka1,3, Tohru Sato1,2,3*
1 Department of Molecular Engineering, Graduate School of Engineering, Kyoto University, Nishikyo-ku, Kyoto 615-8510, Japan
2 Fukui Institute for Fundamental Chemistry, Kyoto University, Sakyo-ku,
Kyoto 606-8103, Japan
3 Unit of Elements Strategy Initiative for Catalysts & Batteries, Kyoto University, Nishikyo-ku, Kyoto 615-8510, Japan
(Dated: Augast 23, 2018)
000* Corresponding author at: Fukui Institute for Fundamental Chemistry, Kyoto University, Takano Nishihiraki-cho 34-4 Sakyo-ku, Kyoto 606-8103, Japan.Email address: tsato@scl.kyoto-u.ac.jp
Abstract
The step-by-step hydrogen-terminated (SSHT) model is proposed as a model for the surfaces of metal oxides. Using this model, it is found that the vibronic coupling density (VCD) can be employed as a reactivity index for surface reactions. As an example, the regioselectivity of CO2 adsorption on the Ag-loaded Ga2O3 photocatalyst surface is investigated based on VCD analysis. The cluster model constructed by the SSHT approach reasonably reflects the electronic structures of the Ga2O3 surface. The geometry of CO2 adsorbed on the Ag-loaded Ga2O3 cluster has a bent structure, which is favorable for its photocatalytic reduction to CO.
1 Introduction
Heterogeneous catalysis, particularly for reactions between molecules and solid surfaces, has been extensively studied [1]. To design heterogeneous catalysts and understand of their mechanisms, the sites for molecular adsorption on the solid catalyst must be clarified. The adsorption sites can be predicted theoretically by finding the position of a molecule on a surface that has the lowest energy of all possible positions on the surface. However, it is impractical to calculate all the energies because, in general, there are many adsorption sites for a molecule on a solid surface. Therefore, a reactivity index to predict the adsorption sites based only on the information of solid surface is desirable.
Previously, we identified the regioselectivity of cycloaddition to fullerene [2, 3, 4], matallofullerene [5], and large polycyclic aromatic hydrocarbons [6] using the vibronic coupling density (VCD) as the reactivity index. Vibronic coupling, the coupling between electron and nuclear vibrations, stabilizes a system by structural relaxation after charge transfer. The VCD as a function of a position identifies the reactive sites as those where the vibronic coupling is large. It is expected that the VCD can be utilized as a reactivity index for systems with various reactive sites, such as solid surfaces.
-Ga2O3 is a heterogeneous catalyst that reduces CO2 to CO using H2 as a reductant under photoirradiation [7, 8]. The selectivity of CO2 reduction is increased by modifying -Ga2O3 with Ag, which acts as a cocatalyst [9, 10, 11, 12, 13]. H2O, which is abundant, is used as the reductant in the Ag-loaded Ga2O3 system. In this study, we applied VCD to the Ag-loaded Ga2O3 surface to show the effectiveness of VCD as a reactivity index for CO2 adsorption on the surface. This is the first report of the application of VCD to a solid surface and could provide the basis for extending the applicability of VCD to solid surfaces in general.
Reactivity indices, such as the frontier orbital density or VCD, strongly depend on the electronic structure of the frontier level. When building a model for the surface reactions of metal oxides based on a bulk crystal structure, the treatment of dangling bonds strongly affects the electronic structure. For instance, because hydrogen termination for dangling bonds involves electron doping, the frontier level is shifted by hydrogen termination. In this study, to build a model for the subsequent calculations, we employed a step-by-step hydrogen-terminated (SSHT) approach to reproduce the experimental observations.
In Sec. 2, we describe the theory of vibronic coupling. In Sec. 3, we describe the computational methods. In Sec. 4.1, we present a method to build a cluster model of the Ag-loaded Ga2O3 surface by the SSHT approach. In Sec. 4.2, we investigate the regioselectivity of CO2 adsorption on Ag-loaded Ga2O3 cluster using VCD as the reactivity index. Finally, in Sec. 5, we present the conclusions of this study.
2 Theory
In the early stage of chemical reactions, charge transfer occurs between reactants by intermolecular orbital interactions. Following charge transfer, the system is further stabilized by intramolecular deformation. This structural relaxation is induced by vibronic coupling. The vibronic coupling constant (VCC) , which quantitatively evaluates the strength of vibronic couplings, is defined by [14, 15]
| (1) |
where is the total energy of the charge-transfer state, and is the equilibrium geometry before charge transfer. is the reaction coordinate along the nuclear vibration that gives the largest vibronic coupling
| (2) |
where is a normal coordinate and is the VCC of vibrational mode .
The VCD is provided by the integrand of the VCC,
| (3) |
Since is a function of the spatial coordinate , gives the local information about the VCC. The VCD can be divided into electronic and vibrational contributions:
| (4) |
is the electron density difference between neutral and charge-transfer states, and is the potential derivative defined as the derivative of the potential acting on an electron from all the nuclei with respect to . The total differential of the chemical potential which is a functional of the number of electrons and is given by [14]
| (5) |
where is the absolute hardness. In terms of the chemical reactivity theory proposed by R. G. Parr and W. Yang [16, 17], the preferred direction for a reagent approaching a species is the one for which the initial is the maximum. The first term on the right-hand side of Eq. (5) is less direction sensitive than the second term. Thus, the preferred direction can be said to be that for which the of a species is a maximum.
3 Computational method
For the calculations of the VCC and VCD, we first optimized the geometry of a neutral Ag-loaded Ga2O3 cluster and performed a vibrational analysis. Then, we calculated the forces acting on the nuclei for the neutral optimized structure in a cationic state. The charge-transfer state was chosen to be a cationic state because we assume that an electron is transferred from the Ag-loaded Ga2O3 surface to CO2 in the reduction of CO2. Finally, we determined the adsorbed structure of CO2 on the Ag-loaded Ga2O3 cluster by geometry optimization. The computational level was set at the B3LYP/6-31G(d,p) level for the Ga, O, and H atoms and at the B3LYP/LANL2TZ level for the Ag atom. The core electrons in the Ag atom were replaced by effective core potentials. These calculations were performed using GAUSSIAN 09 [18, 19]. The VCC and VCD were calculated using our own code.
4 Results
4.1 Cluster model of Ag-loaded Ga2O3 surface
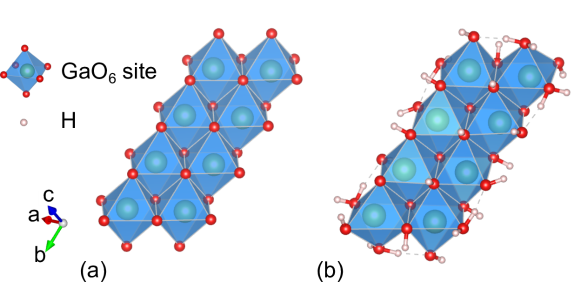
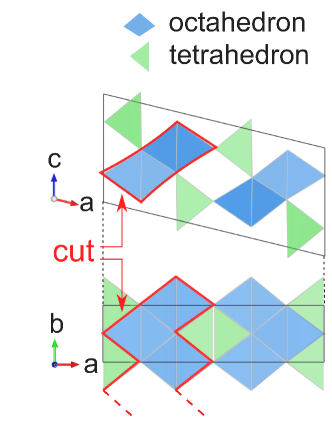
-Ga2O3 consists of Ga atoms located at the octahedral and tetrahedral sites formed by O atoms [20, 21], as illustrated in Figure S1 in the Supplementary Material. The octahedra share edges whereas the tetrahedra share corners in the -axis direction. The tetrahedra also share corners with the octahedra. We expected that the electrons used for the reduction of CO2 migrate through the octahedra shared edges. In this study, eight adjacent octahedral sites are employed as a bare cluster model of the -Ga2O3 surface (Figure 1 (a)).
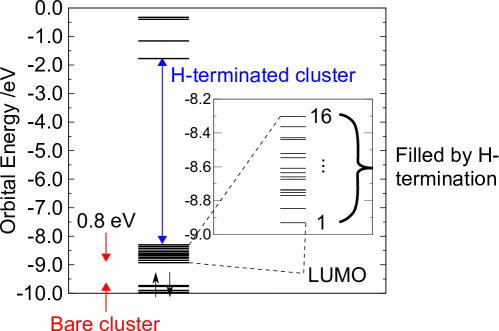
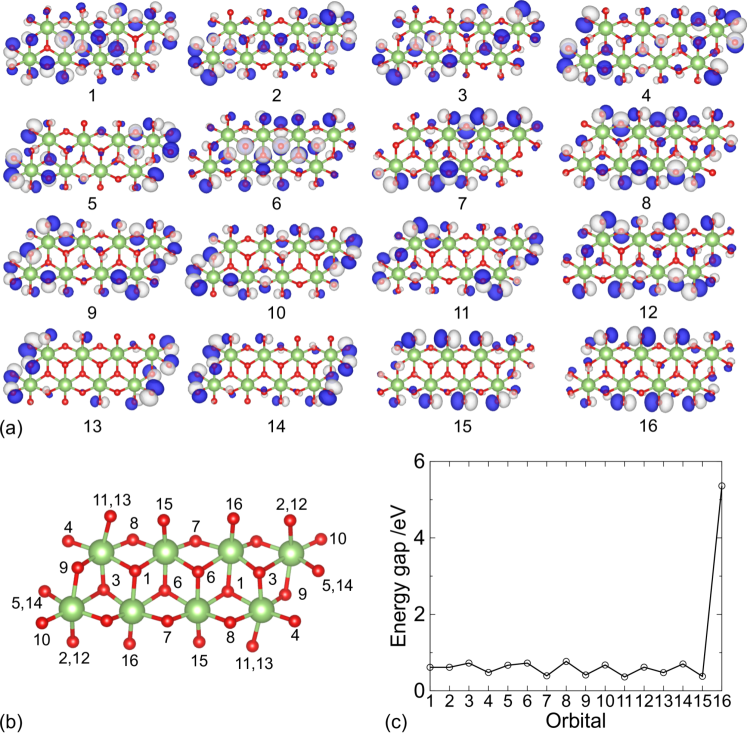
Figure 2 shows the calculated orbital levels of the bare cluster. The band gap of -Ga2O3 has been experimentally estimated to be 4.6 eV [11]. However, the energy gap of the bare cluster is 0.8 eV, which is much smaller than the experimental value. This is because the occupied molecular orbitals become unoccupied when the cluster is cut from the crystal structure. The bare cluster has reactive dangling bonds arising from the cleavage of O atoms. The dangling bonds at the O atoms are terminated by H atoms because it has been experimentally observed that H atoms are adsorbed on the Ga2O3 surface [8]. The hydrogen termination, which involves electron doping, shifts the frontier level. The 16 unoccupied molecular orbitals must be occupied for the model to have a reasonably wide energy gap. Thus, the 32 H atoms, i.e., 2 H atoms for each unoccupied molecular orbital, are step-by-step bonded to O atoms with large molecular orbital coefficients. As a result, we obtained the hydrogen-terminated cluster with an energy gap of 5.4 eV after geometry optimization. Figure S2 in the Supplementary Material shows in detail the process of step-by-step hydrogen termination. Hereafter, we refer to this hydrogen terminated cluster as the SSHT model for the Ga2O3 surface. Figure 1 (b) shows the optimized structure of the SSHT model.
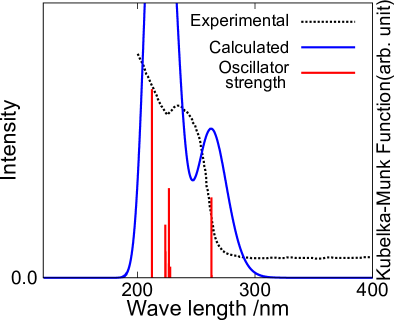
The diffuse reflectance spectrum of the SSHT cluster model is evaluated to examine its reliability. The spectrum , which depends on the absorption energy , is calculated from the oscillator strengths multiplied by the Gaussian distribution function,
| (6) |
where is the oscillator strength of a transition from S0 to the Franck–Condon Si states, and is the excitation energy from S0 to the Franck–Condon Si states. The value of is restricted between 1 and 10. The values of and were calculated using time-dependent density functional theory. Here, is the variance of the Gaussian distribution function and was set to 0.05 eV2. Figure 3 shows a comparison of the experimental and calculated diffuse reflectance spectrum [11]. Although the calculated spectrum is shifted to the long-wavelength region with respect to the experimental spectrum, the two peaks of the calculated spectrum at 219 and 263 nm are also observed experimentally. Thus, the SSHT cluster is suitable for use as a model for the Ga2O3 surface.
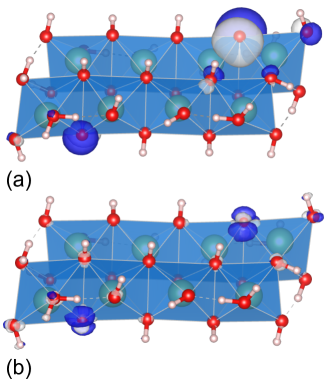
It should be noted that, in the SSHT cluster model, H atoms are not bonded to all O atoms, although all the dangling bonds are terminated by H atoms. There are 20, 6, and 2 O atoms with which 1, 2, and 0 H atoms are bonded, respectively. The O atoms without hydrogen termination have a pair of electrons, and, thus, act as Lewis bases. This is supported by the highest occupied molecular orbital (HOMO) of the SSHT cluster model, as shown in Figure 4 (a), which is strongly localized on the O atoms without hydrogen termination. This result indicates that these O atoms donate electrons to the reactants. The HOMO is doubly degenerate because the Lewis basic O atoms are located at both the front and back surfaces of the SSHT cluster model. Figure 4 (b) shows the VCD of the SSHT cluster model, which is also localized on the O atoms without hydrogen termination. The stabilization arising from the structural relaxation after charge transfer is large at the sites where the VCD is localized. Therefore, the Ag-loaded Ga2O3 surface is modeled by placing a single Ag atom on one of the Lewis basic O atoms in the SSHT cluster model. The Cartesian coordinates of the SSHT cluster model for the Ga2O3 and Ag-loaded Ga2O3 surfaces are given in Tables S1 and S2 of the Supplementary Material.
4.2 Regioselectivity of CO2 adsorption on Ag-loaded Ga2O3 cluster
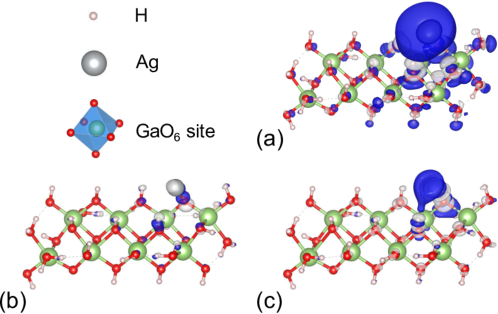
Figure 5 shows the electron density difference , the potential derivative , and the VCD of the Ag-loaded Ga2O3 cluster. Here, , the electron density difference between the neutral and cationic states, is delocalized around the Ag atom because the electron is mainly extracted from the Ag atom. is large at the Ag and adjacent O atoms. Consequently, , which is given by the product of and , is localized on the Ag atom as well as on the O atoms located near the Ag atom. Since is distributed over the Ag atom and the O atoms at the surface of the Ga2O3 cluster, structural relaxation occurs between the Ag atom and the Ga2O3 cluster following charge transfer. This result implies that catalytic activity depends on the type of solid surface on which the Ag atom is loaded.
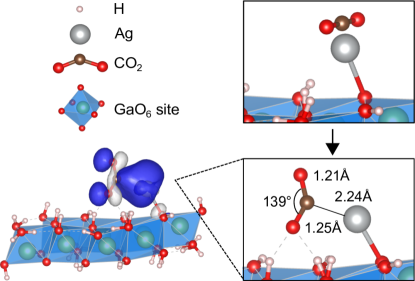
Geometry optimization is performed after the initial position of CO2 is set above the Ag atom, as shown in Figure 6. The adsorbed structure of CO2 is found to have an O-C-O angle of 139∘ and O-C distances of 1.21 and 1.25 Å. The adsorbed structure is obtained in the region where the VCD is localized. The adsorption energy of CO2 is defined by
| (7) |
where , , and are the energies of isolated CO2, isolated Ag-loaded Ga2O3 cluster, and CO2 on the cluster, respectively. The of CO2 is calculated to be 0.58 eV, indicating that the CO2 with a bent structure is favorably adsorbed on the Ag-loaded Ga2O3 cluster.
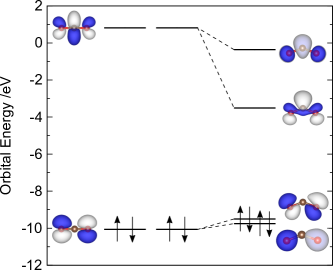
The reduction of CO2 to CO is favored when the LUMO level of CO2 is low [22] because electrons are transferred from the Ag-loaded Ga2O3 surface to CO2 for the reduction of CO2. Figure 7 shows the frontier orbital levels of CO2 with a linear structure and the structure extracted from Figure 6. The LUMO level of bent CO2 is lower than that of the linear structure although bent CO2 is energetically unstable. Thus, the Ag-loaded Ga2O3 surface on which bent CO2 can be favorably adsorbed is suitable for CO2 reduction. As shown in Figure 6, the HOMO of CO2 on the Ag-loaded Ga2O3 cluster is similar to the LUMO of bent CO2 and Ag orbitals, leading to charge transfer from the Ag-loaded Ga2O3 cluster to CO2. The natural charges of the Ag atom are found to change from -0.03 to 0.48 upon CO2 adsorption.
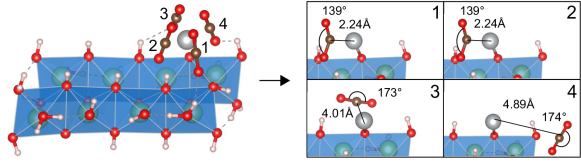
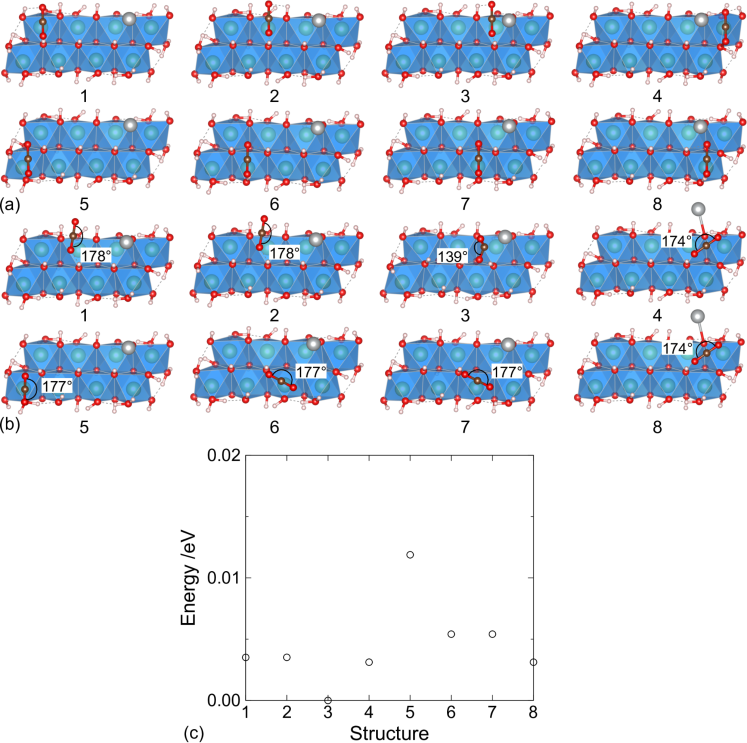
Geometry optimizations are performed by changing the initial positions of CO2 to examine the dependence of the adsorbed structure. The initial positions of CO2 are prepared such that CO2 surrounds the Ag atom where is distributed. Although can also be used as a reactivity index, it tends to be delocalized compared to the VCD. Figure 8 shows the optimized structures obtained for each initial CO2 position. Optimized structures 1 and 2 in Figure 8 are the same as that in Figure 6. In structures 3 and 4, CO2 has a linear structure that is unfavorable for the reduction of CO2. Furthermore, the of CO2 for structures 3 and 4 are calculated to be 0.47 and 0.30 eV, respectively. These values are smaller than the values of for structures 1 and 2 of 0.58 eV. Therefore, the adsorption of CO2 in the region where the VCD is localized is advantageous for the CO2 reduction, as well as being the most stable of the optimized structures. Consequently, the regioselectivity of CO2 adsorption is clearly indicated by the VCD because of the considerations of the vibronic contribution to the stabilization of the system in contrast to , which only considers the electronic contribution. As shown in Figure S3 of the Supplementary Material, the optimized structures obtained by placing CO2 on Ga atoms are energetically unstable compared to the structure obtained by the VCD analysis.
5 Conclusion
A cluster model of the Ga2O3 photocatalyst surface is constructed by terminating dangling bonds with H atoms. The H atoms are bonded to O atoms with large orbital coefficients for each unoccupied orbitals such that the cluster model has an energy gap in agreement with the experimental values. The O atoms without hydrogen termination act as Lewis bases. This process of building a cluster model for metal oxide surfaces is termed as the step-by-step hydrogen-terminated (SSHT) approach. The vibronic coupling density (VCD) of the Ag-loaded Ga2O3 cluster is evaluated to identify the adsorption sites for CO2. Thus, the VCD is an effective reactivity index for determining the regioselectivity of CO2 adsorption on the Ag-loaded Ga2O3 surface. We also found that CO2 with a bent structure, which is advantageous for photocatalytic reduction, is adsorbed on the Ag atom.
Acknowledgments
This work was supported by the Elements Strategy Initiative for Catalysts and Batteries (ESICB). The calculations were partly performed using the Supercomputer Laboratory of Kyoto University and Research Center for Computational Science, Okazaki, Japan.
References
- [1] G. Ertl, H. Knözinger, F. Schüth, J. Weitkamp, Handbook of Heterogeneous Catalysis, 2nd ed., Wiley-VCH, Weinheim, 2008.
- [2] N. Haruta, T. Sato, K. Tanaka, J. Org. Chem. 77 (2012) 9702.
- [3] T. Sato, N. Iwahara, N. Haruta, K. Tanaka, Chem. Phys. Lett. 531 (2012) 257.
- [4] N. Haruta, T. Sato, K. Tanaka, Tetrahedron 70 (2014) 3510.
- [5] N. Haruta, T. Sato, K. Tanaka, J. Org. Chem. 80 (2014) 141.
- [6] N. Haruta, T. Sato, K. Tanaka, Tetrahedron Lett. 56 (2015) 590.
- [7] K. Teramura, H. Tsuneoka, T. Shishido, T. Tanaka, Chem. Phys. Lett. 467 (2008) 191.
- [8] H. Tsuneoka, K. Teramura, T. Shishido, T. Tanaka, J. Phys. Chem. C 114 (2010) 8892.
- [9] K. Teramura, Z. Wang, S. Hosokawa, Y. Sakata, T. Tanaka, Chem. Eur. J. 20 (2014) 9906.
- [10] Z. Wang, K. Teramura, S. Hosokawa, T. Tanaka, J. Mater. Chem. A 3 (2015) 11313.
- [11] Z. Wang, K. Teramura, Z. Huang, S. Hosokawa, Y. Sakata, T. Tanaka, Catal. Sci. Technol. 6 (2016) 1025.
- [12] M. Yamamoto, T. Yoshida, N. Yamamoto, T. Nomoto, Y. Yamamoto, S. Yagi, H. Yoshida, J. Mater. Chem. A 3 (2015) 16810.
- [13] Y. Kawaguchi, M. Akatsuka, M. Yamamoto, K. Yoshioka, A. Ozawa, Y. Kato, T. Yoshida, J. Photochem. Photobiol. A 358 (2018) 459.
- [14] T. Sato, K. Tokunaga, K. Tanaka, J. Phys. Chem. A 112 (2008) 758.
- [15] T. Sato, K. Tokunaga, N. Iwahara, K. Shizu, K. Tanaka, in: H. Köppel, D. R. Yarkony, H. Barentzen (Eds.), Vibronic Coupling Constant and Vibronic Coupling Density in The Jahn-Teller Effect: Fundamentals and Implications for Physics and Chemistry, Springer-Verlag, Berlin and Hidelberg, 2009.
- [16] R. G. Parr, W. Yang, J. Am. Chem. Soc. 106 (1984) 4049.
- [17] R. G. Parr, W. Yang, Density-Functional Theory of Atoms and Molecules, Oxford University Press, New York, 1994.
- [18] M. J. Frisch et al., Gaussian 09, Revision D. 01, Gaussian, Inc., Wallingford CT, 2013.
- [19] M. J. Frisch et al., Gaussian 09, Revision E. 01, Gaussian, Inc., Wallingford CT, 2013.
- [20] S. Geller, J. Chem. Phys. 33 (1960) 676.
- [21] J. Åhman, G. Svensson, J. Albertsson, Acta Cryst. C 52 (1996) 1336.
- [22] H.-J. Freund, M. W. Roberts, Surf. Sci. Rep. 25 (1996) 225.
Supplementary Material
Model Building of Metal Oxide Surfaces and
Vibronic Coupling Density as a Reactivity Index:
Regioselectivity of CO2 Adsorption on Ag-loaded Ga2O3
Yasuro Kojima1, Wataru Ota1,2, Kentaro Teramura1,3, Saburo Hosokawa1,3, Tsunehiro Tanaka1,3, Tohru Sato1,2,3*
1 Department of Molecular Engineering, Graduate School of Engineering, Kyoto University, Nishikyo-ku, Kyoto 615-8510, Japan
2 Fukui Institute for Fundamental Chemistry, Kyoto University, Sakyo-ku, Kyoto 606-8103, Japan
3 Unit of Elements Strategy Initiative for Catalysts & Batteries, Kyoto University, Nishikyo-ku, Kyoto 615-8510, Japan
(Dated: Augast 23, 2018)
000* Corresponding author at: Fukui Institute for Fundamental Chemistry, Kyoto University, Takano Nishihiraki-cho 34-4 Sakyo-ku, Kyoto 606-8103, Japan.Email address: tsato@scl.kyoto-u.ac.jp
| No. | Atom | No. | Atom | ||||||
|---|---|---|---|---|---|---|---|---|---|
| 1 | Ga | -5.3237 | -0.8058 | 0.4860 | 35 | O | 6.8634 | 1.3493 | -1.3235 |
| 2 | Ga | -2.4557 | -1.1803 | 0.0074 | 36 | O | 5.2737 | 2.3049 | 1.0928 |
| 3 | Ga | 0.6034 | -1.4413 | 0.0528 | 37 | H | -2.3809 | 0.5814 | 1.7768 |
| 4 | Ga | 3.5952 | -1.7169 | 0.2520 | 38 | H | 2.3806 | -0.5806 | -1.7762 |
| 5 | Ga | -3.5954 | 1.7170 | -0.2521 | 39 | H | -5.7084 | -3.0520 | -0.6573 |
| 6 | Ga | -0.6033 | 1.4414 | -0.0521 | 40 | H | 5.7093 | 3.0523 | 0.6581 |
| 7 | Ga | 2.4559 | 1.1801 | -0.0061 | 41 | H | -3.5852 | -0.0498 | -2.1110 |
| 8 | Ga | 5.3241 | 0.8059 | -0.4877 | 42 | H | 3.5810 | 0.0465 | 2.1123 |
| 9 | O | -4.9979 | 2.4166 | -1.3014 | 43 | H | -4.7369 | 2.8743 | -2.1082 |
| 10 | O | -1.9662 | 2.1832 | -1.2603 | 44 | H | 4.7394 | -2.8780 | 2.1045 |
| 11 | O | 0.9521 | 1.8286 | -1.1128 | 45 | H | 6.4063 | 0.4370 | 1.7642 |
| 12 | O | 3.8076 | 1.5368 | -1.1815 | 46 | H | -6.4097 | -0.4352 | -1.7654 |
| 13 | O | -3.8080 | -1.5367 | 1.1820 | 47 | H | -0.6458 | -0.3062 | -1.9339 |
| 14 | O | -0.9520 | -1.8284 | 1.1139 | 48 | H | 0.6443 | 0.3063 | 1.9350 |
| 15 | O | 1.9664 | -2.1840 | 1.2606 | 49 | H | -1.1551 | -2.7065 | 1.4561 |
| 16 | O | 4.9990 | -2.4167 | 1.2993 | 50 | H | 1.1557 | 2.7076 | -1.4526 |
| 17 | O | -5.2730 | -2.3053 | -1.0932 | 51 | H | -1.8420 | 3.1377 | -1.3470 |
| 18 | O | -2.6127 | -2.6522 | -1.2060 | 52 | H | 1.8421 | -3.1388 | 1.3441 |
| 19 | O | 0.6586 | -2.8876 | -1.1689 | 53 | H | -5.7097 | 1.6024 | 0.9589 |
| 20 | O | 3.1106 | -3.3308 | -0.9146 | 54 | H | 5.7086 | -1.6026 | -0.9594 |
| 21 | O | -4.9008 | 1.0750 | 1.0385 | 55 | H | 6.6073 | 1.7510 | -2.1644 |
| 22 | O | -2.2019 | 0.6718 | 0.8309 | 56 | H | -6.6080 | -1.7503 | 2.1622 |
| 23 | O | 0.7317 | 0.3336 | 0.9746 | 57 | H | 3.6198 | -3.3427 | -1.7361 |
| 24 | O | 3.5772 | 0.0145 | 1.1510 | 58 | H | -3.6202 | 3.3411 | 1.7368 |
| 25 | O | -3.5778 | -0.0151 | -1.1498 | 59 | H | -4.2915 | -2.5481 | -1.1593 |
| 26 | O | -0.7319 | -0.3337 | -0.9734 | 60 | H | 4.2922 | 2.5476 | 1.1593 |
| 27 | O | 2.2015 | -0.6715 | -0.8304 | 61 | H | 2.0967 | -3.3029 | -1.1390 |
| 28 | O | 4.9001 | -1.0747 | -1.0393 | 62 | H | -2.0973 | 3.3026 | 1.1393 |
| 29 | O | -6.8635 | -1.3497 | 1.3206 | 63 | H | -5.9264 | 1.0324 | -1.3045 |
| 30 | O | -6.3660 | 0.1727 | -1.0146 | 64 | H | 5.9269 | -1.0315 | 1.3031 |
| 31 | O | -3.1113 | 3.3305 | 0.9150 | 65 | H | -0.1523 | -3.4128 | -1.1969 |
| 32 | O | -0.6595 | 2.8877 | 1.1698 | 66 | H | 0.1507 | 3.4138 | 1.1979 |
| 33 | O | 2.6135 | 2.6524 | 1.2064 | 67 | H | -2.3074 | -2.4901 | -2.1072 |
| 34 | O | 6.3659 | -0.1715 | 1.0137 | 68 | H | 2.3071 | 2.4913 | 2.1074 |
| No. | Atom | No. | Atom | ||||||
|---|---|---|---|---|---|---|---|---|---|
| 1 | Ag | 3.4721 | 0.9901 | 2.6839 | 36 | O | -7.2861 | -1.4287 | -0.9215 |
| 2 | Ga | 5.0152 | 0.5699 | -0.4111 | 37 | O | -5.5254 | -2.1278 | 1.4726 |
| 3 | Ga | 2.1368 | 1.0304 | -0.5291 | 38 | H | 2.0177 | -0.5219 | 1.4944 |
| 4 | Ga | -0.9058 | 1.3851 | -0.3358 | 39 | H | -2.8154 | 0.3464 | -1.9205 |
| 5 | Ga | -3.8739 | 1.7413 | 0.0414 | 40 | H | 5.4123 | 2.5685 | -1.8446 |
| 6 | Ga | 3.2169 | -1.9309 | -0.3957 | 41 | H | -6.0009 | -2.9146 | 1.1692 |
| 7 | Ga | 0.2420 | -1.5243 | -0.1789 | 42 | H | 3.3066 | -0.3939 | -2.4591 |
| 8 | Ga | -2.7873 | -1.1819 | 0.0537 | 43 | H | -3.6992 | 0.2321 | 2.0967 |
| 9 | Ga | -5.6848 | -0.8232 | -0.2682 | 44 | H | 4.1298 | -3.4437 | -2.1236 |
| 10 | O | 4.4839 | -2.8578 | -1.4458 | 45 | H | -4.8714 | 3.1355 | 1.8185 |
| 11 | O | 1.5526 | -2.4322 | -1.3223 | 46 | H | -6.5720 | -0.1702 | 2.0026 |
| 12 | O | -1.3805 | -1.9811 | -1.0918 | 47 | H | 6.1748 | -0.3780 | -2.5481 |
| 13 | O | -4.2244 | -1.6538 | -0.9690 | 48 | H | 0.2242 | 0.0160 | -2.2548 |
| 14 | O | 3.6392 | 1.5067 | 0.4331 | 49 | H | -0.8040 | -0.1199 | 1.7345 |
| 15 | O | 0.7329 | 1.8739 | 0.5495 | 50 | H | 0.9594 | 2.7516 | 0.8763 |
| 16 | O | -2.1660 | 2.2981 | 0.8613 | 51 | H | -1.6168 | -2.8966 | -1.2831 |
| 17 | O | -5.1896 | 2.5881 | 1.0922 | 52 | H | 1.3872 | -3.3842 | -1.3312 |
| 18 | O | 4.8647 | 1.8188 | -2.1216 | 53 | H | -2.0294 | 3.2545 | 0.8419 |
| 19 | O | 2.2856 | 2.2784 | -1.9727 | 54 | H | 5.4218 | -1.6329 | 0.7432 |
| 20 | O | -1.0294 | 2.6581 | -1.7372 | 55 | H | -6.0690 | 1.5225 | -0.9928 |
| 21 | O | -3.4568 | 3.1884 | -1.3476 | 56 | H | -7.1002 | -1.9333 | -1.7246 |
| 22 | O | 4.6270 | -1.0912 | 0.6387 | 57 | H | 6.4974 | 1.8264 | 0.8840 |
| 23 | O | 1.8832 | -0.6870 | 0.5391 | 58 | H | -4.0279 | 3.1172 | -2.1242 |
| 24 | O | -0.9841 | -0.2594 | 0.7959 | 59 | H | 3.2559 | -3.1095 | 1.8587 |
| 25 | O | -3.7963 | 0.1349 | 1.1444 | 60 | H | 3.8945 | 2.1306 | -2.1252 |
| 26 | O | 3.2922 | -0.2994 | -1.5006 | 61 | H | -4.5463 | -2.3791 | 1.4924 |
| 27 | O | 0.3703 | 0.1375 | -1.3085 | 62 | H | -2.4654 | 3.1023 | -1.6410 |
| 28 | O | -2.5688 | 0.5479 | -1.0074 | 63 | H | 1.7408 | -3.2378 | 1.2512 |
| 29 | O | -5.2753 | 0.9712 | -1.0647 | 64 | H | 5.4863 | -1.6314 | -1.7779 |
| 30 | O | 6.6386 | 1.2583 | 0.1151 | 65 | H | -6.1247 | 1.2244 | 1.3303 |
| 31 | O | 5.9832 | -0.7543 | -1.6802 | 66 | H | -0.2509 | 3.2215 | -1.8343 |
| 32 | O | 2.7633 | -3.2885 | 1.0451 | 67 | H | -0.5095 | -3.2697 | 1.3902 |
| 33 | O | 0.3263 | -2.8264 | 1.1916 | 68 | H | 1.8075 | 2.0646 | -2.7831 |
| 34 | O | -2.8492 | -2.4997 | 1.4393 | 69 | H | -2.5080 | -2.2174 | 2.2972 |
| 35 | O | -6.5896 | 0.3424 | 1.1826 |
References
- [1] S. Geller, J. Chem. Phys. 33 (1960) 676.