11email: kunitomo@eps.s.u-tokyo.ac.jp 22institutetext: Department of Physics, Nagoya University, Furo-cho, Chikusa-ku, Nagoya, Aichi 464-8602, Japan 33institutetext: Laboratoire Lagrange, UMR 7293, Université Côte d’Azur, CNRS, Observatoire de la Côte d’Azur, 06304 Nice CEDEX 04, France 44institutetext: Earth-Life Science Institute, Tokyo Institute of Technology, 2-12-1 Ookayama, Meguro-ku, Tokyo 152-8551, Japan 55institutetext: Department of Earth and Planetary Sciences, Tokyo Institute of Technology, 2-12-1 Ookayama, Meguro-ku, Tokyo 152-8551, Japan
Revisiting the pre-main-sequence evolution of stars
Abstract
Aims. We want to investigate how planet formation is imprinted on stellar surface composition using up-to-date stellar evolution models.
Methods. We simulate the evolution of pre-main-sequence stars as a function of the efficiency of heat injection during accretion, the deuterium mass fraction, and the stellar mass, . For simplicity, we assume that planet formation leads to the late accretion of zero-metallicity gas, diluting the surface stellar composition as a function of the mass of the stellar outer convective zone. We estimate that in the solar system, between and of condensates formed planets or were ejected from the system. We adopt as an uncertain but plausible estimate of the mass of heavy elements that is not accreted by stars with giant planets, including our Sun. By combining our stellar evolution models to these estimates, we evaluate the consequences of planet formation on stellar surface composition.
Results. We show that after the first Myr during which stellar structure can differ widely from the usually assumed fully convective structure, the evolution of the convective zone follows classical pre-main-sequence evolutionary tracks within a factor of two in age. We find that planet formation should lead to a scatter in stellar surface composition that is larger for high-mass stars than for low-mass stars. We predict a spread in [Fe/H] of approximately 0.05 dex for stars with a temperature of K, to dex for stars with K, marginally compatible with differences in metallicities observed in some binary stars with planets. Stars with K may show much larger [Fe/H] deficits, by 0.6 dex or more, in the presence of efficient planet formation, compatible with the existence of refractory-poor Boo stars. We also find that planet formation may explain the lack of refractory elements seen in the Sun as compared to solar twins, but only if the ice-to-rock ratio in the solar-system planets is less than and planet formation began less than Myr after the beginning of the formation of the Sun.
Key Words.:
Stars: formation – Stars: pre-main sequence – accretion, accretion disks – Stars: evolution – Stars: interiors – Stars: abundances1 Introduction
How does planet formation affect stellar composition? Most of the gas in protoplanetary disks eventually accretes onto the host star within several million years (e.g., Haisch et al. 2001). Materials that will eventually form planets must condense during this phase. Recent meteoritic evidence indicates that Jupiter’s core should have formed rapidly, within 1 Myr (Kruijer et al. 2017). Disk materials accreted by the star after this time must have been poor in heavy elements111 We use “heavy elements” to describe all species able to condense and separate from hydrogen and helium in the protoplanetary disk. because of the gap created by the growing giant planets (e.g., Paardekooper & Mellema 2004; Guillot et al. 2014; Morbidelli et al. 2016). The accretion of such a diluted gas must result in a refractory-poor composition of the stellar surface. Hereafter, we refer to this mechanism as dilution. On the other hand, even after disk dispersal, the formation of planets can lead to the ingestion by the central star of planetesimals or even possibly planets, therefore yielding an increase in its metallicity (e.g., Spina et al. 2014b; Tognelli et al. 2016). Hereafter we refer to this mechanism as pollution.
In solar-type stars, an outer convective zone is present and rapidly mixes the stellar surface. The process is extremely fast (years) compared to evolution timescales and can be considered as instantaneous. The magnitude of the dilution depends both on the amount of heavy elements retained to form planets and on the extent of the outer convective zone of the star.
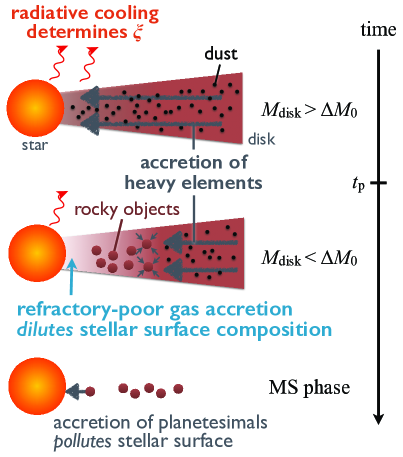
Figure 1 illustrates how planet formation may affect stellar surface composition and shows the model that we consider in this article. The star first accretes gas with a composition that is equal to that of the molecular cloud core (mass fraction of heavy elements ). When planetesimals begin to form, refractory-poor () gas is accreted. Accretion of planetesimals and planets then proceeds mostly later when the star is fully formed and the gas disk has dispersed. The crucial quantities involved are (i) , the mass of the disk as a function of time , (ii) , the mass of the outer convective zone, and (iii) the time at which planetesimals begin to form. In addition we define as the mass of the disk at time .
Circumstellar disks are short-lived, a few to 10 Myr at most (e.g., Mamajek 2009). This implies that the dilution mechanism takes place while the central star is still on the pre-main-sequence (pre-MS) phase (for stars ). Contrary to what happens later on the main sequence (MS), on the early pre-MS, even relatively massive stars (say, ) possess a relatively thick outer convective zone. This convective zone shrinks with age but on a timescale of a few to tens of millions of years. In the classical picture, a star at 10 Myr still has (see, e.g., Iben 1965; D’Antona & Mazzitelli 1994; Stahler & Palla 2005). However, pre-MS evolution has recently been revisited (Baraffe et al. 2009, 2012, 2017; Hosokawa et al. 2011; Vorobyov et al. 2017) and found to be more complex than previously thought: in particular, it appears to be sensitive to the entropy of the gas accreted by the star. Baraffe & Chabrier (2010) and Tognelli et al. (2015) showed that in this case, the evolution of the stellar internal structure may be significantly different from the classical picture (see Sect. 3.6).
In Kunitomo et al. (2017, hereafter Paper I), we found that the pre-MS evolution is also sensitive to the deuterium abundance, in particular in the low-entropy accretion cases (see also Stahler 1988; Hosokawa & Omukai 2009; Tognelli et al. 2015). Moreover we constrained possible accretion scenarios from the comparison with effective temperature–luminosity relations in young clusters, and showed that significant departures from the classical evolution scenario (a heat accretion efficiency of 10% or less, see Sect. 3.4) should be rare.
In this article, we investigate the internal structure evolution of pre-MS stars under a variety of settings and evaluate the consequences of planet formation on stellar surface composition. We compare our predictions with some observations potentially linked to the dilution and pollution mechanisms: the trends in stellar metallicity versus effective temperatures in the Hyades cluster (Takeda et al. 2013, 2017), the metal-poor surface compositions of Boo stars (Kama et al. 2015; Murphy & Paunzen 2017), the chemical inhomogeneity in some binary systems, and the lack of refractory materials measured in our Sun when compared to solar twins (e.g., Meléndez et al. 2009; Ramírez et al. 2009; Chambers 2010).
This paper is organized as follows. In Sect. 2, we describe the astrophysical background including the evolution of the metallicity of accreting materials. In Sect. 3, we provide a brief summary of our physical model and of the computation methods. Using our up-to-date stellar evolution models, we explore the consequences of planet formation on stellar surface composition in Sect. 4. In Sect. 5, we discuss the limits within which the dilution mechanism may explain the anomaly in the solar surface composition compared to solar twins. The results are summarized in Sect. 6.
2 Planet formation and accretion onto stars
Stars are formed by the gravitational collapse of molecular cloud cores. Due to angular momentum conservation, the contraction of the core results in the formation of both a central stellar seed and a circumstellar disk. The stellar seed accretes mass through the disk in which planets are formed.
Planetesimal and planet formation however is not granted. Grains formed in disks (pebbles) tend to rapidly migrate inward to be accreted by the central star (e.g., Adachi et al. 1976; Weidenschilling 1977; Nakagawa et al. 1986; Takeuchi & Lin 2002). We observe nevertheless that most stars host Earth-mass planets, but few of them, of the order of 14%, host giant planets (Mayor et al. 2011). Theoretical models indeed indicate that giant planet formation requires special conditions and is therefore relatively rare (Ida & Lin 2008). The presence of four giant planets in our solar system appears to be a rare case.
As soon as a proto-giant planet of appears, it carves a gap in the disk (Paardekooper & Mellema 2004; Duffell & MacFadyen 2013; Kanagawa et al. 2015), separating the disk in two and leading to the retention of the migrating grains (Kobayashi et al. 2012; Guillot et al. 2014; Morbidelli et al. 2016; Taki et al. 2016). It is therefore highly probable that the presence of at least four giant planets in our solar system led to the retention of significantly more refractory material into planets than for the majority of stars.
On this basis, we assume that, in Sect. 5, of the other solar twins retained, on average, much less refractories into planets than our Sun (Ramírez et al. 2009, see also Sect. 5.1).
We hereafter first evaluate the mass of condensates that must be retained in planetary objects in the early solar system.
2.1 Total condensates in the early solar system
The condensates consist of currently existing objects – and ejected or otherwise missing objects –.
First, we can account for the following mass of condensates (heavy elements) in our solar system except the Sun:
-
•
rocks in the four terrestrial planets (Lang 1992),
-
•
condensates in the asteroid belt (Lang 1992),
- •
- •
-
•
12–13 in Uranus and 13.5–15 in Neptune (estimated from Nettelmann et al. 2013),
-
•
0.2–0.3 in the Edgeworth-Kuiper belt and scattered disk (Gomes et al. 2008), and
-
•
1–1.5 in the Oort cloud (Kaib & Quinn 2008; Brasser & Morbidelli 2013). This number is essentially based on comets coming from the outer Oort cloud, where orbits may be perturbed by neighboring stars. The inner Oort cloud may hide some larger objects, like Planet 9 (Batygin & Brown 2016). We account for these below, when including calculations of planetesimals and planets ejected (or, in this case, nearly-ejected) from the solar system.
The total condensate mass is therefore between 58.7 and 101.8 .
Next, we evaluate the mass of missing objects from the asteroid belt, the Kuiper belt, and the region around Uranus and Neptune. O’Brien et al. (2007) estimate that the primordial asteroid belt has an initial mass of . Of these however, about one forth are embryos that end up accreted by planets. This means that about of asteroid belt material was ejected from the solar system. The structure of the Kuiper belt and the eccentricities of the giant planets lead (within the Nice model) to a requirement of about present in the outer solar system - after the giant planets had formed (Tsiganis et al. 2005). Of this , only about is accreted by the fully formed giant planets (Matter et al. 2009). We therefore assume that of planetesimals in the Jupiter-Saturn region was ejected. Subsequently, when Uranus and Neptune formed, the region must have contained a considerable mass of planetesimals and protoplanets. Izidoro et al. (2015) ran simulations with initially 30 and in embryos, in addition to the fully-formed Jupiter and Saturn. The results of his simulations (Izidoro et al. 2015, Izidoro, private communication 2017) are summarized in Table 1. They indicate that between and of planetesimals was ejected or implanted in the inner Oort cloud, and that the Sun was hit by 0 to of planetesimals. In total, we therefore estimate the total mass of condensates (rocks and ices) ejected from the solar system to lie between 38 and .
| Initial total mass in embryos | mean ejected mass | hit the Sun | hit the giant planets | remaining mass |
|---|---|---|---|---|
| 60 | –5 | –42 | ||
| 30 |
As a result, about 97 to was extracted from the protosolar disk to form planets and about may have been implanted into the Sun during the MS phase. Hereafter we refer to the total mass of condensates accreted into planets or ejected as . We adopt in the early solar system.
The total mass of material accreted by the star after planet formation has begun (, see Fig. 1), , can therefore be estimated to be at least , where is the primordial metallicity of the molecular cloud core. In the simple scenario in which the star accretes gas after (see Sect. 3.7 hereafter), . As we see below (e.g., Fig. 7), changes in metallicity by the dilution effect are only of the order of 5%, meaning that we can safely assume that . Given that in the solar system (Asplund et al. 2009), .
2.2 Total condensates in extrasolar systems
Higher-mass stars seem to harbor more massive planetary systems (e.g., Lovis & Mayor 2007; Johnson et al. 2010; Omiya et al. 2012; Bonfils et al. 2013). We therefore extend the relation to stars with different masses and metallicities by scaling linearly with them; that is, we assume that corresponding to . We note that since a relatively small fraction of stars harbor giant planets, this is our limiting case for stars that succeeded in forming multiple giant planets. The other limiting case is when no planets form, in which case we consider that .
An estimate of pollution effects in exoplanetary systems may be obtained through the analysis of the compositional anomalies in the of white dwarfs. Mustill et al. (2018) found that the destabilization of planetary systems results in an accretion rate of planetesimals of about given that the belt mass is .
2.3 Consequences of accretion onto MS stars
Before using a more realistic approach, let us first examine the consequences of either the accretion of rocky planetesimals (i.e., the metallicity of accreting materials ) or the accretion of of gas onto – MS stars. While the former may be viewed as a possibility, the latter is not realistic, the gas disk lifetime (Myr) being much shorter than the time to reach the MS (Myr). However, this assumption has been used in the literature, and it is instructive to consider its consequences. We note that the internal structure of MS stars is not affected by formation history as we show below.
Changes in stellar surface composition because of accretion are evaluated from the simple relation
| (1) |
where and are the metallicity and mass of the accreting materials, respectively.
First, let us evaluate the pollution of the stellar surface due to the accretion of planetesimals or planets. In this case, it is important to note that any positive difference between the metallicity of the CZ and that of the deeper radiative zone will be rapidly erased by fingering (i.e., Rayleigh-Taylor) instabilities (Vauclair 2004; Garaud 2011), on a timescale estimated to be of the order of to Myr (Théado & Vauclair 2012).
We consider two cases with the Myr timescale of the thermohaline convection: a recent (Myr) accretion of of planetesimals or planets (similar to the solar case), or the steady accretion of Myr (see Sect. 2.2) for an interval of Myr. The latter case is equivalent to assuming and in Eq. (1).
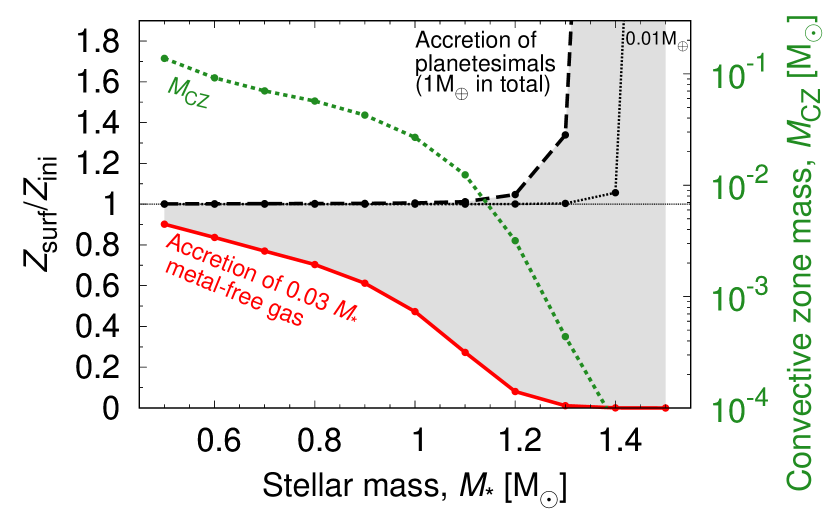
The resulting changes in stellar composition for these two cases are shown in Fig. 2 for MS stars. They are negligibly small for stars with masses lower than but become significant for higher-mass stars because of their thin outer CZ. However, even for the high-mass stars, the observed pollution effect in the CZ is likely to be significantly reduced compared to the estimates of Fig. 2 by at least the following two mechanisms not accounted for in our analysis: 1) Given the thermohaline convection, the pollution events should be observed less than 10 to 100 Myr after their occurrence, and/or 2) the CZ is becoming so thin that even relatively small () planetesimals may dissolve into the deeper radiative zone (below the CZ). In both cases a fraction of the accreted rocky materials reaches the radiative zone and the enrichment of heavy elements in the CZ becomes smaller.
Let us now turn to the (unrealistic) case of the accretion of metal-free gas onto MS stars. The final metallicity would be affected as a function of the mass of the convective zone, that is, . This implies that, using that approach, the retention of solids into planets would have changed the Sun’s metallicity by half. Since this corresponds to a reduction of the CZ metallicity, this effect would not have been affected by fingering instabilities. Of course, this situation is not realistic: we must consider that the accretion of low-metallicity gas occurs when stars are on the pre-MS. This corresponds to a phase during which they have considerably larger convective zones, therefore greatly suppressing the dilution effect.
3 Stellar evolution with accretion
In this section we describe how we model stellar evolution in the presence of accretion, and in particular how we account for a variable composition of the accreted gas. The method used is the same as Paper I, but with some differences in the assumed accretion history, input physics, and in the temporal evolution of accreting materials’ metallicity as described hereafter.
3.1 Computation method
We use the one-dimensional stellar evolution code MESA version 6596 (Paxton et al. 2011, 2013, 2015). Although we give a brief summary of the method below, we refer to the Paxton et al. papers and Paper I for full details of the computational method.
We calculate the protostellar333We refer to the main accretion phase before stellar mass becomes comparable to its final value as the protostellar phase. , pre-MS and MS evolutions from a , seed including mass accretion. Therefore, in this article the initial time (i.e., ) corresponds to the formation of a second Larson’s core. Although the initial entropy is important for the evolution of very-low-mass stars (see Hosokawa et al. 2011, Paper I), we fix the initial condition, because we focus on stars more massive than . We stop calculations when the time reaches 10 Gyr or a star leaves its MS (its radius ), whichever occurs first.
Accretion flow injects not only materials but also entropy into a star. Recent theoretical studies have shown that pre-MS evolution depends on the entropy of the accretion flow (see Hartmann et al. 1997; Baraffe et al. 2009, 2012, 2017; Hosokawa et al. 2011; Vorobyov et al. 2017; Jensen & Haugbølle 2018). We model the injected heat by the accretion per unit time, , as a part of the gravitational energy of the accreting materials. As in Paper I, we introduce , the fraction of accretion energy that is given to the star, such that
| (2) |
where is the mass accretion rate and the gravitational constant. We assume a steady throughout the accretion for simplicity (see however Baraffe et al. 2012). The rest of the gravitational energy, , is assumed to be lost by radiation before the materials accrete onto the star.
In Paper I, we found that both the protostellar and the pre-MS evolutions depend on how the accretion heat is distributed in the star. We adopt the following two models of the heat distribution. Our fiducial setting is to assume a uniform distribution in the entire star. Therefore, in this case the energy deposited in the star per unit mass and time is . We also consider the case of a non-uniform heat distribution, for which we introduce a dimensionless parameter, defined such that the accretion heat is distributed only in the surface region that contains an amount of mass , and increases linearly towards the stellar surface (see Eq. 3 of Paper I). In the present article we show only one example of non-uniform heat distribution with .
3.2 Mass accretion rate
In Paper I, we adopted a steady accretion of gas with for simplicity. When studying the consequences of planet formation on the stellar surface composition, the important phases are after a few million years when the disk accretion is reduced, implying that it is important to use an accretion history that includes the decay in gas accretion rate with time. Following the observations in Hartmann et al. (1998), we adopt the function of mass accretion rate with time shown in Fig. 3: it is large and steady during the class I phase ( until ), whereas in the late phase it drops with time, , as . The accretion rate is proportional to the final mass, , and therefore the accretion stops at for all cases, which corresponds to the upper limit of disk lifetimes, (see Haisch et al. 2001; Hernández et al. 2007; Mamajek 2009; Fedele et al. 2010; Ribas et al. 2014). For simplicity, we choose not to consider a correlation between stellar mass and the disk lifetime (see, however, Hillenbrand et al. 1992; Hernández et al. 2005; Yasui et al. 2014; Ribas et al. 2015), and we do not include mass loss (see however Wood et al. 2005; Suzuki et al. 2013). The influence of varying the accretion history is described in Appendix B.
3.3 Element diffusion
Stellar composition evolves with time due to the following effects: thermonuclear reactions, convective mixing, accretion, element diffusion, and mass loss. We include the first three in this article and neglect the others. We adopt the Ledoux criterion for the convective stability.
Element diffusion (also referred to as microscopic diffusion or atomic diffusion) is thought to change surface compositions on long timescales (). In general, it includes the effects of gravitational settling, and radiative levitation (see, e.g., Chaboyer et al. 2001; Morel & Thévenin 2002; Dotter et al. 2017). For this work, we neglect any element diffusion process and other extra-mixing processes in radiative zones. This is because considering element diffusion with the standard MESA packages leads to a settling of heavy elements in MS high-mass stars which is incompatible with observations. Extra-mixing processes must prevent, at least partially, this settling. A proper consideration of diffusion (especially for stars beyond ) would be extremely valuable, but since its efficiency is still a matter of debate (see Salaris & Cassisi 2017), this is beyond the scope of this work. We note that diffusion and gravitational settling are thought to occur on timescales, meaning that the results presented here should apply for pre-MS and early MS stars. For older stars we expect results to change quantitatively but not qualitatively.
It should also be noted that our calculations do not include the effect of the fingering (thermohaline) convection (see Sect. 2.3). However, in cases where the surface metallicity is found to be larger than the interior metallicity, the expectation is simply that the star should rapidly homogenize so that its metallicity is uniform.
3.4 Constraints on heat injection from Paper I
We constrained the heat injection parameter, , in Paper I from the comparison of evolutionary tracks with observations of young clusters in the Hertzsprung-Russell (H-R) diagram. We found that most stars would have been formed with if the mass fraction of deuterium (i.e., deuterium abundance) were found to be equal to in the clusters (Hébrard et al. 2005; Steigman 2006; Linsky et al. 2006; Prantzos 2007). Although this constraint depends on the uncertain deuterium abundances in the young clusters, we assume they are not very different from 20 ppm and we adopt the constraint in this article.
This constraint also appears to match the “hot” or “hybrid” accretion scenario favored by Vorobyov et al. (2017) on the basis of the peak luminosities of FU-Orionis outbursts. We however show hereafter the cases to show the global trends with .
Although Paper I included element diffusion and used a different accretion history (namely, steady accretion), the constraints obtained in that article still apply: the thermal evolutions of pre-MS and MS stars in the H-R diagram are not sensitive to accretion history (see Hosokawa et al. 2011, Paper I) and element diffusion.
3.5 Input parameters
We use the following seven parameters in the stellar evolution calculations (with fiducial values in parenthesis): , (uniform), , , accretion history (, , and initial condition . Another parameter is the mass of zero- (or low-) metallicity gas accreted in the final stages of stellar accretion: (see Sect. 2.2).
As described in the previous section, we set our fiducial value to 0.1 with uniform heat distribution. We explore different heat injection hypotheses by varying and in Sect. 3.6. We found in Paper I that the protostellar evolution depends on . Since we focus on relatively old ( Gyr) MS stars including the Sun, we set our fiducial to the protosolar nebula value, 28 ppm (the observational uncertainty is , Asplund et al. 2009), rather than the present-day local ISM value, 20 ppm. We also explore solutions with varying from 0 to 40 ppm. Deuterium abundance () in the accreting materials is kept constant throughout the whole accretion phase.
| Converged input parameters | ||
| 0.70048186 | ||
| 0.27985523 | ||
| 0.01966291 | ||
| 1.81743512 | ||
| 0.01026355 | ||
| Target values | Converged values at solar age | |
| a𝑎aa𝑎afootnotemark: | 0.0280705368 | |
| b𝑏bb𝑏bfootnotemark: | 0.2798552573 | |
| c𝑐cc𝑐cfootnotemark: | 0.7227136520 | |
| c𝑐cc𝑐cfootnotemark: | ||
| c𝑐cc𝑐cfootnotemark: | ||
| d𝑑dd𝑑dfootnotemark: | ||
We use the parameters of composition and convection listed in Table 2 throughout this article. In Paper I, we performed a test to explore the best settings to reproduce the spectroscopic and helioseismic observations of the present-day Sun. Since we do not include the element diffusion in this article, we have again done the test and obtained the results listed in the table. We note that the different input parameters in the table do not significantly affect the evolution of pre-MS and MS stars except for , which is discussed in Appendix B.
3.6 Protostellar and pre-MS evolution of stellar internal structure
As a first step, we discuss the results of accreting stellar models adopting different input settings, namely by changing the heat injection parameter (i.e., and ), the mass fraction of abundance and the final mass of stars . We emphasize that in this subsection we do not consider the effect of planet formation and therefore the composition of accreting materials are kept constant throughout the accretion, unlike the following sections.
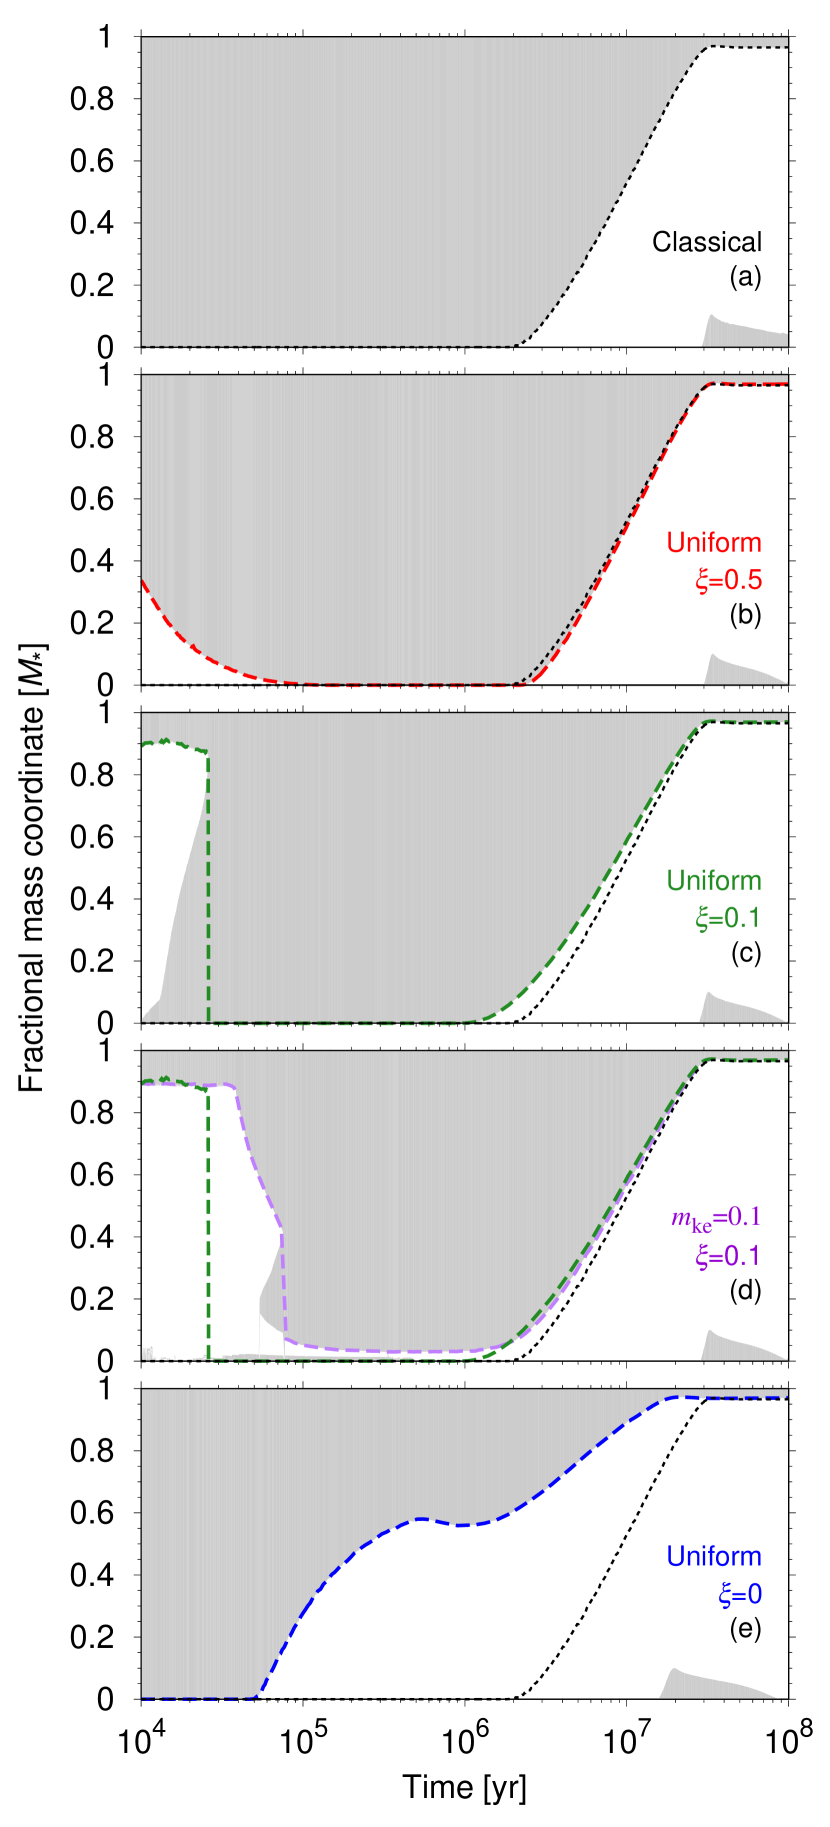
Figure 4 shows the consequences of varying the heat injection parameter between and 0.5 for stars. The qualitative behaviors are the same: in an initial phase of less than yrs in which the star has accreted less than half of its final mass, the interior is largely convective but radiative regions can exist, depending on how the accretion takes place (i.e., depending on the parameters and ). After that, the star becomes (almost) entirely convective until after yrs or so (for classical and models), when a radiative core develops and grows. We note that is a special case, because the star is so compact that it starts fully convective and the radiative zone appears and grows before years, much earlier than for . The timing therefore strongly depends on the value of (see also Baraffe & Chabrier 2010). For example, the time when a stable radiative core forms is 1.8, 2.2, 0.9, and 0.05 Myr and the time at which is 24, 24, 22 and 10 Myr for a non-accreting case, , and , respectively.
The underlying physics of the protostellar and pre-MS evolution of stellar internal structure responsible for the evolution in Fig. 4 is discussed in Appendix A. In short, the stellar internal structure is controlled by three effects: heat injection by accretion, opacity, and delivery of fresh deuterium in the stellar interior.
Figure 5 shows the evolution of the location of the radiative/convective interface for different values ranging from 0 to (the cosmic primordial value) with . The protosolar value is and the value for the current local interstellar medium is . Although variations of have a quantitatively larger impact, variations in also affect the internal structure evolution: the stars with a lower develop a radiative core more rapidly. This is because such stars have a smaller radius (see Fig. 3 of Paper I), a higher temperature ( from the virial theorem), and then a smaller opacity (, using Kramers’ law).
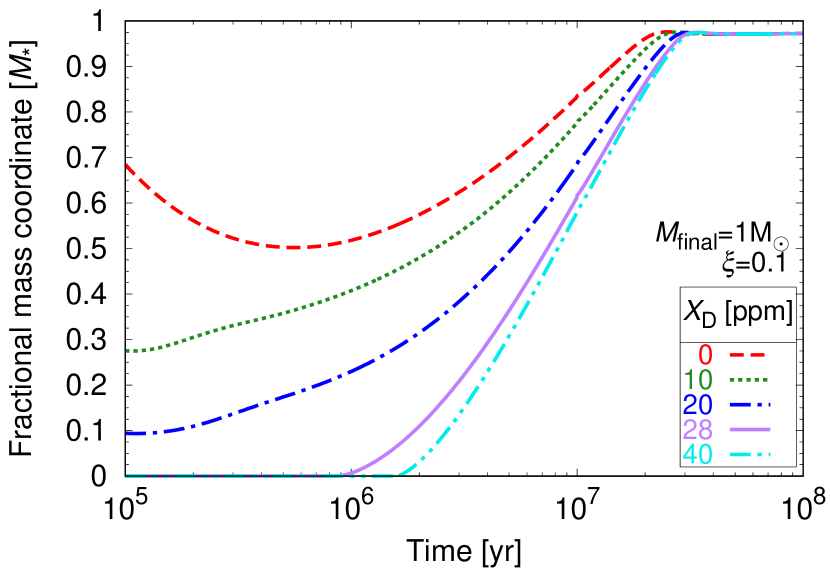
The importance of the choice of deuterium abundance is illustrated by the fact that for cold accretion (), if , only after a few million years (see also Fig. 4 of Baraffe & Chabrier 2010), while for , reaching this point takes (see Fig. 4c).
Figure 6a shows how the convective zone mass changes as a function of age and for a range of final masses –. We note that and then the accretion stops at in all cases (see Sect. 3.7). More massive stars have a thinner surface CZ because a larger mass corresponds to a hotter interior. Figure 6b shows the temporal evolution of as a function of stellar mass from to . The lower-mass stars have a longer timescale for the shrinkage of the surface CZ due to a longer Kelvin-Helmholtz (K-H) timescale.
3.7 Composition of accreting materials
The accretion of condensates (i.e., heavy elements), and therefore the evolution of the metallicity of the gas accreted by the star, , is controlled by the growth of dust grains and the gas drag by the disk which cause them to quickly drift towards the star (see, e.g., Garaud 2007), and, when planetesimals and protoplanets form, by their filtering by these larger bodies (Guillot et al. 2014). In the early phase, before grains have the time to grow, we expect the star to accrete material that has the composition of the molecular cloud core, . When grains grow but few large non-drifting planetesimals have been formed, we expect to increase (Garaud 2007; Tsukamoto et al. 2017). When planetesimals and planets form, should decrease, and eventually become very small when large-enough protoplanets (say from a few to a few tens of Earth masses) form and filter any incoming dust (Guillot et al. 2014; Morbidelli et al. 2016). A large variety of scenarios may therefore be considered.
We choose a very simple scenario that appears to best capture the essence of the problem: in the early phase , and then when large-enough planets have formed, . (In Sect. 5, we also consider the cases in which .)
One could of course argue that in the no-planet case, grains could be lost rapidly, leaving a tail of low-metallicity accretion that could mimic the case with planets. This is what happens for example in the model by Garaud (2007) and other similar grain-growth and drift models. However, on one hand, this efficient loss of grains onto the central star is incompatible with observations (see Dullemond & Dominik 2005; Takeuchi & Lin 2005; Brauer et al. 2007); on the other hand, for systems with planets, the additional reduction in metallicity is probably much larger.
One may also ask why, with our simple model, we do not consider the possibility of this initial increase in metallicity. While this may be of interest for some applications, this increase in metallicity is likely to be erased rapidly for two reasons: (1) because it occurs relatively early, when the protostar is still largely convective, and (2) because even in the case of the radiative region, as discussed previously, the top-heavy situation is likely to be unstable to double-diffusive instabilities.
Of course, our approximation that the metallicity is constant until it becomes zero is extreme and will lead to an overestimate of the magnitude of the effect of planet formation on stellar composition. In view of the other approximations, in particular on the assumed mass that is taken by planets, we believe that this is minor. Our scenario is to be considered as a guide to estimate the magnitude of the effects of planet formation rather than the basis of a quantitative, predictive model.
3.8 Stellar surface metallicity calculation
Finally, we describe how we calculate temporal evolution of . Ideally, by performing stellar evolution calculations in which changes with time (“full simulation”), we can obtain accurate solutions for the evolution of . The full simulation takes time, however. Instead, here we solve the evolution in the following way (“approximate solution”): first we perform a stellar evolution calculation with a constant . Using the temporal evolution of and the accreted mass in each time step, , we can estimate the evolution of with a given evolutionary model of as
| (3) |
where is the time at -th step. Our post-processing method is fast and therefore enables us to simulate a large variety of accreting models.
We note that in the full simulation models, the decrease in the metallicity (due to the planet formation) is compensated for by an increase in the mass fraction of and in the accreting materials. We recall that , where is the mass fraction of each element in mass. Therefore, we redistribute the missing metallicity by adding to and to .
Let us verify the approximate solution. Figure 7 shows the comparison between the evolutions of using the full simulation and the approximate solution. We adopt and the fiducial settings (i.e., the evolution of described in Sect. 3.2, with the uniform heat distribution, and ). We find that the two are almost the same: in both cases is decreased by due to the metal-free gas accretion in the late phases. This fact validates the approximate solution and therefore we use it in Sect. 4.

We note that and are related through the relation
| (4) |
Differences between these two quantities can be neglected since even in the cases where . In this work we use and interchangeably.
4 Stellar composition anomalies resulting from planet formation
In this section we investigate the consequences of planet formation on the stellar surface composition using the results in Sect. 3.6. We then compare our predictions to the observations of the Hyades cluster and the Boo stars.
4.1 Dilution of stellar surface composition
We use our “approximate solution” to calculate the evolution of the stellar surface metallicity resulting from the ingestion of metal-free materials (Sect. 3.7). Figure 8a shows the value of for stars in their MS phase and with –, –0.5 and and 28 ppm. (For simplicity, from this section onward, we present only results obtained with a uniform heat distribution.) We note that because we do not include element diffusion, once on the MS, is constant with time. The magnitude of the change in due to planet formation depends on the three parameters , and . The resultant is lower with a higher , a lower (which is predominant) and a lower . This is because the evolution is a function of the three parameters, as shown in Figs. 4–6: in the late accretion phase, higher-mass stars formed with lower and have a thinner CZ. In that case, for the same amount of condensates retained into planets, the stellar surface composition is affected more significantly.
Since the mass is not generally available as observable, we show as a function of the stellar effective temperature, , in Fig. 8b in the cases with and . Although is constant with time after the accretion phase, the – relation evolves with time because of the evolution of on the pre-MS.
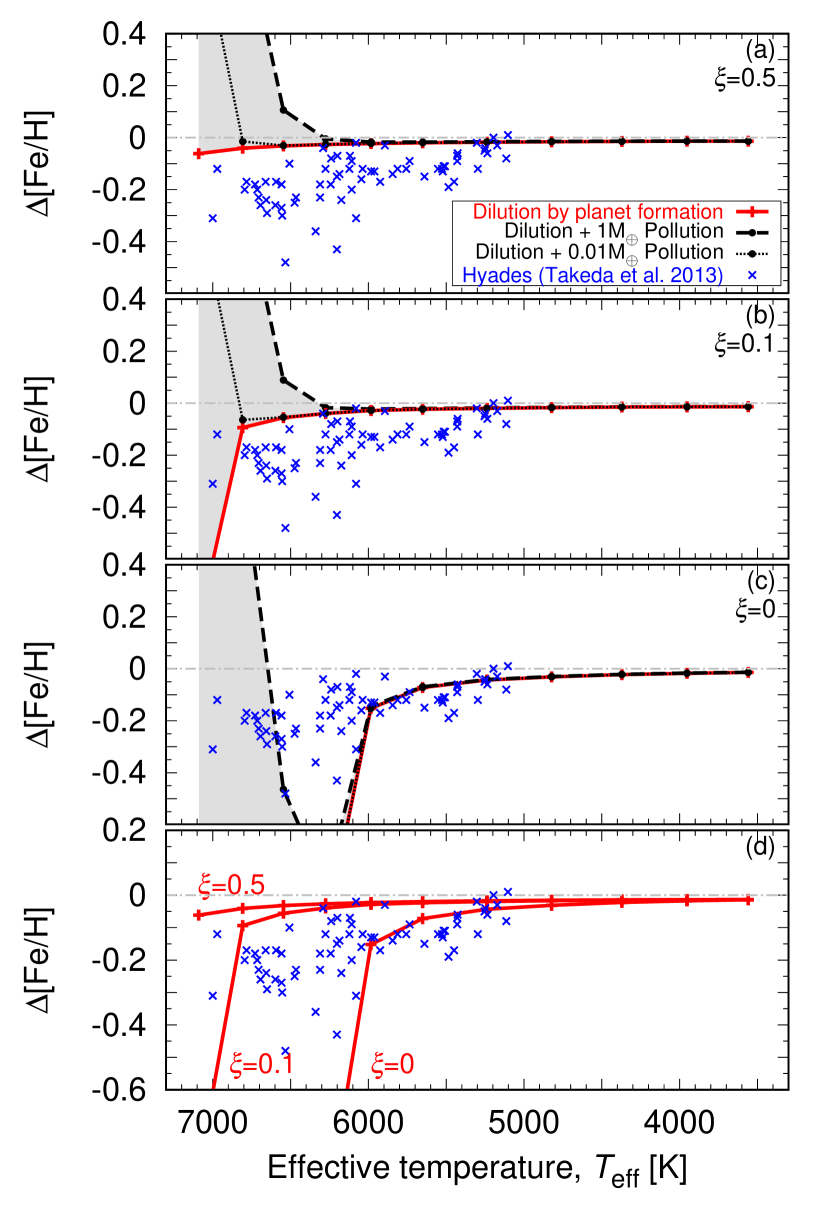
The solid lines in Fig. 9 show the consequences of the dilution on with and 0 and in the – diagram. We find that changes in due to planet formation are small in the (standard) case. However, for cold accretion ( and 0), stars with effective temperatures above to can show an important reduction in their metallicity due to dilution.
As described in Sect. 2.1, here we adopt a zero-metal accretion as a planet formation model, corresponding to an upper limit in the planetary systems with giant planets. If there is variability in planet formation, a scatter in should be created between 0 (i.e., no planet formation) and the solid line in Fig. 9 (see also Table 3). For example, in our fiducial setting (i.e., and ), we predict a maximal spread of [Fe/H] of 0.1 dex at around in a cluster. On the other hand, for lower , a much smaller scatter () can be created by the dilution.
4.2 Pollution by planetesimal engulfment during the MS
Figure 9 also shows the consequences of the engulfment of heavy elements onto MS stars (i.e., the pollution effect) assuming that or and in Eq. (1). We consider that the stars experienced metal-free accretion during their pre-MS phase, meaning that their surface composition was diluted before they began being impacted by planetesimals.
We find that for high-mass stars , the engulfment of heavy elements can increase significantly . In the cases, even if is much lower than due to the dilution during the pre-MS phase, the engulfment can completely overcome the initial decrease in due to the dilution effect. In the cases, however, planetesimal engulfment cannot compensate for the strong dilution.
We note that because of fingering (thermohaline) convection (Vauclair 2004; Garaud 2011; Théado & Vauclair 2012; Deal et al. 2015), we expect any increase in above its initial value to be quickly erased (see Sect. 2.3). Furthermore, although the effect of gravitational settling is still a matter of debate and is not included in this article, it has the potential to change the stellar surface metallicity with a long timescale ().
There is however a case in which we may be observing the signature of pollution. In the pre-MS cluster Vel, the star “2MASS J08095427–4721419” is more metal-rich compared to other members by (Spina et al. 2014b). Since the cluster is young (), fingering convection may not have had time to erase any pollution effect. It is interesting to note that orbital instabilities in planetary systems are expected to generally occur soon (with or so) after disk dispersal (see Iwasaki et al. 2001; Kominami & Ida 2002). Given this scenario, pre-MS stars could potentially have increased metallicities due to a recent pollution event. On the other hand, such events would in most cases be ancient in MS stars meaning that their signatures would have been erased by fingering convection.
4.3 Comparison with observations of the Hyades cluster
In Fig. 9, we compare our predictions with observations of the Hyades cluster. We assume that cool stars in the sample (with ) are representative of the primordial, non-diluted metallicity and the primordial composition of the cluster members were uniform. We therefore plot as a function of effective temperature. Given our assumptions, we note that the results for the dilution scenario as plotted here are insensitive to the assumed metallicity (see Appendix B). The observed data from Takeda et al. (2013) show a trend in the – [Fe/H] plane: hotter stars have a lower metallicity ( dex over 2000 K from 5000 to 7000 K) with a significant (up to 0.4 dex) scatter. First we stress that it is difficult to precisely determine the metallicity of rapid-rotating hot stars and therefore this – [Fe/H] trend may be created by uncertainties in atmospheric models (see Takeda et al. 2013). We however want to explore the possibility that the trend and/or the scatter are caused by planet formation.
| [K] | ||||||
|---|---|---|---|---|---|---|
| 7000 | 6500 | 6000 | 5500 | 5000 | 4000 | |
| 0.5 | 0.054 | 0.030 | 0.024 | 0.018 | 0.016 | 0.014 |
| 0.1 | 0.60 | 0.052 | 0.028 | 0.022 | 0.018 | 0.014 |
| 0 | 7.9 | 0.20 | 0.064 | 0.036 | 0.018 | |
First let us focus on the – trend. As described in Sect. 4.1, we find that of hot stars drops at a certain temperature as a consequence of the dilution (i.e., accretion of metal-free gas due to planet formation). This feature matches the observed trend qualitatively. However, Figs. 9a–c show that except in the extreme and unrealistic case, planet formation cannot lead to a slope that matches the observed one. We conclude that the planet formation scenario that we are proposing cannot explain the trend seen in the Hyades.
Let us now examine whether or not planet formation could affect the scatter in – and take precedence over another unidentified process. As described previously (see Sect. 4.1), we expect planet formation to vary from star to star therefore creating a natural scatter of in a cluster. Again, for the expected values (see Sect. 3.4), the scatter (which indeed is expected to increase with effective temperature) is much smaller than the observed one (see Table 3). In the extreme case of (Fig. 9d), the scatter can be dex at 6000 K and even several dex in and therefore most stars are enclosed by the solid line (i.e., the lower limit of by the dilution) and 0 (i.e., no planet formation). However, the stars formed with must be rare (see Paper I), and therefore this does not appear to be a viable explanation.
From the considerations above, we conclude that neither the dilution nor the pollution can explain the slope or the scatter of of the Hyades cluster.
Recently Takeda et al. (2017) reported that the stars in the 0.1-Gyr-old Pleades cluster have a homogeneous [Fe/H] unlike in the 0.6-Gyr-old Hyades cluster. Moreover, the iron abundances of stars are homogeneous in the Chamaeleon I star-forming region and the pre-MS cluster Velorum (Spina et al. 2014a, b). The fact that the metallicity trend is seen only in the older cluster may point to the importance of the element diffusion, which occurs on a long timescale.
4.4 Implications for chemically inhomogeneous binary systems
| Name | Planet | Dilution? | Distance | References | |||
|---|---|---|---|---|---|---|---|
| [dex] | [K] | [] | [au] | ||||
| 16 Cyg A | - | 5830 | 1.05 | consistent | 755 | 1, 2, 3 | |
| B | 0 | 5751 | 1.00 | ||||
| XO-2 N | 0.97 | consistent | 4600 | 4 | |||
| S | 0 | 0.98 | |||||
| Ret | - | 5710 | 0.96 | consistent | 3713 | 5, 6 | |
| Ret | 0 | debris disk | 5854 | 0.99 | |||
| WASP-94 A | 1.29 | inconclusive | 2700 | 7, 8 | |||
| B | 0 | 1.24 | |||||
| HD133131 A | 0.95 | inconclusive | 360 | 9 | |||
| B | 0 | 0.93 | |||||
| HAT-P-4 A | 6036 | 1.24 | inconsistent | 28446 | 10 | ||
| B | 0 | - | 6037 | 1.17 | |||
| HD 80606 | 1.03 | inconsistent | 1200 | 11 | |||
| 80607 | 0 | - | 1.00 |
Binary stars are probably formed from the same molecular cloud core and have the same primordial composition. This is generally the case, but some show differences in metallicity. We focus here on systems in which planets or signs of planet formation have been found to test the validity of our simple planet-formation scenario. Table 4 summarizes the observations obtained for seven systems and whether they are consistent or inconsistent with our dilution scenario.
In three cases, the observed metallicity difference is consistent with the predictions and the idea that efficient (giant) planet formation led to the retention of heavy elements in the planets and a metal-poor star: for 16 Cyg and XO-2 the star with a planet or more planets is also metal-poor. For Ret, the metal-poor star is the one with a debris disk. Quantitatively, the differences in [Fe/H] for 16 Cyg and XO-2 are two to three times larger than expected (see Table 3). This may be explained either by invoking a value of slightly below , a value of closer to 20 ppm, or by increasing over our fiducial value (see Sect. 2.1). Concerning the latter, we may note that some hot Jupiters appear to be extremely dense and require masses in heavy elements nearing or exceeding (Guillot 2008; Moutou et al. 2013; Thorngren et al. 2016). This may be a sign that planet formation was even more efficient than in the solar system.
However, other cases in Table 4 seem inconsistent with our dilution scenario: HD 80606 is metal-rich but has a known massive eccentric giant planet whereas its binary HD 80607 is metal-poor and has no detected planet. HAT-P-4 A hosts a giant planet and is more metal-rich by 0.11 dex than HAT-P-4 B that does not (both are F stars with an effective temperature above 6000 K).
Unfortunately, it is not possible to conclude one way or another at this point for several reasons: the number of objects for which this measurement is possible is small, we cannot exclude that a massive but far-away planetary system exists but was not detected and planet formation is probably extremely complex and stochastic. We also point out that the determination of differences in metallicity to this level of accuracy is still extremely challenging. For example, Takeda (2005) and Schuler et al. (2011a) reported no significant metallicity difference in the two components of 16 Cyg, contrary to Tucci Maia et al. (2014) and Ramírez et al. (2011).
We also note that Oh et al. (2018) reported that the HD 240430/240429 system has a difference in [Fe/H] of 0.2 dex even though no planet has been detected in this system. They invoked a putative planet which would have been engulfed by the metal-rich star, HD 240430. As we discussed, this seems unlikely, owing to the rapid mixing expected from fingering convection, but indeed we might be observing that particular system while the planet has not yet been completely ingested by its star.
It is therefore difficult at the moment to clearly attribute differences in the compositions of binary stars to planet formation. This cannot be excluded either.
4.5 Implications for Boo stars
The significant decrease of of high-mass stars has an important implication for Boo stars, which make up about 2% of A-type stars (Gray & Corbally 1998; Paunzen 2001). They have lower abundances of Fe-peak (therefore refractory) elements by up to 2 dex but near-solar abundances of volatile elements.
It is hypothesized that the filtration of dust by planetary objects induces their anomalous compositions (e.g., Venn & Lambert 1990; Kama et al. 2015). Figures 8a and 9b show that A-type ( and K) stars formed with a low-entropy () accretion can have a significantly refractory-poor surface composition as a consequence of the dilution, supporting this hypothesis. This matches the observations; namely, the lower limit of of the Boo stars is also (Murphy & Paunzen 2017).
Therefore planet formation around high-mass stars that have been formed with a low-entropy accretion (, which is rare) could be one potential origin of the peculiar composition of the Boo stars. This should be studied more quantitatively in future. We also note that this is not necessarily a unique solution; namely, there may exist multiple channels producing Boo stars (Murphy & Paunzen 2017).
5 Planet formation and the solar composition anomaly
Finally, in this section, we discuss the solar composition anomaly problem, which has recently been discussed both theoretically (Chambers 2010; Baraffe & Chabrier 2010) and observationally (e.g., Meléndez et al. 2009; Ramírez et al. 2009; Gonzalez et al. 2010; González Hernández et al. 2010, 2013; Schuler et al. 2011b; Adibekyan et al. 2014, 2016; Önehag et al. 2014; Nissen 2015; Spina et al. 2016). We revisit this problem focusing on the consequences of planet formation with up-to-date pre-MS evolution models.
5.1 Background
Meléndez et al. (2009) obtained precise surface compositions of the Sun and 11 solar twins, stars almost identical to the Sun. They found that the solar surface composition is indeed different from most solar twins: the Sun is depleted in refractory elements by up to (20%) compared to the average of the solar twins. Ramírez et al. (2009) confirmed this finding with 22 additional solar twins and found of them to also have a Sun-like, refractory-poor composition.
Chambers (2010) showed that adding rocks to the solar surface compensates for the solar composition anomaly, that is, the solar surface composition becomes similar to the average of the solar twins. Interestingly, the mass of the primordial asteroid belt was (see Sect. 2.1) and hence the total mass of the rocky materials in the early inner solar system was rocks, which meets the requirement.
However, Chambers (2010) used the internal structure of the present-day Sun, whose CZ is much thinner than that of a pre-MS star (see Sect. 3.6). As described in Sect. 1, the stellar internal structure is crucial in the dilution scenario. Since the dilution mechanism should occur only during the pre-MS phase, we revisit their hypothesis on the solar composition anomaly using our evolutionary models of pre-MS stars.
5.2 Evaluation of the rock mass required to explain the solar composition anomaly
Using the internal structure evolutions in Sect. 3.6, we evaluate the mass of rocks, , required to create the compositional differences between the Sun and solar-twins. We do not attempt to match the precise composition of the Sun. Instead, we treat H, C, N and O as “ices” and refractory material (with higher condensation temperatures) as “rocks” following Lodders (2003). Chambers (2010) found, using a MS solar model (), that the required rock mass is . Because we account for stellar evolution, we must scale this value as a function of , an effective convective zone mass that depends on the time at which heavy elements start being retained in the disk:
| (5) |
We derive as follows. We use our simple accretion model (Sect. 3.7 and Fig. 7), but consider that after an initial phase with , planet formation suppresses the accretion of heavy elements so that . We use our approximate solution to calculate as a function of and . We then derive as the CZ mass of a static model for which the accretion of a mass ( at ) with metallicity would give the same surface composition:
| (6) |
which results from Eq. (3). Figure 10 illustrates the derived with and 0 and . As described in Sect. 3.6, younger stars formed with a larger value have a larger . We note that we also derived with a non-zero but it does not depend on the assumed . Because is an average of on the time period from to the end of accretion (10 Myr), .

Using the derived , we obtain , which range between 16 and , depending on and (see Table 5). In Table 5 the minimum value of is 0.3 Myr, whereas the maximum values, , correspond to the case where after all rocks in the disk are retained in planetesimals/planets and no rocky material accretes onto the star (see discussion in Sect. 5.3). The value increases with . We note that, with being fixed, the smallest values of and are obtained for .
We emphasize that, even with the extreme case (), at least rocks are needed to explain the solar anomaly problem. The values are much larger than , that is, the requirement of Chambers (2010). Moreover, they exceed the possible upper limit of the total rock mass in the early inner solar system, (see Sect. 2.1). Therefore we conclude that the formation of terrestrial planets and asteroid belt alone cannot explain the solar composition anomaly.
5.3 Ice-to-rock ratio of the solar-system planets
Inside of the snow line, we may find at most of rocks. However, beyond that line, much more solids are retained in planets as a mixture of ices and rocks. As described in Sect. 2.1, we estimate that the total condensates retained in the planetary objects, , is , which exceeds the maximum value of . Explaining the solar composition anomaly through the accretion of planets is therefore possible but requires that condensates retained in the disk have a rock-rich composition even beyond the snow line. In this subsection we pursue this possibility and constrain , the bulk ice-to-rock ratio in the solar-system planets required to account for the observed solar composition anomaly, which is testable with observations.
We must therefore consider that after planetesimals and planets start forming (), rocks are retained more efficiently than ices. Within this scenario, the protosun would still be accreting vaporized ices and a significantly reduced amount of rocks. Given that , we consider that the primordial ice-to-rock ratio (i.e., that in the primordial molecular cloud core that formed the Sun) is the same as the protosolar ice-to-rock ratio derived from both the evolutionary models of settling and the current measurements of the solar photosphere and meteorites (see Lodders 2003)777 The dilution effect implies that the primordial composition of the molecular cloud core differs slightly from the protosolar composition inferred from observations and models (Lodders 2003). This difference is globally of the order of 5% (see Fig. 7) but could be larger () for refractory elements. Although not insignificant, this is much smaller than the uncertainties considered in this work. .
Let us derive , the total amount of rocks retained in planets or ejected from the solar system. In order to explain the solar composition anomaly, the total condensate mass, , must consist of of pure rocks and of a mixture of ices and rocks with a protosolar composition. The latter does not induce an extra compositional anomaly. According to Lodders (2003), the ice-to-rock ratio of the solar-system composition is (i.e., 32.9% are rocks and 67.1% ices in mass among condensates), and a primordial rock-to-gas mass ratio, , is 0.489%. We therefore derive
| (7) |
Table 5 provides the range of values of compatible with the solar composition anomaly, assuming , for different values and for ranging from 0.3 Myr to . We recall that for all rocks in the disk ( in mass) are completely retained in planetesimals and planets and no rocky material is accreted by the central star (after ). For , we need , which is impossible. Conversely, lower values () are plausible. They correspond to a partial retention of rocks into planets when . In this case, contrary to the approach in Sect. 4, we do not hold fixed but allow it to vary.
The values of decrease for increasing . As described in Sect. 5.2, stars formed with a larger have a thicker CZ, which requires the accretion of a larger amount of rock (metal)-free gas to be diluted. Therefore, more rocks should be retained in planets or planetesimals, namely, a larger is required. For this, since the disk rock mass decreases with time, planet formation starts at progressively younger ages. For values of allowed by Paper I, we obtain that Myr, that is, efficient retention of rocks by the planet formation process must begin no later than 1.22 Myr after the beginning of the formation of the protosun.
The smallest values of are obtained for . We thus obtain that the amount of rocks in planets for –0.5 is – (– when considering ). The remainder (i.e., ) is made of ices (– for –0.5 – or up to for ). From these, we obtain the bulk ice-to-rock ratios in both the solar-system planets and ejected objects, , to explain the solar compositional anomaly. (We assume that the ejected planets and planetesimals have on average the same composition as the remaining ones.)
| [Myr] | |||||
|---|---|---|---|---|---|
| 0.5 | 0.46–0.79 | 74–130 | 99–134 | 1.10 | 0.12–0.16 |
| 0.1 | 0.38–0.72 | 61–115 | 90–127 | 1.22 | 0.19–0.23 |
| 0 | 0.10–0.24 | 16–38 | 60–75 | 2.33 | 1.01–1.13 |
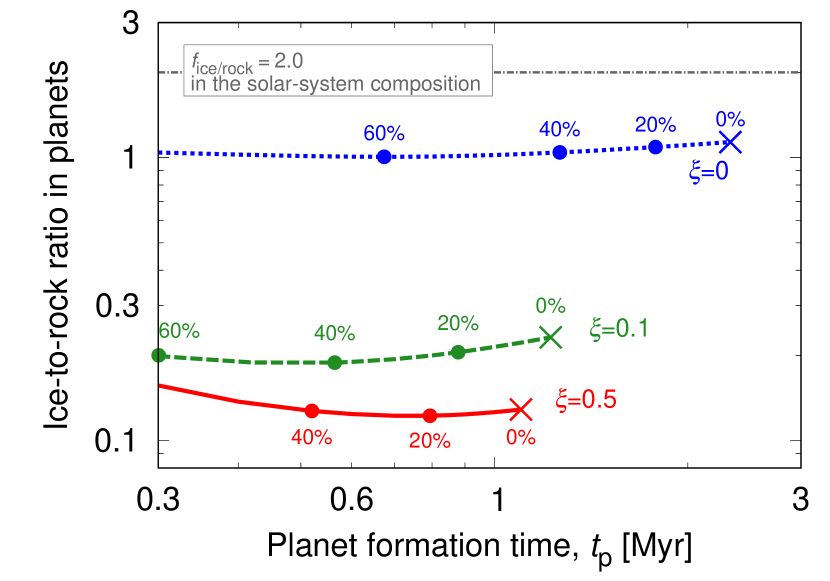
Figure 11 shows how varies as a function of . The crosses illustrate the solutions for . The rock-to-gas ratio of the accreted matter is
| (8) |
therefore corresponds to the fraction of rocks still present in the accretion flow. Symbols in Fig. 11 pinpoint the fraction, , ranging from 0 to 60% ().
Figure 11 shows that and 1.1 for 0.5, 0.1 and 0, respectively. The solutions are almost insensitive to . These values are lower than . This means that somehow planets should retain rocks efficiently.
Let us examine how different values of affect the solutions. We consider two cases with and as a lower and upper limit in our solar system (Sect. 2.1). For , the solutions are and for and 0, respectively. With , and for and there is no solution for . Therefore, together with our results in Paper I, there is no realistic solution in the latter case. In all cases, explaining the solar composition anomaly with planet formation requires that the solar-system planets have globally an ice-to-rock ratio that is significantly below the solar value.
5.4 Discussion
The solar ice-to-rock ratio, 2.04, is much larger than the values that we obtain to explain the solar composition anomaly with planet formation (e.g., 0.23 if and ). However, we stress that the global ice-to-rock ratio in planets of the solar system has been inferred from the solar value, but not obtained independently. Its value in the giant planets, which are by far the largest contributors, is unknown (e.g., Guillot 2005). Furthermore, several objects in the solar system have values much lower than the solar one: for example it has been inferred to be 0.64 in Enceladus (Porco et al. 2006) (about 61% of the mass of Enceladus is rocks) and 0.53 in Pluto (McKinnon et al. 2017). In comet 67P/Churyumov-Gerasimenko, in situ measurements found a gas-to-dust ratio (a proxy for the ice-to-rock ratio) of 0.17 to 0.5 (Rotundi et al. 2015). It is possible that the giant planets were formed mostly from ice-poor planetesimals inside of the snow line and that the overall ice-to-rock ratio in planets is therefore much smaller than that in the Sun (Ida & Guillot 2016). Of course, alternative explanations of the origin of the solar composition anomaly, such as a migration of the Sun in the Galaxy, exist (see Adibekyan et al. 2017, and references therein).
6 Conclusions
In this article, we explored the consequences of planet formation on stellar surface compositions. We examined two opposite effects: the dilution effect due to the low-metallicity of the gas accreted in the last stages of stellar accretion, and the pollution from planetesimals and planets possibly accreted by the central star. In order to quantify these effects, the key ingredients are the thickness of the stellar surface convective zone (CZ) and its evolution in time, the amount of heavy elements retained by the planet formation process, and the amount and time of the accretion of planetesimals and planets.
First, following Paper I, we analyzed the evolution of stellar interiors on the pre-MS, as controlled by three parameters: the efficiency with which heat is injected from the accreting flow to the star, , the mass fraction of deuterium, , and the stellar mass, . The evolution of the CZ can be subdivided in four phases:
- (1)
-
Initially the convective-radiative structure depends on how accretion energy is distributed within the star and can be highly variable.
- (2)
-
Efficient deuterium burning starts and ensures that the interior becomes largely convective.
- (3)
-
The CZ retreats and a central radiative zone grows essentially due to the progressive increase in temperature and subsequent decrease in opacity of the interior.
- (4)
-
The star reaches the MS, at which point the properties of the CZ become almost time-independent.
These four phases are reached at different ages. For likely values of the heat injection parameter ( – see Paper I), we found that Phase 1 lasts Myr, that is, when the star is less than half of its final mass. Phase 2 lasts for about Myr for solar-mass stars, but Myr for a star, and is inexistent for a star. Similarly, the end of Phase 3 depends on stellar mass, from about Myr for a star, Myr for a star, and Myr for a star. For we found that after Phase 1, the CZ evolution is relatively close to that of classical (non-accreting) evolution tracks, with a slightly faster evolution towards the MS for lower values of and of .
By causing changes in the composition of accreted material, planet formation will affect stellar composition but the relatively slow retreat of the stellar CZ during the first million years means that the effect will generally be small. It should be maximal for high-mass stars (smaller CZ) and for stars hosting giant planets (requiring large amounts of solids from the early stages of protoplanetary disk evolution).
Next, we estimated that in the solar system, between and of condensates formed planets or were ejected from the system. We hence adopted as a fiducial scenario the accretion of of zero-metallicity gas in the last stages of the evolution of the circumstellar disk (dilution scenario). This is expected to be an uncertain but reasonable limit for a star with several giant planets like our Sun. Conversely, stars without planets would not show a significant metallicity change.
Another mechanism, that is, planet or planetesimal engulfment during the MS phase, can increase stellar metallicity. However, this is expected to be quickly erased by thermohaline convection on a 10- to 100-Myr timescale (Théado & Vauclair 2012). We estimate that a significant () increase in metallicity due to pollution by planet and planetesimal engulfment should be limited to massive stars with effective temperatures above .
With this fiducial setting (i.e., , and ), we found that the dilution scenario results in a decrease of [Fe/H] by up to 0.6 dex for stars dropping to less than 0.05 dex at 6500 K and less than 0.02 dex at 5500 K. Given the variability of planet formation and the relative scarcity of systems with giant planets, we estimate that this is representative of the scatter in stellar composition that should be imprinted by planet formation. This scatter is smaller and has a different dependence than that measured in the Hyades cluster (Takeda et al. 2013), indicating either that systematic effects bias the abundance retrievals, that observational uncertainties are still too large, or that other processes such as stellar diffusion play a larger role.
We examined how dilution can be used to interpret the differences in composition observed in some binary systems with planets or signs of planet formation: several systems with planets have stellar components differing in metallicity by 0.01 to 0.06 dex, values which are within a factor of approximately two of those estimated on the basis of planets in the solar system (i.e., ; see Fig. 9 and Table 3). Given the ambiguities of the findings, the small number of cases and the complexity and variability of planet formation itself, it is however too early to draw any conclusion at this point, except that it is a promising area of research.
Other important objects are Boo stars, a small fraction () of A-type stars with effective temperatures above 7000 K with a significant depletion of up to 2 dex in refractory elements but solar compositions in volatile elements. For such temperatures, the CZ has shrunk rapidly enough to see very large changes in stellar composition due to planet formation, assuming relatively low values of (see Fig. 9 and Table 3). This however requires another ingredient, namely that planet formation preferentially favors the retention of refractory elements over volatile ones. Indeed, observations of accreting Herbig stars indicate that in systems which we expect to host giant planets, the accreting gas is depleted in refractory elements by 0.5 dex, while the volatile elements show normal abundances (Kama et al. 2015). Planetesimal formation inside of the ice line can lead to efficient retention of refractory elements and the loss of ices (Ida & Guillot 2016).
Finally, we looked for an explanation of the fact that our Sun is poor in refractory elements compared to the average solar twin (Meléndez et al. 2009; Ramírez et al. 2009; Spina et al. 2016). The traditional explanation is that this deficit is created by the formation of the terrestrial planets and the proto-asteroid belt (Chambers 2010). We showed however that this explanation is incompatible with the pre-MS evolution of the Sun and the fact that, early on, its surface CZ was much larger than it is now. Instead, the solar composition anomaly may be linked to the dilution mechanism proposed here. The early formation of a proto-Jupiter is known to have prevented the Sun from accreting material from the outer disk. If this material had a lower-than-solar ice to rock ratio, this would have led to a depletion of refractory elements in the gas accreted by the Sun in its last stage of formation. In order for this scenario to work, we found that the global ice-to-rock ratio of planets should be less than and efficient planetesimal formation should have begun at most about 1 Myr after the beginning of the formation of a proto-Sun (i.e., a second Larson’s core). These values are much smaller than the protosolar ice-to-rock ratio of (Lodders 2003) implying that planets in the solar system should be extremely rock-rich. This is not impossible (see Ida & Guillot 2016) especially given that the giant planets, whose ice-to-rock ratio is unknown, contain most of the planetary mass of heavy elements. The scenario is similar, at least qualitatively, to the one needed to explain the composition of Boo stars.
Planet formation thus affects stellar compositions in a subtle and complex way. We predict that, in general, the dominant effect should be a slight decrease of the metallicity of stellar outer convective zones compared to that of their deeper interior and to the primordial value. Observations of compositional differences in some binary stars, the composition anomalies of Boo stars, and perhaps of our own Sun do point in that direction, with multiple exceptions however. In order to make progress, we therefore need very accurate measurements of the compositions of stars in clusters and those of binary stars and limits on the presence of planetary companions around them. We have shown that the solar composition anomaly can be explained only if planets in the solar system are extremely ice-poor. Testing this hypothesis requires much better constraints on the composition of giant planets, something Juno has started doing for Jupiter (see Helled & Lunine 2014; Bolton et al. 2017; Guillot et al. 2018) but is eagerly awaited for the other planets, in particular Uranus and Neptune.
Acknowledgements.
We express our gratitude to André Izidro for providing simulation results and to John Chambers for providing data. We appreciate the constructive comments of the anonymous referee, which helped us to improve this paper. We are also grateful to Shu-ichiro Inutsuka, Hiroshi Kobayashi, Shinsuke Takasao, Yoichi Takeda, Vardan Adibekyan, and Corinne Charbonnel for fruitful discussions and comments. M.K. thanks for the hospitality he experienced during his visit to the Observatoire de la Côte d’Azur, which was made possible thanks to support from OCA BQR. This work was supported by Grant-in-Aid for JSPS Fellows 249296, JSPS KAKENHI Grant Numbers 23244027, 15H02065, 16H02160 and 17H01153, JSPS Core-to-Core Program “International Network of Planetary Sciences”, and the Astrobiology Center Program of National Institutes of Natural Sciences (NINS) (Grant Number AB301023).References
- Adachi et al. (1976) Adachi, I., Hayashi, C., & Nakazawa, K. 1976, Progress of Theoretical Physics, 56, 1756
- Adibekyan et al. (2017) Adibekyan, V., Delgado-Mena, E., Feltzing, S., et al. 2017, Astronomische Nachrichten, 338, 442
- Adibekyan et al. (2016) Adibekyan, V., Delgado-Mena, E., Figueira, P., et al. 2016, A&A, 592, A87
- Adibekyan et al. (2014) Adibekyan, V. Z., González Hernández, J. I., Delgado Mena, E., et al. 2014, A&A, 564, L15
- Asplund et al. (2009) Asplund, M., Grevesse, N., Sauval, A. J., & Scott, P. 2009, ARA&A, 47, 481
- Bahcall et al. (2005) Bahcall, J. N., Basu, S., Pinsonneault, M., & Serenelli, A. M. 2005, ApJ, 618, 1049
- Baraffe & Chabrier (2010) Baraffe, I. & Chabrier, G. 2010, A&A, 521, A44
- Baraffe et al. (2009) Baraffe, I., Chabrier, G., & Gallardo, J. 2009, ApJ, 702, L27
- Baraffe et al. (2017) Baraffe, I., Elbakyan, V. G., Vorobyov, E. I., & Chabrier, G. 2017, A&A, 597, A19
- Baraffe et al. (2012) Baraffe, I., Vorobyov, E., & Chabrier, G. 2012, ApJ, 756, 118
- Basu & Antia (2004) Basu, S. & Antia, H. M. 2004, ApJ, 606, L85
- Batygin & Brown (2016) Batygin, K. & Brown, M. E. 2016, AJ, 151, 22
- Bolton et al. (2017) Bolton, S. J., Lunine, J., Stevenson, D., et al. 2017, Space Sci. Rev., 213, 5
- Bonfils et al. (2013) Bonfils, X., Delfosse, X., Udry, S., et al. 2013, A&A, 549, A109
- Brasser & Morbidelli (2013) Brasser, R. & Morbidelli, A. 2013, Icarus, 225, 40
- Brauer et al. (2007) Brauer, F., Dullemond, C. P., Johansen, A., et al. 2007, A&A, 469, 1169
- Chaboyer et al. (2001) Chaboyer, B., Fenton, W. H., Nelan, J. E., Patnaude, D. J., & Simon, F. E. 2001, ApJ, 562, 521
- Chabrier & Baraffe (1997) Chabrier, G. & Baraffe, I. 1997, A&A, 327, 1039
- Chambers (2010) Chambers, J. E. 2010, ApJ, 724, 92
- Damasso et al. (2015) Damasso, M., Biazzo, K., Bonomo, A. S., et al. 2015, A&A, 575, A111
- D’Antona & Mazzitelli (1994) D’Antona, F. & Mazzitelli, I. 1994, ApJS, 90, 467
- Deal et al. (2015) Deal, M., Richard, O., & Vauclair, S. 2015, A&A, 584, A105
- Dotter et al. (2017) Dotter, A., Conroy, C., Cargile, P., & Asplund, M. 2017, ApJ, 840, 99
- Duffell & MacFadyen (2013) Duffell, P. C. & MacFadyen, A. I. 2013, ApJ, 769, 41
- Dullemond & Dominik (2005) Dullemond, C. P. & Dominik, C. 2005, A&A, 434, 971
- Fedele et al. (2010) Fedele, D., van den Ancker, M. E., Henning, T., Jayawardhana, R., & Oliveira, J. M. 2010, A&A, 510, A72
- Garaud (2007) Garaud, P. 2007, ApJ, 671, 2091
- Garaud (2011) Garaud, P. 2011, ApJ, 728, L30
- Gomes et al. (2008) Gomes, R. S., Fernández, J. A., Gallardo, T., & Brunini, A. 2008, The Scattered Disk: Origins, Dynamics, and End States, ed. M. A. Barucci, H. Boehnhardt, D. P. Cruikshank, A. Morbidelli, & R. Dotson, 259–273
- Gonzalez et al. (2010) Gonzalez, G., Carlson, M. K., & Tobin, R. W. 2010, MNRAS, 407, 314
- González Hernández et al. (2013) González Hernández, J. I., Delgado-Mena, E., Sousa, S. G., et al. 2013, A&A, 552, A6
- González Hernández et al. (2010) González Hernández, J. I., Israelian, G., Santos, N. C., et al. 2010, ApJ, 720, 1592
- Gray & Corbally (1998) Gray, R. O. & Corbally, C. J. 1998, AJ, 116, 2530
- Grevesse & Sauval (1998) Grevesse, N. & Sauval, A. J. 1998, Space Sci. Rev., 85, 161
- Guillot (2005) Guillot, T. 2005, Annual Review of Earth and Planetary Sciences, 33, 493
- Guillot (2008) Guillot, T. 2008, Physica Scripta Volume T, 130, 014023
- Guillot et al. (2014) Guillot, T., Ida, S., & Ormel, C. W. 2014, A&A, 572, A72
- Guillot et al. (2018) Guillot, T., Miguel, Y., Militzer, B., et al. 2018, Nature, 555, 227
- Haisch et al. (2001) Haisch, Jr., K. E., Lada, E. A., & Lada, C. J. 2001, ApJ, 553, L153
- Hartmann et al. (1998) Hartmann, L., Calvet, N., Gullbring, E., & D’Alessio, P. 1998, ApJ, 495, 385
- Hartmann et al. (1997) Hartmann, L., Cassen, P., & Kenyon, S. J. 1997, ApJ, 475, 770
- Hébrard et al. (2005) Hébrard, G., Tripp, T. M., Chayer, P., et al. 2005, ApJ, 635, 1136
- Helled & Guillot (2013) Helled, R. & Guillot, T. 2013, ApJ, 767, 113
- Helled & Lunine (2014) Helled, R. & Lunine, J. 2014, MNRAS, 441, 2273
- Hernández et al. (2005) Hernández, J., Calvet, N., Hartmann, L., et al. 2005, AJ, 129, 856
- Hernández et al. (2007) Hernández, J., Hartmann, L., Megeath, T., et al. 2007, ApJ, 662, 1067
- Hillenbrand et al. (1992) Hillenbrand, L. A., Strom, S. E., Vrba, F. J., & Keene, J. 1992, ApJ, 397, 613
- Hosokawa et al. (2011) Hosokawa, T., Offner, S. S. R., & Krumholz, M. R. 2011, ApJ, 738, 140
- Hosokawa & Omukai (2009) Hosokawa, T. & Omukai, K. 2009, ApJ, 691, 823
- Iben (1965) Iben, Jr., I. 1965, ApJ, 141, 993
- Ida & Guillot (2016) Ida, S. & Guillot, T. 2016, A&A, 596, L3
- Ida & Lin (2008) Ida, S. & Lin, D. N. C. 2008, ApJ, 685, 584
- Iwasaki et al. (2001) Iwasaki, K., Tanaka, H., Nakazawa, K., & Emori, H. 2001, PASJ, 53, 321
- Izidoro et al. (2015) Izidoro, A., Morbidelli, A., Raymond, S. N., Hersant, F., & Pierens, A. 2015, A&A, 582, A99
- Jensen & Haugbølle (2018) Jensen, S. S. & Haugbølle, T. 2018, MNRAS, 474, 1176
- Johnson et al. (2010) Johnson, J. A., Aller, K. M., Howard, A. W., & Crepp, J. R. 2010, PASP, 122, 905
- Kaib & Quinn (2008) Kaib, N. A. & Quinn, T. 2008, Icarus, 197, 221
- Kama et al. (2015) Kama, M., Folsom, C. P., & Pinilla, P. 2015, A&A, 582, L10
- Kanagawa et al. (2015) Kanagawa, K. D., Tanaka, H., Muto, T., Tanigawa, T., & Takeuchi, T. 2015, MNRAS, 448, 994
- Kippenhahn & Weigert (1990) Kippenhahn, R. & Weigert, A. 1990, Stellar Structure and Evolution (Springer-Verlag)
- Kobayashi et al. (2012) Kobayashi, H., Ormel, C. W., & Ida, S. 2012, ApJ, 756, 70
- Kominami & Ida (2002) Kominami, J. & Ida, S. 2002, Icarus, 157, 43
- Kruijer et al. (2017) Kruijer, T. S., Burkhardt, C., Budde, G., & Kleine, T. 2017, Proceedings of the National Academy of Science, 114, 6712
- Kunitomo et al. (2017) Kunitomo, M., Guillot, T., Takeuchi, T., & Ida, S. 2017, A&A, 599, A49
- Lang (1992) Lang, K. R. 1992, Astrophysical Data I. Planets and Stars., 33
- Linsky et al. (2006) Linsky, J. L., Draine, B. T., Moos, H. W., et al. 2006, ApJ, 647, 1106
- Liu et al. (2018) Liu, F., Yong, D., Asplund, M., et al. 2018, A&A, 614, A138
- Lodders (2003) Lodders, K. 2003, ApJ, 591, 1220
- Lovis & Mayor (2007) Lovis, C. & Mayor, M. 2007, A&A, 472, 657
- Mamajek (2009) Mamajek, E. E. 2009, in American Institute of Physics Conference Series, Vol. 1158, American Institute of Physics Conference Series, ed. T. Usuda, M. Tamura, & M. Ishii, 3–10
- Matter et al. (2009) Matter, A., Guillot, T., & Morbidelli, A. 2009, Planet. Space Sci., 57, 816
- Mayor et al. (2011) Mayor, M., Marmier, M., Lovis, C., et al. 2011, ArXiv e-prints
- McKinnon et al. (2017) McKinnon, W. B., Stern, S. A., Weaver, H. A., et al. 2017, Icarus, 287, 2
- Meléndez et al. (2009) Meléndez, J., Asplund, M., Gustafsson, B., & Yong, D. 2009, ApJ, 704, L66
- Miguel et al. (2016) Miguel, Y., Guillot, T., & Fayon, L. 2016, A&A, 596, A114
- Morbidelli et al. (2016) Morbidelli, A., Bitsch, B., Crida, A., et al. 2016, Icarus, 267, 368
- Morel & Thévenin (2002) Morel, P. & Thévenin, F. 2002, A&A, 390, 611
- Moutou et al. (2013) Moutou, C., Deleuil, M., Guillot, T., et al. 2013, Icarus, 226, 1625
- Murphy & Paunzen (2017) Murphy, S. J. & Paunzen, E. 2017, MNRAS, 466, 546
- Mustill et al. (2018) Mustill, A. J., Villaver, E., Veras, D., Gänsicke, B. T., & Bonsor, A. 2018, MNRAS, 476, 3939
- Nakagawa et al. (1986) Nakagawa, Y., Sekiya, M., & Hayashi, C. 1986, Icarus, 67, 375
- Nettelmann et al. (2013) Nettelmann, N., Helled, R., Fortney, J. J., & Redmer, R. 2013, Planet. Space Sci., 77, 143
- Neveu-VanMalle et al. (2014) Neveu-VanMalle, M., Queloz, D., Anderson, D. R., et al. 2014, A&A, 572, A49
- Nissen (2015) Nissen, P. E. 2015, A&A, 579, A52
- O’Brien et al. (2007) O’Brien, D. P., Morbidelli, A., & Bottke, W. F. 2007, Icarus, 191, 434
- Oh et al. (2018) Oh, S., Price-Whelan, A. M., Brewer, J. M., et al. 2018, ApJ, 854, 138
- Omiya et al. (2012) Omiya, M., Han, I., Izumioura, H., et al. 2012, PASJ, 64, 34
- Önehag et al. (2014) Önehag, A., Gustafsson, B., & Korn, A. 2014, A&A, 562, A102
- Paardekooper & Mellema (2004) Paardekooper, S.-J. & Mellema, G. 2004, A&A, 425, L9
- Palla & Stahler (1993) Palla, F. & Stahler, S. W. 1993, ApJ, 418, 414
- Paunzen (2001) Paunzen, E. 2001, A&A, 373, 633
- Paxton et al. (2011) Paxton, B., Bildsten, L., Dotter, A., et al. 2011, ApJS, 192, 3
- Paxton et al. (2013) Paxton, B., Cantiello, M., Arras, P., et al. 2013, ApJS, 208, 4
- Paxton et al. (2015) Paxton, B., Marchant, P., Schwab, J., et al. 2015, ApJS, 220, 15
- Plávalová & Solovaya (2013) Plávalová, E. & Solovaya, N. A. 2013, AJ, 146, 108
- Porco et al. (2006) Porco, C. C., Helfenstein, P., Thomas, P. C., et al. 2006, Science, 311, 1393
- Prantzos (2007) Prantzos, N. 2007, Space Sci. Rev., 130, 27
- Ramírez et al. (2009) Ramírez, I., Meléndez, J., & Asplund, M. 2009, A&A, 508, L17
- Ramírez et al. (2011) Ramírez, I., Meléndez, J., Cornejo, D., Roederer, I. U., & Fish, J. R. 2011, ApJ, 740, 76
- Ribas et al. (2015) Ribas, Á., Bouy, H., & Merín, B. 2015, A&A, 576, A52
- Ribas et al. (2014) Ribas, Á., Merín, B., Bouy, H., & Maud, L. T. 2014, A&A, 561, A54
- Rotundi et al. (2015) Rotundi, A., Sierks, H., Della Corte, V., et al. 2015, Science, 347, aaa3905
- Saffe et al. (2016) Saffe, C., Flores, M., Jaque Arancibia, M., Buccino, A., & Jofré, E. 2016, A&A, 588, A81
- Saffe et al. (2017) Saffe, C., Jofré, E., Martioli, E., et al. 2017, A&A, 604, L4
- Salaris & Cassisi (2017) Salaris, M. & Cassisi, S. 2017, Royal Society Open Science, 4, 170192
- Schuler et al. (2011a) Schuler, S. C., Cunha, K., Smith, V. V., et al. 2011a, ApJ, 737, L32
- Schuler et al. (2011b) Schuler, S. C., Flateau, D., Cunha, K., et al. 2011b, ApJ, 732, 55
- Spina et al. (2016) Spina, L., Meléndez, J., & Ramírez, I. 2016, A&A, 585, A152
- Spina et al. (2014a) Spina, L., Randich, S., Palla, F., et al. 2014a, A&A, 568, A2
- Spina et al. (2014b) Spina, L., Randich, S., Palla, F., et al. 2014b, A&A, 567, A55
- Stahler (1988) Stahler, S. W. 1988, ApJ, 332, 804
- Stahler & Palla (2005) Stahler, S. W. & Palla, F. 2005, The Formation of Stars
- Stahler et al. (1986) Stahler, S. W., Palla, F., & Salpeter, E. E. 1986, ApJ, 302, 590
- Steigman (2006) Steigman, G. 2006, International Journal of Modern Physics E, 15, 1
- Suzuki et al. (2013) Suzuki, T. K., Imada, S., Kataoka, R., et al. 2013, PASJ, 65, 98
- Takeda et al. (2007) Takeda, G., Ford, E. B., Sills, A., et al. 2007, ApJS, 168, 297
- Takeda (2005) Takeda, Y. 2005, PASJ, 57, 83
- Takeda et al. (2017) Takeda, Y., Hashimoto, O., & Honda, S. 2017, PASJ, 69, 1
- Takeda et al. (2013) Takeda, Y., Honda, S., Ohnishi, T., et al. 2013, PASJ, 65, 53
- Takeuchi & Lin (2002) Takeuchi, T. & Lin, D. N. C. 2002, ApJ, 581, 1344
- Takeuchi & Lin (2005) Takeuchi, T. & Lin, D. N. C. 2005, ApJ, 623, 482
- Taki et al. (2016) Taki, T., Fujimoto, M., & Ida, S. 2016, A&A, 591, A86
- Teske et al. (2016a) Teske, J. K., Khanal, S., & Ramírez, I. 2016a, ApJ, 819, 19
- Teske et al. (2016b) Teske, J. K., Shectman, S. A., Vogt, S. S., et al. 2016b, AJ, 152, 167
- Théado & Vauclair (2012) Théado, S. & Vauclair, S. 2012, ApJ, 744, 123
- Thorngren et al. (2016) Thorngren, D. P., Fortney, J. J., Murray-Clay, R. A., & Lopez, E. D. 2016, ApJ, 831, 64
- Tognelli et al. (2015) Tognelli, E., Prada Moroni, P. G., & Degl’Innocenti, S. 2015, MNRAS, 454, 4037
- Tognelli et al. (2016) Tognelli, E., Prada Moroni, P. G., & Degl’Innocenti, S. 2016, MNRAS, 460, 3888
- Tsiganis et al. (2005) Tsiganis, K., Gomes, R., Morbidelli, A., & Levison, H. F. 2005, Nature, 435, 459
- Tsukamoto et al. (2017) Tsukamoto, Y., Okuzumi, S., & Kataoka, A. 2017, ApJ, 838, 151
- Tucci Maia et al. (2014) Tucci Maia, M., Meléndez, J., & Ramírez, I. 2014, ApJ, 790, L25
- Vauclair (2004) Vauclair, S. 2004, ApJ, 605, 874
- Venn & Lambert (1990) Venn, K. A. & Lambert, D. L. 1990, ApJ, 363, 234
- Vorobyov et al. (2017) Vorobyov, E. I., Elbakyan, V., Hosokawa, T., et al. 2017, A&A, 605, A77
- Wahl et al. (2017) Wahl, S. M., Hubbard, W. B., Militzer, B., et al. 2017, Geophysical Research Letters, 44, 4649, 2017GL073160
- Weidenschilling (1977) Weidenschilling, S. J. 1977, MNRAS, 180, 57
- Wood et al. (2005) Wood, B. E., Müller, H.-R., Zank, G. P., Linsky, J. L., & Redfield, S. 2005, ApJ, 628, L143
- Yasui et al. (2014) Yasui, C., Kobayashi, N., Tokunaga, A. T., & Saito, M. 2014, MNRAS, 442, 2543
Appendix A Underlying physics of internal structure evolution
In this appendix, we describe the underlying physics of the pre-MS evolution of stellar internal structure, as governed by their entropy profile, opacity, and mixing of freshly accreted deuterium. Our goal is to explain the evolution of the convective and radiative zones shown in Fig. 4.
For a homogeneous composition, the convective stability criterion (i.e., Schwarzschild criterion, ) is expressed as a condition on the Rosseland opacity, (see, e.g., Kippenhahn & Weigert 1990):
| (9) |
where is the luminosity, the temperature, the pressure, the Stefan-Boltzmann constant, the gravitational constant, the mass coordinate, and and the radiative and adiabatic temperature gradient (), respectively. We note that for the monoatomic perfect gas.
Figure 12 shows that this critical opacity, , remains relatively constant around in time and for different values (i.e., the points in Fig. 12 have the almost same value). The evolution of the opacity in the stellar interior thus plays a crucial role in the growth of the radiative zone. The radiative zone appears when the opacity at the center falls below that critical value. This occurs when the central temperature reaches – (Chabrier & Baraffe 1997).
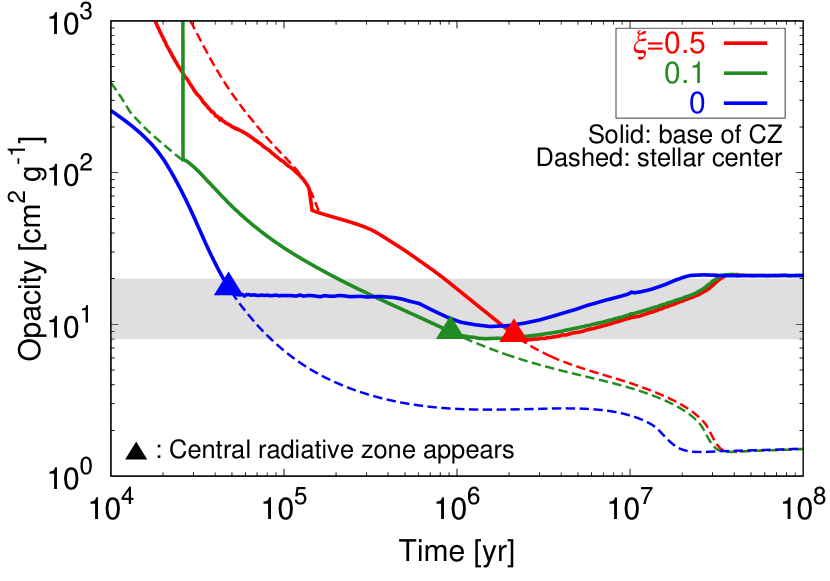
Convective stability is also governed by deuterium burning during the protostellar phase because it maintains a high luminosity throughout the interior. However, since pre-existing deuterium is quickly depleted, the supply of fresh deuterium by the accreting flow is most important. This fresh deuterium is delivered down into the stellar interior by convective turbulent mixing. After a radiative core emerges, the fresh deuterium is no longer delivered to the star’s central region but is burned at the base of the CZ (forming the so-called radiative barrier, see Palla & Stahler 1993).
The importance of deuterium burning is demonstrated in Fig. 13, which shows pre-MS evolutions obtained with a diffusion coefficient of convective mixing, . Here we artificially increase or decrease over that predicted from mixing length theory by a factor of 100. Figure 13 shows that the value at which the central radiative zone appears is not universal but can be affected by mixing processes in protostars. When diffusion in the convective zone is slower, less deuterium is brought to the central region, the central luminosity is smaller, is larger, and therefore the radiative zone appears more rapidly. The opposite is true for a larger diffusion coefficient. The results clearly indicate that the development of a radiative core is controlled by not only the opacity but also the deuterium burning.
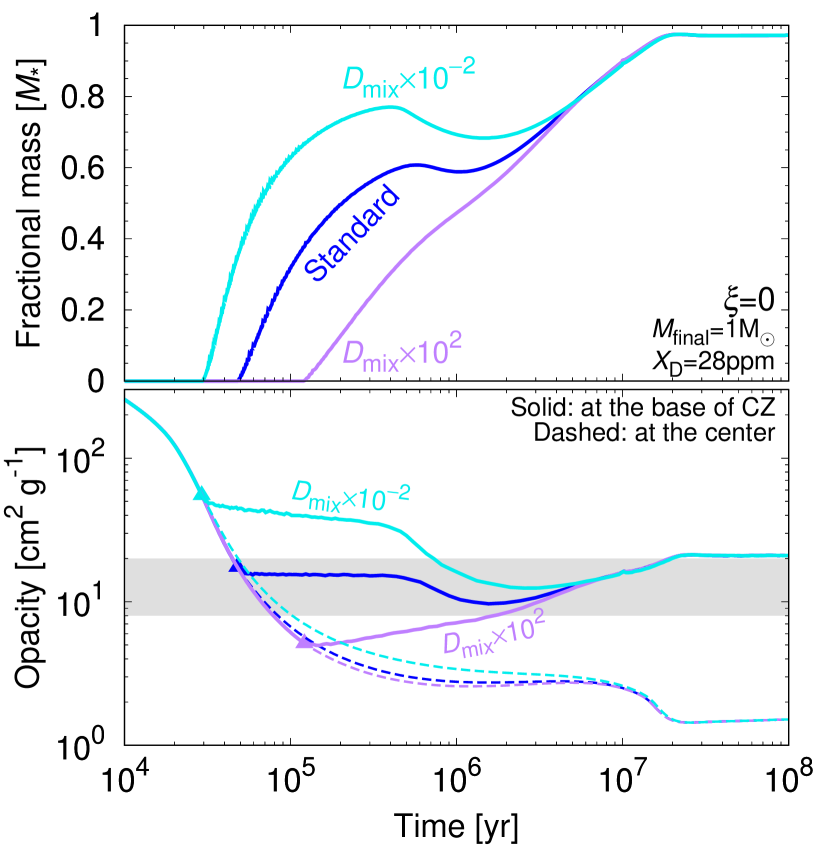
Let us now turn to Fig. 4. We explain three noteworthy features seen in the different panels: (i) a rapid development of a radiative core for low values, (ii) an expansion of the surface CZ in the case at around , and (iii) in the case, a central region which is always radiative.
First and most importantly, Fig. 4 illustrates that the internal structure evolutions strongly depend on : stars with a lower value develop a radiative core more rapidly. This can be understood as follows. Such stars have a smaller radius (see Paper I). From the virial theorem, this corresponds to a higher internal temperature. This results in a lower opacity (cf. Kramers’ law; ). Therefore stars formed with lower values develop a radiative core more rapidly.
Let us explain (ii), namely the temporary expansion of the surface CZ in the case at around 1 Myr. Since the stellar interior becomes hot and less opaque at this moment, a large amount of entropy is carried toward the surface region (so-called luminosity wave, Stahler et al. 1986). However the surface region is still opaque. Therefore the entropy accumulates at the base of CZ and then the surface CZ expands for a while (see also Fig. B.2 of Paper I).
Finally, let us explain why the non-uniform heat injection model with is characterized with a center that is always radiative (see Fig. 4d). This case corresponds to an accretion heat that is deposited entirely in an outer, narrow region. The specific entropy gradient is therefore locally positive during the protostellar phase. Consequently, the temperature maximum is located slightly off-center and therefore deuterium burning also starts away from the center. As a result, the central region always remains radiative. This means that the primordial composition may be preserved in the central region and may differ from that in the rest of the star. This may be testable by asteroseismic observations.
Appendix B Varying accretion history and initial metallicity
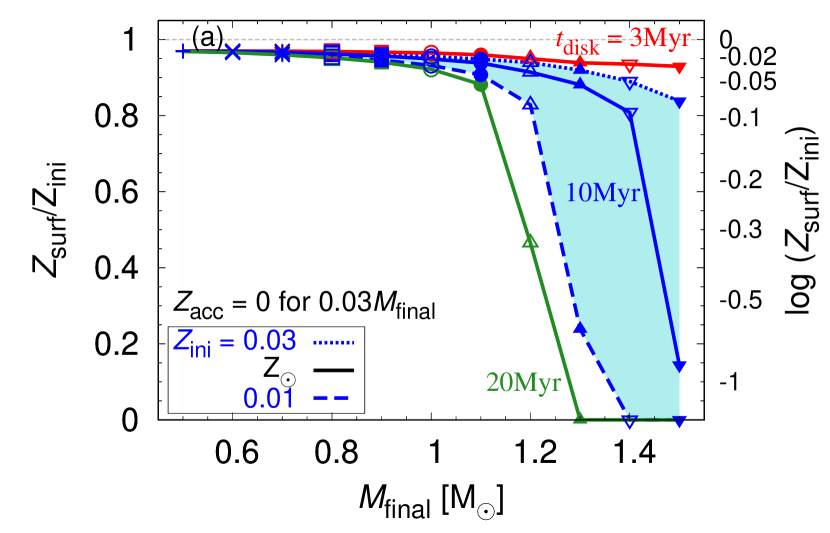
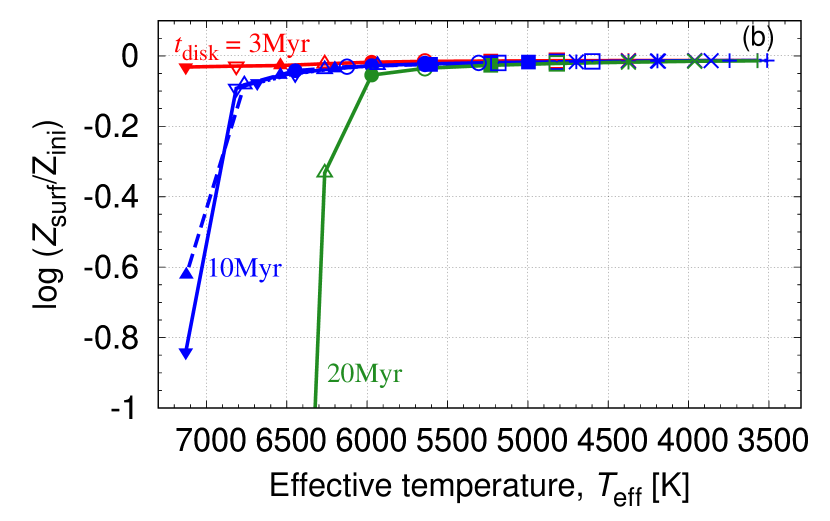
Here we discuss the effect of varying accretion history and initial metallicity. In the main text, we adopted fiducial values for the disk lifetime, Myr and for the initial metallicity . However there can be star-to-star scatters or systematic offsets in these values. For example the mean metallicity of the Hyades cluster is larger than the solar (Takeda et al. 2013). Figure 14 shows the values of with varying and : and 20 Myr (e.g., Haisch et al. 2001) and and 0.03. The other settings are set to be fiducial ones, namely , , a uniform heat distribution and .
Figure 14a shows that metal-poor high-mass () stars are more significantly affected by dilution. As we described in Appendix A, the shrinkage of CZ is controlled by the opacity (and deuterium burning). Therefore since higher-mass stars (see also Fig. 6) and metal-poor stars have a lower opacity, they have a thin CZ.
By contrast, in the – plane (Fig. 14b), the resultant values are not sensitive to values. This is because both the CZ extension and are sensitive to the metallicity. Indeed, at a fixed mass, a larger metallicity corresponds to a lower and to a thicker CZ due to a larger opacity. Therefore, to obtain the same , given a larger metallicity, a larger mass is required, and vice versa. This results in a thicker CZ. The two combined effects almost counterbalance one another, leading to a weak dependency of (and therefore ) on the metallicity at fixed .
As for the variation in , Figs. 14a and 14b show that it has a significant impact on resultant values due to the dilution. This is because in the late phase (0.97–1 ) are different: it is large in the cases with (–3 Myr), whereas small with (–20 Myr). This is different from the protostellar evolution which is not sensitive to the accretion history (see, e.g., Hosokawa et al. 2011).
The protostellar evolution is governed by accretion and nuclear burning (see Appendices B and C of Paper I). Therefore with the same and values, stellar structures at a given mass are almost the same. By contrast, in the pre-MS phase, since accretion rate is small (or zero), radiative cooling dominates.
Therefore, we conclude that our discussions on the comparisons with observations in Sects. 4.3–4.5 are not affected by the uncertainties in metallicity, but the variation in has a significant impact on . We may consider that a relatively long-lived disk such as the one chosen in our fiducial case will maximize the effect of planet formation on stellar metallicity. Larger values are possible however, for disks which are extremely long lived as the 20 Myr case depicted here.
Appendix C Evolutionary models of stellar interiors
The evolutionary models of stellar interiors shown in this paper may be obtained freely from the CDS (see the footnote in page 1). The input parameters are , or 28 ppm, the uniform heat distribution or and . We adopt a solar metallicity to match the present Sun’s radius and luminosity and . The models differ slightly from those of Paper I999http://cdsarc.u-strasbg.fr/viz-bin/qcat?J/A+A/599/A49, due to different hypotheses for the accretion rate and element diffusion.
The table includes (only between 0.3 Myr and 10 Myr, see Sect. 5.2), in addition to the temporal evolutions of the mass of an outer convective zone, . From this and Eq. 3, the surface metallicity, , of stars being affected by planet formation can be estimated as
| (10) |
where the planet formation time, , indicates the time when changes from an initial value to a lower value and is the mass to be accreted. Readers can evaluate consequences of planet formation on stellar surface composition using the results in Table 6 and Eq. (10).
| Settings | Results | |||||||||
|---|---|---|---|---|---|---|---|---|---|---|
| a𝑎aa𝑎afootnotemark: | Age | b𝑏bb𝑏bfootnotemark: | ||||||||
| [ppm] | [yr] | [K] | ||||||||
| 0.1 | 28 | -1.0 | 1.0 | 0.0E+00 | 1.00000E-02 | 1.00000E-02 | -1.00000E+00 | 1.51399E+00 | 5.44190E-02 | 2.21056E+03 |
| 0.1 | 28 | -1.0 | 1.0 | 1.0E+03 | 1.99973E-02 | 4.35589E-03 | -1.00000E+00 | 1.13449E+00 | 3.29172E-02 | 2.30986E+03 |
| Continued | ||||||||||
| Model | ||||
| [ppm] | ||||
| 1 | 0.5 | 28 | 0.5–1.5 | |
| 2 | 0.1 | 28 | 0.5–1.5 | |
| 3 | 0 | 28 | 0.5–1.5 | |
| 4 | 0.1 | 28 | 0.1 | 0.5–1.5 |
| 5 | 0.5 | 20 | 0.5–1.5 | |
| 6 | 0.1 | 20 | 0.5–1.5 | |
| 7 | 0 | 20 | 0.5–1.5 |