Improved Comparison of Measurements and Calculations of via transverse momentum broadening in Relativistic Heavy Ion Collisions using di-hadron correlations.
Abstract
The renewed interest in analyzing RHIC data on di-hadron correlations as probes of final state transverse momentum broadening as shown at Quark Matter 2018 MiklosQM2018 by theoretical calculations ChenCCNUPLB773 compared to experimental measurements PXppg074 ; STARPLB760 led me to review the quoted theoretical calculations and experimental measurements because the theoretical calculation ChenCCNUPLB773 does not show the PHENIX measurements PXppg074 as published. The above references were checked and fits were performed to the published measurements PXppg074 ; PXppg083 to determine from the measured azimuthal broadening to compare with the theoretical calculation ChenCCNUPLB773 . The new results will be presented in addition to some corrections to the previous work MJTPLB771 . The measured values of show the interesting effect of being consistent with zero for larger values of associated GeV/c which is shown to be related to well known measurements of the ratio of the Au+Au to p+p associated distributions for a given trigger called ppg106 ; ALICEPLB763 . Di-jets rather than di-hadrons are proposed as an improved azimuthal broadening measurement to determine and possibly .
I Introduction
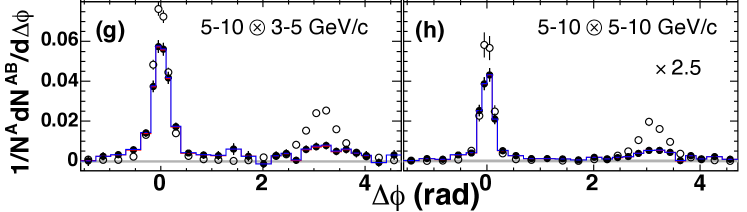
When I was reviewing talks from Quark Matter 2018, a slide in a presentation by Miklos Gyulassy MiklosQM2018 drew my attention because it involved a figure (Fig. 2) from a preprint ChenCCNU0616 that I had referenced in my publication on measuring from di-hadron correlations MJTPLB771 . I had not paid much attention to that figure previously, but in comparing the two plots labeled PHENIX in Fig. 2 which is reproduced from Ref. ChenCCNUPLB773 to the actual plots in Fig. 1 reproduced from the quoted PHENIX publication PXppg074 I realized that the the data in the plots in Fig. 2 reproduced from Ref. ChenCCNUPLB773 looked nothing like the measurement shown in Fig. 1 reproduced from the quoted PHENIX publication PXppg074 . Notably, in the actual PHENIX data PXppg074 shown in Fig. 1 errors are shown for the same side peaks in pp and AuAu, but no errors are shown for the away-side peaks ( radians) for either pp or AuAu. However, in Fig. 2 reproduced from Ref.ChenCCNUPLB773 which is labelled as PHENIX data from reference PXppg074 errors are shown for the pp and AuAu away-side data.
To understand this issue, I checked with the authors of Fig. 2 reproduced from Ref. ChenCCNUPLB773 who informed me that software called xyscan was used on Figure 1 reproduced from Ref. PXppg074 to get the data points and the error used in Fig. 2 reproduced from Ref. ChenCCNUPLB773 . Also the the points for both pp and AA data were rescaled to make them normalize to 1 in Ref.ChenCCNUPLB773 , which were called ‘self normalized’ data.
In my opinion the derived PHENIX data in Fig. 2 reproduced from Ref.ChenCCNUPLB773 looked nothing like the published PHENIX data in Fig. 1. Admittedly a listing of the data in Fig. 1 was not available, but a following publication with the exact same figure PXppg083 did provide a listing of the data points ppg083data 111Ref. ppg083data shows that these are the actual data from Fig. 1 of Ref PXppg074 . Given these actual data points for the PHENIX dihadron correlations shown in Fig. 3 I first fit the data to Gaussians in () for the away side and the trigger side in order to compare the data and fits to Fig. 2. The y axis for the AuAu data and fits in Fig. 3 are rescaled so that the peaks in the pp and AuAu fits lie on top of each other. The STAR data and fits from Ref. MJTPLB771 are also shown in Fig. 3.
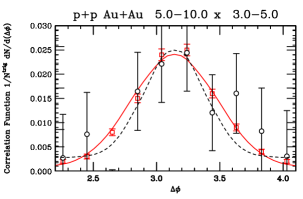
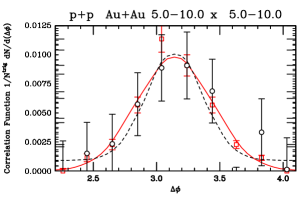
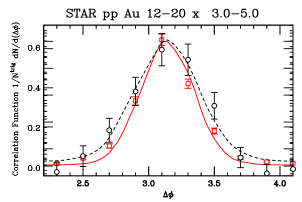
The most notable observation about the fits in Fig. 3 is that for both ranges, the PHENIX AuAu fits have smaller than the pp fits, which is more convenient to quote in the variable as follows: for PHENIX GeV/c, the values of for GeV/c are (GeV/c)2, /dof=22/23, for AuAu 0-20% and (GeV/c)2 for pp; and for GeV/c, (GeV/c)2, /dof=13/23, for AuAu and (GeV/c)2 for pp. For the STAR AuAu 00-12%, , GeV/c data, the results are the same as in Ref. MJTPLB771 , namely (GeV/c)2 for AuAu and (GeV/c)2 for pp.
From these numbers it is obvious MJTPLB771 that (which corresponds to the on Fig. 2) is negative for the PHENIX data and thus not equal to GeV2 quoted on Fig. 2 reproduced from Ref. ChenCCNUPLB773 . For readers who may not understand this as obvious, a review of the method to calculate is presented followed by the calculations of from the PHENIX and STAR data in Fig. 3 and some other published PHENIX data, leading to an interesting conclusion.
II A review and improvement of the method to measure from di-hadron azimuthal broadening
The BDMPSZ BSZARNPS50 QCD based prediction for detecting the QGP is jet quenching produced by the energy loss, via LPM coherent radiation of gluons, radiated from an outgoing parton with color charge fully exposed in a medium with a large density of similarly exposed color charges (i.e. the QGP). As a parton from hard-scattering in the A+B collision exits through the medium it can radiate a gluon; and both continue traversing the medium. It is important to understand that “Only the gluons radiated outside the cone defining the jet contribute to the energy loss.” BSZARNPS50 . Also because of the angular ordering of QCD MuellerPLB104 , the angular cone of any further emission will be restricted to be less than that of the previous emission and will end the energy loss once inside the jet cone. However complications might occur in the deconfined QGP YacineIJMPA .
The energy loss of the original outgoing parton, , per unit length () of a medium with total length , is proportional to the total 4-momentum transfer-squared, , with the form:
| (1) |
where , is the mean momentum transfer per collision, and the transport coefficient
is the 4-momentum-transfer-squared to the medium per mean free path, .
Also, the accumulated momentum-squared, transverse to the parton from its collisions traversing a length in the medium is well approximated by
| (2) |
This is strongly correlated to the energy loss Eq. 1 BDMPSNPB484 and results in the azimuthal broadening of the outgoing parton from its original direction by since only the component is in the azimuthal direction, to the scattering plane. The original parton that scattered had a so-called FFF intrinsic mean transverse momentum which is perpendicular to the collision axis but can act both perpendicular to the scattering plane and in the scattering plane at random. This means that in a pp collision, the mid-rapidity di-jets from hard-parton-parton scattering are not back-to-back in azimuth but are acollinear from the random sum of from both scattered partons or , of which only half or affects the azimuthal broadening while the other half unbalances the original equal and opposite transverse momenta of the jets MJTPLB771 . In an AA collision this di-jet gets further broadened in azimuth by the random sum of the azimuthal component from each outgoing jet or , so that the di-jet azimuthal broadening acoplanarity in AA collisions compared to pp collisions should be
| (3) |
since only the component of to the scattering plane affects . 222Ref. MJTPLB771 had in Eq. 3 because I forgot that the di-hadron correlation represents both the trigger and away-side scattered partons. This is the azimuthal di-jet broadening from the BDMPSZ energy loss in the medium. Here denotes the intrinsic rms. transverse momentum of the hard-scattered parton in a nucleon in an AA collision plus any medium effect; and denotes the reduced value of the pp comparison di-hadron measurement with and correcting for the lost energy of the scattered partons in the QGP MJTPLB771 . This reduces to the simpler equation when the equation for the for di-hadrons is substituted MJTPLB771 :
| (4) |
where and the di-hadrons with and , with ratio , are assumed to be fragments of jets with transverse momenta and with ratio , where is the fragmentation variable, the fraction of momentum of the trigger particle in the trigger jet. For di-jet measurements, Eq. 4 becomes even simpler: i) because the trigger and away ‘particles’ are the jets; ii) because the trigger ‘particle’ is the entire jet not a fragment of the jet; iii) . This reduces Eq. 4 for di-jets to:
| (5) |
I checked Eq. 5 against a prediction MuellerPLB763 for 35 GeV/c jets at RHIC at =200 GeV with =0 GeV2 (pp), and for AA, =8 GeV2 and 20 GeV2. I got 9.7 GeV2 and 21.5 GeV2 respectively for the 8 GeV2 and 20 GeV2 curves subtracting the pp value of .
II.1 How to Find , , and the energy loss of for dihadrons
II.1.1 and
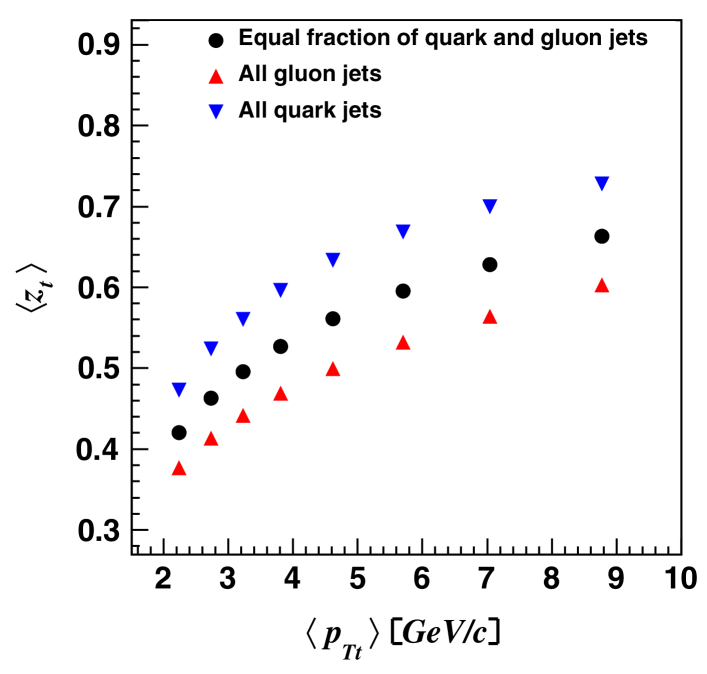
At RHIC, in pp and AuAu collisions as a function of centrality the spectra with GeV/c all follow the same power law with ppg080 . The Bjorken parent-child relation and ‘trigger-bias’ JacobPLC48 then imply that the single particle cross section has the same power law shape, , as the parent jet cross section and that large values of dominate the single-particle cross section. This means that the shift () in the AA Jet spectrum at a given from the corrected pp cross section can be measured from the shift in the trigger hadron spectrum ppg133 ; MJTPLB771 . Similarly, the as a function of can be calculated ppg089 ; ppg029 (Fig. 4) using the measured fragmentation functions from ep collisions DELPHI ; OPAL . The difference in for pp and AuAu due to the shift in the spectrum is considerably less than the error in the calculated so the calculated from pp spectrum is used for the AuAu spectrum with the same MJTPLB771 .
II.1.2 The distribution from a trigger measures the ratio of the away jet to the trigger jet : .
As discussed in Ref. MJTPLB771 it was assumed since the high discovery at the CERN ISR that the disribution would measure the away-jet fragmentation function as is does for direct-photon triggers ppg095 . However it was found at RHIC ppg029 that the distribution (which PHENIX calls and STAR calls ) measured the ratio of the away-jet to trigger-jet transverse momenta (Eq. 6)
| (6) |
with the value of () fixed as determined in Ref. ppg080 , where is the power-law of the inclusive spectrum and is observed to be the same in pp and AuAu collisions in the range of interest.
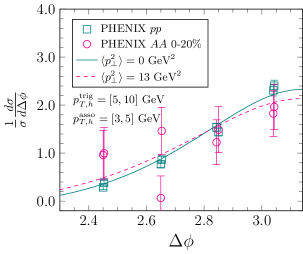
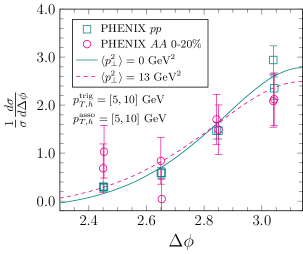
Figure 5 shows a fit of Eq. 6 to the PHENIX AuAu 0-20% and pp distributions in a region with GeV/c, close to the GeV/c region in Fig. 3 with GeV/c. The results are in pp and AuAu (dashes). What is more interesting is a fit to Eq. 6 for and plus another term of Eq. 6 with fixed at the pp value, with the normalization fitted, compared to the for the partons that have lost energy. The result is the solid AuAu curve with a much better which is notably parallel to the pp curve for ( GeV/c).
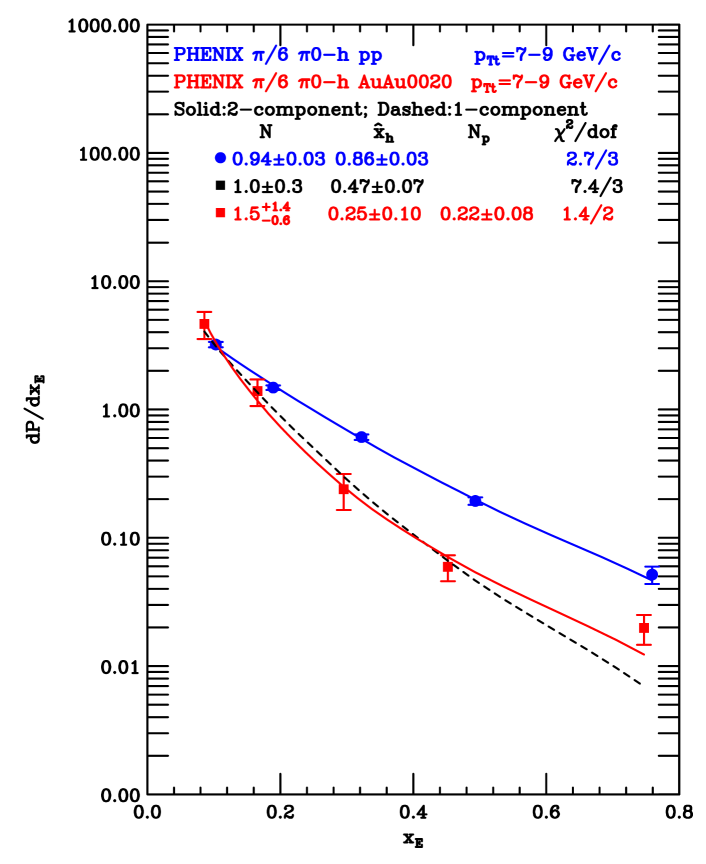
II.1.3 This effect is well known under a different name
One possible explanation is that in this region for GeV/c, which is at a fraction of the distribution, these hard fragments are distributed narrowly around the jet axis so that they are not strongly affected by the medium YacineIJMPA . An unlikely possibility is from tangential parton-parton collisions at the periphery of the AA overlap region which has probability much smaller than the ratio.
Either possibility is consistent with measurements of the ratio of the AuAu to pp (or ) distributions for a given which are called distributions (Fig. 6 ppg106 ).
All distributions ever measured show the same effect as in Fig. 6, they fall in the range GeV/c and then remain constant. The same effect can be seen in an measurement in =2.76 TeV pp and PbPb 0-10% by ALICE at the LHC ALICEPLB763 . The fact that remains constant above GeV/c means that the ratio of the away-jet to the trigger jet transverse momenta in this region remains equal in AA and pp , i.e. no apparent suppression via energy loss in this region. This effect also causes problems in the following calculations of from the di-hadron correlations.
III Calculation of from di-hadron azimuthal broadening.
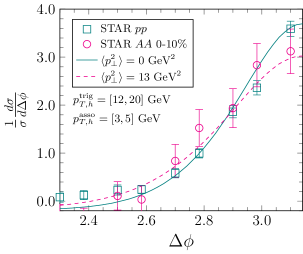
The calculations of for the STAR measurement STARPLB760 in Fig. 3 as well as for GeV/c performed in Ref MJTPLB771 333The sharp-eyed reader will notice that the values in Ref. MJTPLB771 were and GeV2 for two reasons: first is the in Eq. 3 there, second was a miscalculation of the error which should have been obvious from the errors in which are unchanged. with the values , are given in Table 1.
| STAR PLB760 | ||||
|---|---|---|---|---|
| Reaction | GeV/c | GeV/c | (GeV/c)2 | GeV2 |
| pp | 14.71 | 1.72 | ||
| pp | 14.71 | 3.75 | ||
| AuAu 0-12% | 14.71 | 1.72 | ||
| AuAu 0-12% | 14.71 | 3.75 | ||
The value of GeV2 for the fit to the GeV/c STAR data shown in Fig. 3 is consistent with zero and clearly in significant disagreement with the proposed GeV2 quoted on Fig. 2 ChenCCNUPLB773 . The value of GeV2 in the lower bin is closer to the prediction, within 2.7 standard deviations, but also consistent with zero.
The calculations of from the fits to the PHENIX data in Fig. 3 with and are given in Table 2. The values of and GeV2 are negative, as noted above, and both consistent with zero but inconsistent with the predicted 13 GeV2.
| PHENIX PRC77 | ||||
|---|---|---|---|---|
| Reaction | GeV/c | GeV/c | (GeV/c)2 | GeV2 |
| pp | 8.08 | 3.75 | ||
| pp | 8.08 | 6.68 | ||
| AuAu 0-20% | 8.08 | 3.75 | ||
| AuAu 0-20% | 8.08 | 6.68 | ||
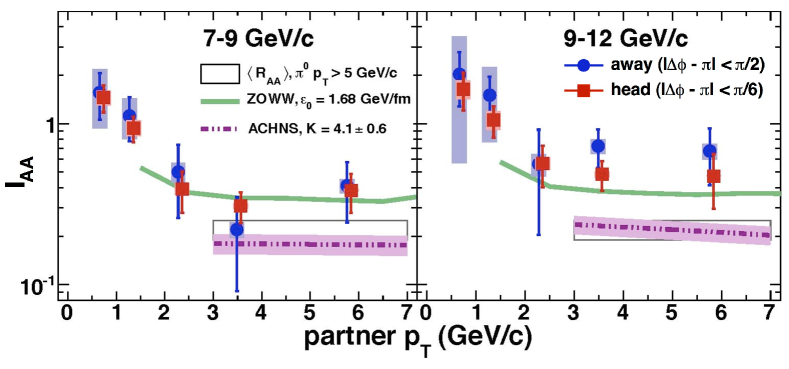
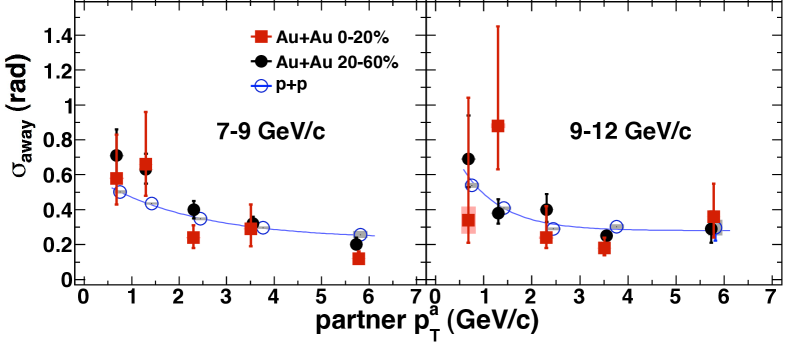
Although not discussed in Ref. ChenCCNUPLB773 , the PHENIX measurement of shown in Fig. 6 also provided values of for AuAu and pp plotted clearly (Fig. 7) so that values of can be read off practically by inspection. While is apparently larger in AuAu than in pp for GeV/c it is smaller or equal to the pp value for GeV/c, i.e. consistent with zero. Details for GeV/c are given in Table 3.
| PHENIX PRL104 | ||||
|---|---|---|---|---|
| Reaction | GeV/c | GeV/c | (GeV/c)2 | GeV2 |
| pp | 10.22 | 1.30 | ||
| pp | 10.22 | 2.31 | ||
| pp | 10.22 | 3.55 | ||
| pp | 10.22 | 5.73 | ||
| AuAu 0-20% | 10.22 | 1.30 | ||
| AuAu 0-20% | 10.22 | 2.31 | ||
| AuAu 0-20% | 10.22 | 3.55 | ||
| AuAu 0-20% | 10.22 | 5.73 | ||
IV Conclusion
When calculated with fits to the measured distributions in Fig. 3 the values of are inconsistent with the calculation of GeV2 claimed in Fig. 2 ChenCCNUPLB773 , for GeV/c. For values of GeV/c, separating the flow background causes the errors in the measurement of to be too large to obtain a reasonable value.
The measurement of and possibly can be greatly improved by measuring di-jet angular distributions rather than di-hadron distributions. The energy loss of the trigger jets can be determined by the shift in the spectrum from pp to AA the same way as for ppg133 ; MJTPLB771 . Then a plot of the of the away jets for a given trigger jet with analogous to Fig. 5 and an evaluation of from and by Eq. 5 as a function of might allow the dependence to be factored out or determined which would lead to a experimental measurement of .
Acknowledgements.
Research supported by U. S. Department of Energy, Contract No. DE-SC0012704.References
- (1) M. Gyulassy et al., https://indico.cern.ch/event/656452/contributions/2869930/
- (2) L. Chen, G.-Y. Qin, S.-Y. Wei, B.-W. Xiao and H.-Z. Zhang, arXiv:1607.01932v1.
- (3) M. J. Tannenbaum, Phys. Lett. B771, 553-557 (2017).
- (4) PHENIX Collab., (A. Adare et al.), Phys. Rev. C77, 011901(R) (2008).
- (5) STAR Collab, (L. Adamczyk et al.), Phys. Lett. B760, 689-696 (2016).
- (6) L. Chen, G.-Y. Qin, S.-Y. Wei, B.-W. Xiao and H.-Z. Zhang,Phys. Lett. B773, 672-676 (2017).
- (7) PHENIX Collab., (A. Adare et al.), Phys. Rev. C77, 014901 (2008).
- (8) https://www.phenix.bnl.gov/phenix/WWW/info/data/ppg074/fig1.txt
- (9) R. Baier, D. Schiff, and B. G. Zakharov, ARNPS50, 37-69 (2000).
- (10) A. H. Mueller, PLB104, 161-164 (1981).
- (11) Y. Mehtar-Tani, J.G. Milhano, and K. Tywoniuk, IJMPA 28, 1340013 (2013). arXiv:1302.2579.
- (12) R. Baier, Yu. L. Dokshitzer, A. H. Mueller, S. Peigne and D. Schiff, Nucl. Phys. B484, 265-282 (1997).
- (13) R. P. Feynman, R. D. Field and G. C. Fox, Nucl. Phys. B128, 1-65 (1977).
- (14) A. H. Mueller, B. Wu, B.-W. Xiao and F. Yuan, Phys. Lett. B763, 208-212 (2016).
- (15) PHENIX Collab., (A. Adare et al.), Phys. Rev. Lett. 101, 232301 (2008).
- (16) M. Jacob and P. V. Landshoff, Phys. Repts. 48, 285-350 (1978).
- (17) PHENIX Collab., (A. Adare et al.), Phys. Rev. C87, 034911 (2013).
- (18) PHENIX Collab., (A. Adare et al.), Phys. Rev. D81, 012002 (2010).
- (19) PHENIX Collab., (S. S. Adler et al.), Phys. Rev. D74, 072002 (2006).
- (20) DELPHI Collab., (P. Abreu et al.), Eur. Phys. J. C13, 573-589 (2000).
- (21) OPAL Collab., (G. Alexander et al.), Z. Phys. C69, 543-560 (1996).
- (22) PHENIX Collab., (A. Adare et al.), Phys. Rev. D82, 072001 (2010).
- (23) PHENIX Collab., (A. Adare et al.), Phys. Rev. Lett. 104, 252301 (2010).
- (24) M. J. Tannenbaum, J. Phys: Conf. Series 589, 012019 (2015).
- (25) ALICE Collab., (J. Adam et al.), Phys. Lett. B763, 238-250 (2016).