A census of galaxy constituents in a Coma Progenitor observed at
Abstract
We present a detailed census of galaxies in and around PC217.96+32.3, a spectroscopically confirmed Coma analog at . Diverse galaxy types identified in the field include Ly emitters (LAEs), massive star-forming galaxies, and ultra-massive galaxies () which may have already halted their star formation. The sky distribution of the star-forming galaxies suggests the presence of a significant overdensity (), which is spatially offset from the previously confirmed members by 3–4 Mpc to the west. Candidate quiescent and post-starburst galaxies are also found in large excess (a factor of 8–15 higher surface density than the field) although their redshifts are less certain. We estimate that the total enclosed mass traced by candidate star-forming galaxies is roughly comparable to that of PC217.96+32.3 traced by the LAEs. We speculate that the true extent of P217.96+32.3 may be larger than previously known, a half of which is missed by our LAE selection. Alternatively, the newly discovered overdensity may belong to another Coma progenitor not associated with PC217.96+32.3. Expectations from theory suggest that both scenarios are equally unlikely (%), in the cosmic volume probed in our survey. If confirmed as a single structure, its total mass will be well in excess of Coma, making this an exceptionally large cosmic structure rarely seen even in large cosmological simulations. Finally, we find that the protocluster galaxies follow the same SFR- scaling relation as the field galaxies, suggesting that the environmental effect at is a subtle one at best for normal star-forming galaxies.
Subject headings:
cosmology: observations – galaxies: clusters: individual – galaxies: distances and redshifts – galaxies: evolution – galaxies: formation – galaxies: high-redshift1. Introduction
Local environment has a profound influence on the formation and evolution of galaxies. At low redshift, galaxies in dense cluster environments tend to be more massive, contain older stellar populations, have lower star formation rates and dust content, and a higher fraction have elliptical morphologies than their average field counterparts (Stanford et al., 1998; Blakeslee et al., 2003; van Dokkum & van der Marel, 2007; Eisenhardt et al., 2008). The redshift evolution of the cluster red sequence and the properties of cluster ellipticals strongly support a scenario in which cluster galaxies underwent early accelerated formation followed by swift quenching (e.g., Thomas et al., 2005; Bolzonella et al., 2010; Mancone et al., 2010; Fritz et al., 2014). While this general picture is accepted, the mechanisms responsible for the formation, evolution and quenching processes are still not well understood (e.g., Snyder et al., 2012).
In high-density environments, the accretion rates of infalling gas and the frequency of galaxy interactions are expected to be higher, fostering enhanced star formation activities. A merger of gas-rich galaxies may include an ultra-luminous infrared galaxy (ULIRG; Aaronson & Olszewski, 1984; Sanders & Mirabel, 1996) phase which efficiently converts the majority of their gas into stars over a short timescale. Dissipative gas-rich mergers may help the efficient feeding of gas into the central blackholes, triggering nuclear activity, which may quench star formation and create old, massive cluster ellipticals. (Hopkins et al., 2008). High-density environments are therefore expected to consist of diverse galaxy constituents, including normal star-forming galaxies, ULIRGs, X-ray sources, AGN, and massive quiescent galaxies. A detailed census of diverse galaxy ‘types’ and their spatial distribution within the large-scale structure are essential to obtain a more comprehensive understanding of how the high density environment drives the evolution.
To directly witness the key epoch of cluster galaxy formation, one needs to identify the galaxy populations residing in young ‘protoclusters’. In recent years, substantial progress has been made in the search for high-z protoclusters (see review by Overzier, 2016, and references therein). Searches around powerful radio sources at high redshift have identified significant galaxy overdensities (e.g., Venemans et al., 2005; Miley et al., 2006; Kajisawa et al., 2006; Venemans et al., 2007; Hatch et al., 2011; Noirot et al., 2018). A population of extremely dusty starburst systems, optically or X-ray-luminous AGN, and large Ly nebulae are reported in some of the known protoclusters (Matsuda et al., 2004; Dey et al., 2005; Prescott et al., 2008; Lehmer et al., 2009; Capak et al., 2011; Casey, 2016; Hung et al., 2016; Cai et al., 2017; Bădescu et al., 2017), in support of the theoretical expectations (but see Rigby et al., 2014; Kato et al., 2016). The existence of massive ‘red and dead’ galaxy candidates at offers tantalizing evidence that the formation of massive cluster ellipticals may have been well underway as early as 2 Gyr after the Big Bang (Kubo et al., 2013).
The number of confirmed protoclusters and protocluster candidates has been increasing rapidly (e.g., Lemaux et al., 2014; Cucciati et al., 2014; Toshikawa et al., 2016; Planck Collaboration et al., 2015; Lemaux et al., 2018; Cucciati et al., 2018), offering a promising outlook for future protocluster studies; such as the impact of environment on the galaxy inhabitants, as well as the evolutionary link between unvirialized proto-structures and present-day clusters.
Despite this progress, a clear and coherent physical picture of how cluster environment influences galaxy formation has yet to emerge. We do not yet know how dense protocluster environments influence the galaxy therein: e.g., are rare systems such as radio galaxies, quasars, Ly nebulae ubiquitous enough to be used as beacons of the highest density peaks of the universe? Do dense protocluster environments produce a different ‘zoo’ of galaxy constituents, or simply a scaled-up version of the average field? Addressing such questions may have an important cosmological implication: given their large pre-virialization volume and high galaxy overdensities, star formation in protoclusters can account for up to 30% of the cosmic star formation rate density at (Chiang et al., 2017).
Observationally, one of the main limitations has been the lack of our knowledge of the density structure of protoclusters. The angular size of the cosmic volume that will end up virialized by the present-day epoch is expected to be as large as 20′ – 30′ in the sky (e.g., Chiang et al., 2013; Muldrew et al., 2015), making it expensive to rely on blind spectroscopic programs to map out their structures with reasonable precision. To date, only a few systems exist with a detailed characterization of their sizes and density structures (Matsuda et al., 2005; Lee et al., 2014; Bădescu et al., 2017).
Another critical element in making progress is to obtain a detailed census of protocluster constituents. Understanding how different types of galaxy constituents are distributed within the large-scale structure is necessary to make a fair assessment of how the formation of galaxies is impacted by the environment in which they reside. For example, luminous Ly nebulae are often found located at the outskirts or an intersection of the densest regions of a protocluster (Matsuda et al., 2005; Bădescu et al., 2017). Several studies reported that powerful AGN may suppress low-level star formation activity and produce a deficit of Ly-emitting galaxies (e.g., Kashikawa et al., 2007; Goto et al., 2017) although claims to the contrary also exist (e.g., Cai et al., 2018).
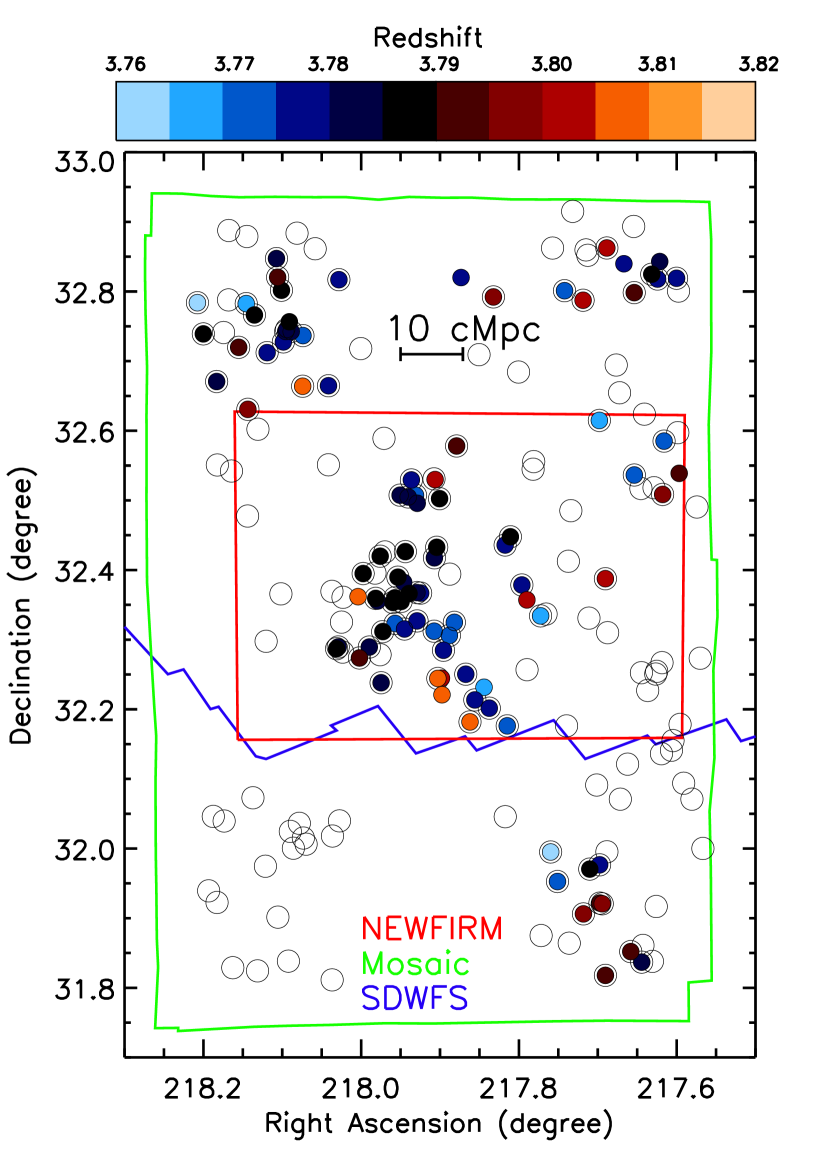
In this paper, we present a multi-wavelength study of galaxies along the sightline to the PC217.96+32.3 protocluster at , one of the most massive protoclusters discovered to date (Lee et al., 2014). Existing spectroscopy has confirmed 48 members at =3.76–3.81 (of which 34 lie at =3.77–3.79; Dey et al., 2016a). The locations of these members are indicated in Figure 1. The three-dimensional ‘map’ of the spectroscopic members suggests that the structure is mainly composed of two large groups with a small velocity offset and of additional smaller groups falling in toward the center (Dey et al., 2016a). Given the level and angular extent of the galaxy overdensity, PC217.96+32.3 will likely collapse into a system with a present-day mass of , making it one of the few spectroscopically confirmed Coma progenitors.
Having established the significance of the structure, we are motivated to take a broader view of the constituents of PC217.96+32.3; in particular, we are interested in identifying more evolved galaxies which may be more closely linked to massive cluster ellipticals in the present-day universe. To this end, we have conducted a deep near-infrared imaging survey of the region, sampling the continuum emission at rest-frame visible wavelengths.
In this paper, we present new near-infrared and -band imaging on the central portion of the protocluster field (§2). Combining this with existing optical data from the NOAO Deep Wide-Field survey (NDWFS: Jannuzi & Dey, 1999) and mid-infrared data from the Spitzer Space Telescope (Ashby et al., 2009), we identify a large overdensity of luminous galaxies in the region (§3). Population synthesis modeling of these galaxies suggests that they are likely to lie close to the redshift of the protocluster traced by the Lyman Alpha emitters (LAEs), although they have a somewhat different spatial distribution (§4). We discuss the masses, star-formation rates, and estimate the size of the overdensity in §4, and discuss the implications of finding such an overdense region in §5.
Throughout this paper, we use the WMAP7 cosmology from Komatsu et al. (2011). Distance scales are given in comoving units unless noted otherwise. Magnitudes are given in the AB system (Oke & Gunn, 1983) unless noted otherwise. In the adopted cosmology, PC217.96+32.3 at is observed when the universe was 1.7 Gyr old; 1′ corresponds to the physical scale of 2.1 Mpc at this redshift.
2. Data and Photometry
The multi-wavelength data available in this field include the optical data taken with three broad-band filters (: NOAO program IDs: 2012A-0454, 2014A-0164) using the Mosaic camera (Jacoby et al., 1998; Dey et al., 2016b) on the Mayall telescope, and the Spitzer IRAC 3.6m, 4.5m, 5.8m, and 8.0m data taken as part of the Spitzer Deep Wide-Field Survey (SDWFS: Ashby et al., 2009). As discussed in Dey et al. (2016a), the new optical data are combined with the reprocessed NDWFS data (Jannuzi & Dey, 1999) to create the final mosaicked images.
We obtained -band imaging from Hyper Suprime-Cam (HSC: Miyazaki et al., 2018) on the Subaru telescope, which provides the field-of-view of 1.77 deg2 and the pixel scale of 0168. The observations were carried out on March 27, 2015 with typical seeing of 0.6″, and consisted of 200 sec exposures with the total exposure time of 2.4 hours. The individual images were reduced and coadded using the HSC data processing pipeline (Bosch et al., 2018). The pipeline performed standard bias, dark, flat, and fringe calibrations, and the astrometry and photometry were calibrated based on Pan-STARRS1 surveys (Chambers et al., 2016) before coadding.
In March 2015 and March 2016, we obtained deep imaging of the survey field using the NEWFIRM camera (Autry et al., 2003; Probst et al., 2008, NOAO program IDs: 2015A-0168, 2016A-0185) on the Mayall 4m telescope of the Kitt Peak National Observatory. The camera has a pixel size of 0.4″ and covers a 28′28′ field of view. Images were obtained with and bands (KPNO filter no. HX (k3104) and KXs (k4102); =16310 and 21500 Å with the full-width-at-half-maximum (FWHM) of 3080 and 3200 Å respectively. We will refer to these filters as and band, hereafter). The pointing center – =14:31:28.8, =32:23:24.0 (J2000) – was chosen to cover the known protocluster region in its entirety while sampling a sufficient flanking region outside of it. We used individual exposure times of 60 sec for both bands, and dithered the telescope between exposures up to 2′ in random directions using the DEEPSPARSE dither pattern.
Each science frame is dark-subtracted and flat-fielded using the standard NOAO pipeline. We calibrate the astrometry using stars identified in the Sloan Digital Sky Survey DR7 catalog, and reproject each frame to a common tangent point with a pixel scale of 0258 in order to match that of the optical data. The relative intensity scale of each frame was determined using the mscimatch task. The reprojected images were combined into a final stack using a relative weight inversely proportional to the variance of the sky noise. Only the frames with the delivered image quality of seeing ″ are included in the image stack. We trim the image borders whose exposure is less than 20% of the maximum exposure time, and obtain the final coadded mosaic with an effective area of 28′35′ (0.27 deg2). The effective total exposure times of the mosaics are 12.1 and 18.7 hours for the and band, respectively. The photometric zeropoints are determined by cross-correlating the detected sources with the 2MASS point source catalog.
We resample the Spitzer SDWFS data to have a pixel scale of 0774, i.e., three times larger than the optical/near-IR data. Having the pixel scales to be integer multiples of one another is necessary for extracting optical photometry via a template-fitting method (see later). The limiting magnitudes measured in a 2″ diameter aperture are 26.88, 26.19, 25.37, and 25.10 AB in the optical data (), 24.05 and 24.83 AB in the near-IR data (), respectively. The seeing measured in the stacked images is 1.0″ in the images, 0.6″ in the -band, and 1.2″ in the bands. The sky coverage of our dataset is illustrated in Figure 1.
2.1. Multi-wavelength Catalog
We use the PSFEx software (Bertin, 2011) to measure the point spread function (PSF) of each image out to a radius of 3″. The two-dimensional PSFs are radially averaged to obtain the circularized PSF. Taking the worst-seeing data ( band) as the target PSF, we derive the noiseless convolution kernel for each image using the IDL routine MAX_ENTROPY. We use the full shape of the observed stellar profiles rather than assuming a function form such as Moffat profiles. The details of the PSF matching procedure are given in Xue et al. (2017). All optical and near-IR images are convolved with the appropriate kernels to create a set of PSF-matched science images.
Source detection and photometric measurements in the bands are carried out running the SExtractor software (Bertin & Arnouts, 1996) in dual mode on the PSF-matched images with the band data as detection band. At the protocluster redshift (), the band mainly samples the continuum emission at the rest-frame Å. The SExtractor parameter MAG_AUTO is used to estimate the total magnitude, while colors are computed from fluxes within a fixed isophotal area (i.e., FLUX_ISO). Colors measured in FLUX_ISO and FLUX_APER are in agreement with each other within 0.1 mag. As the images are PSF-matched, aperture correction is constant in all bands, and is given by the difference between MAG_AUTO and MAG_ISO estimated in the band.
For the Spitzer IRAC images, we take a different approach as it is not practical to convolve all images to the FWHM of any IRAC PSF, which is much broader (). We use the TPHOT software (Merlin et al., 2015) which performs ‘template fitting photometry’ similar to TFIT (Laidler et al., 2007; Lee et al., 2012). The software uses the information (source shape and position) supplied by a higher-resolution data and simultaneously fits the fluxes of multiple nearby sources to minimize residual flux. Since the FWHM of the band PSF is not negligible compared to that of the IRAC data, we also derive the convolution kernel using the same procedure above. For the effective PSF of the IRAC bands, we rotate the published IRAC PSF by a series of position angles with which the SDWFS data were taken, and create a weighted average image.
Finally, all photometric catalogs are merged together to create the final multi-wavelength catalog, where the TPHOT-measured fluxes are considered identical to the MAG_ISO fluxes of the optical/near-IR bands. Given the completeness of the band data, we only consider sources that have the signal-to-noise ratio (SNR) greater than 10, roughly corresponding to magnitude of 24.0 mag. The final multi-wavelength catalog contains 27,845 sources.
2.2. Photometric Redshift and SED Modeling
We derive photometric redshifts with the CIGALE code (Noll et al., 2009) using the full photometric information. The reliability of the photo- estimates is evaluated using the existing spectroscopic sources, which targeted a subset of UV-bright galaxies satisfying the Lyman Alpha Emitter (LAE) or Lyman Break Galaxy (LBG) color selection over a deg2 contiguous region in the PC217.96+32.3 field. The details of these selection methods in our survey field are discussed in Lee et al. (2013) and Lee et al. (2014). Of the 164 sources at , 48 galaxies lie within the NEWFIRM coverage. Of those, only 17 galaxies are bright enough to be detected in the band catalog with a photo- estimate.
We find the redshift dispersion = 0.15 where is the standard deviation of (). The large dispersion is due to three outliers which have . We find that their redshift probability density functions have two peaks, one at and the other at ; given that they are fainter than other galaxies, redshift degeneracy is caused by the fact that the spectral break between and is not strong enough to be unambiguously determined as a Lyman break. However, for all three galaxies the probability to lie at (computed by integrating the photometric redshift probability density function in the interval, which we denote as ) is greater than 50%. Excluding these three galaxies, the redshift dispersion is 0.06.
After considering the photometric redshift constraints of our spectroscopic sources, we select protocluster candidate galaxies by requiring that for the sources whose redshift probability density functions (PDFs) are singly peaked, and for those with doubly peaked PDFs. All of the 17 spectroscopic members meet these criteria. The range is chosen based on the photometric redshift error as discussed previously. A similarly inclusive range was used by Kubo et al. (2013), who studied the stellar populations in and around another protocluster. After visual inspection, we remove the sources with potential contamination in the photometry including those that are too close to brighter sources or to the edges of the images. Our protocluster galaxy sample consists of 263 sources, which also includes the spectroscopic members of the structure.
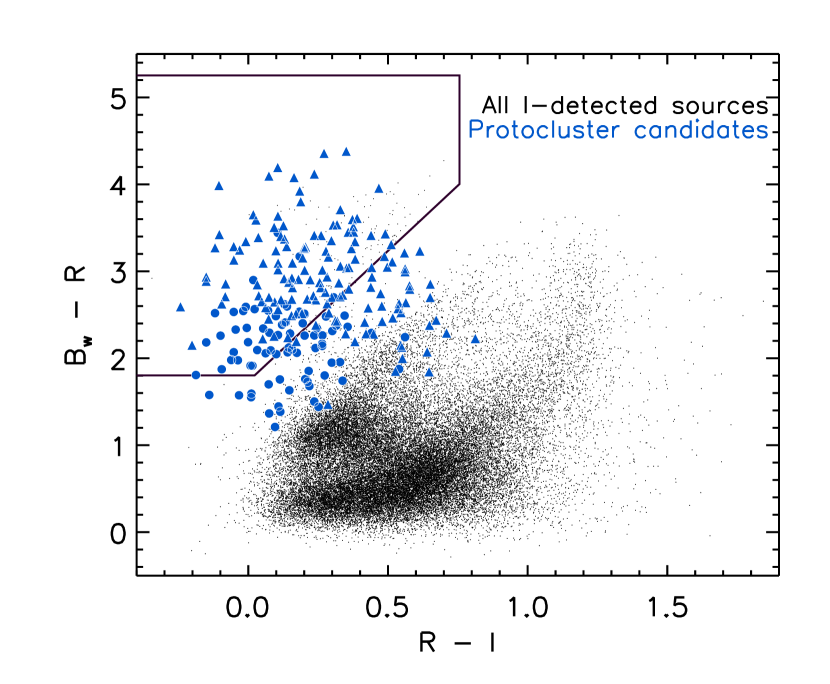
We examine the rest-frame UV colors of our protocluster candidates to assess their overall similarities to broad-band color-selected LBGs. We match their positions to the -band-selected photometric catalog used for the band dropout selection (Lee et al., 2013, 2014). Of the 263 sources, 202 galaxies (77%) are detected in the -band with the signal-to-noise ratio (SNR) . In Figure 2, we show their locations on the vs color diagram. Of the 202 galaxies, 135 galaxies (67%) satisfy the formal LBG criteria, and an additional 22 galaxies (11%) are within 0.25 mag of the formal color cut. The galaxies outside the selection window tend to be fainter in the and bands () while dropping out of the band, which results in a weaker constraint on the color. However, their UV colors are generally similar to their UV-brighter cousins. Their colors are redder than those within the LBG selection criteria, which likely contribute to a weaker spectral break in the band. Thus, we conclude that our photo- estimate works relatively well for moderately dust obscured star-forming galaxies whose spectral energy distributions (SEDs) are similar to those of LBGs.
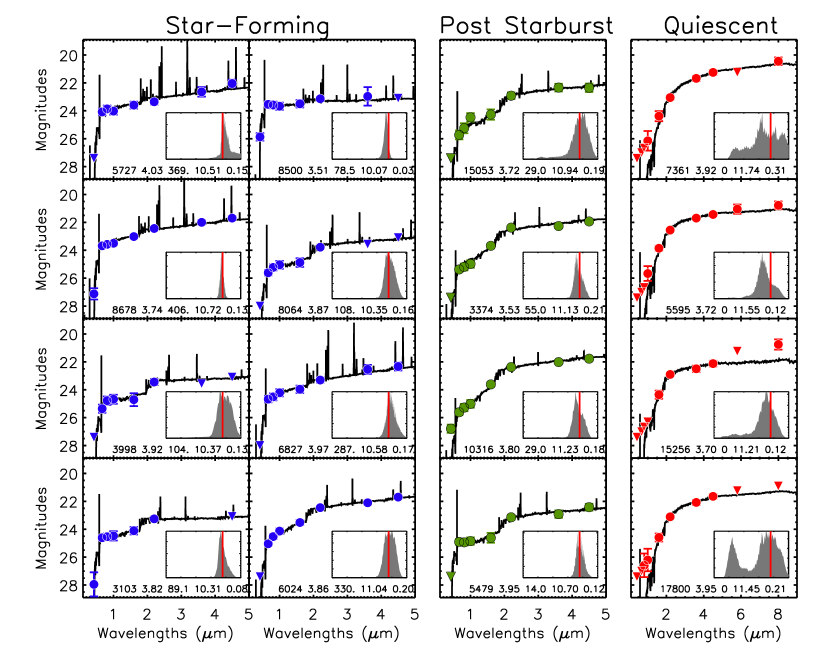
We determine the physical properties of the photo- protocluster candidates using the CIGALE software. We use the stellar population synthesis models of Bruzual & Charlot (2003), the Calzetti et al. (2000) reddening law with values ranging from 0 to 5 in steps of 0.1 mag, solar metallicity, and Salpeter (1955) initial mass function. We carry out three separate runs assuming a constant star formation histories, an exponentially declining SFH with values from 50 Myr to 10 Gyr in steps of 200 Myr, and a delayed star formation model. In Figure 3 (left two columns), we show the best-fit SED model, population parameters, and redshift PDF (inset) for a subset of our sample. As can be seen in the figure, these photo- candidates are mostly star-forming galaxies with a strong Ly break and relatively blue UV slope. The best-fit star-formation rate implies they are actively forming stars at a relatively high level (up to several hundreds solar mass per year) with a moderate amount of dust (E()0.1 – 0.2).
3. Balmer-break Galaxy Candidates in the Protocluster Field
3.1. Selection of galaxies with evolved stellar populations
As discussed in § 2.2, the photometric redshift technique is most effective in selecting LBG-like galaxies. Here, we use a set of color selection criteria tuned to isolate galaxies with a strong Balmer/4000Å break, a feature strongest in old stellar populations dominated by A and F stars. In this work, we use the following color criteria, which are similar to those found in the literature (e.g., Franx et al., 2003; Labbé et al., 2005; Kajisawa et al., 2006; Brammer & van Dokkum, 2007; Wiklind et al., 2008; Huang et al., 2011; Nayyeri et al., 2014; Mawatari et al., 2016):
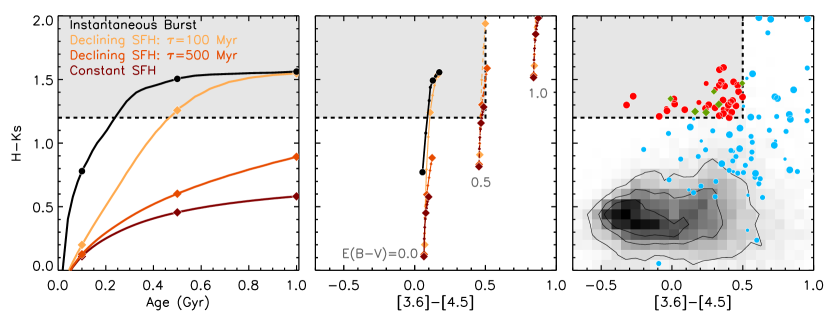
The first condition imposes that a strong Balmer/4000Å break falls between the and bands, which occurs in the redshift range . Using the EZGAL software111http://www.baryons.org/ezgal/ (Mancone & Gonzalez, 2012) with the stellar population synthesis models of Bruzual & Charlot (2003), we compute the colors of stellar population as a function of age, assuming three families of star formation histories: 1) instantaneous burst; 2) constant star formation histories (CSF); and 3) exponentially declining model (EXP models hereafter: ) with values of 0.1 Gyr and 0.5 Gyr. As illustrated in the left panel of Figure 4, a stellar population formed via a single instantaneous burst would meet this condition at age 250 Myr, while galaxies formed through a more extended star formation episode (=100 Myr) would take 400 Myr to attain the same strength.
The second criterion requires that the continuum slope at =7000–9000Å is relatively flat, ensuring that the red color is not due to dust reddening. In the middle panel of Figure 4, we illustrate the effect of interstellar dust assuming the reddening parameters E()=0, 0.5, 1.0 and the Calzetti et al. (2000) extinction law.
Using the above criteria, 56 galaxies are identified. Thirteen of them have power-law-like SEDs in the mid-infrared with typical brightness of AB in the 5.8m or 8.0m bands; the colors range in , on the low end of the color distribution. Four of them are also present in the Spitzer MIPS m source catalog provided by Vaccari (2015). These sources are likely heavily dust-obscured AGN which scatter into our selection. Of the thirteen galaxies, 7 (54%) and 8 (62%) of them meet the IRAC color criteria for high-redshift AGN selection proposed by Stern et al. (2005) and Donley et al. (2012), respectively. We remove all thirteen galaxies from our sample.
The final sample consists of 43 galaxies, which we refer to as Balmer break galaxy candidates (BBGs) hereafter. Seven galaxies are also our photo- protocluster candidates. In the right-most panel of Figure 4, we show the and colors of all -band detected sources with reliable color measurements. The BBGs without (with) the photo- estimate are shown in red (green), while the distribution of the remainder is indicated as greyscale and contours where the contour lines enclose the 68% and 95% of all galaxies.
Most BBGs are very faint at observed optical wavelengths (i.e., faint at rest-frame UV wavelengths). Of the 43 galaxies, only seven (16%) are detected at the level ( AB) in the -band while dropping out of the band. The three brightest galaxies (in the -band) formally meet the LBG color criteria. The remaining four likely have similar SED shapes to their -brighter counterparts but are simply too faint to place strong enough constraints on the colors. All seven have photo- probability distributions with a single peak at . The remaining 36 galaxies (84%) are formally undetected in the band with a few detected at a lower significance.
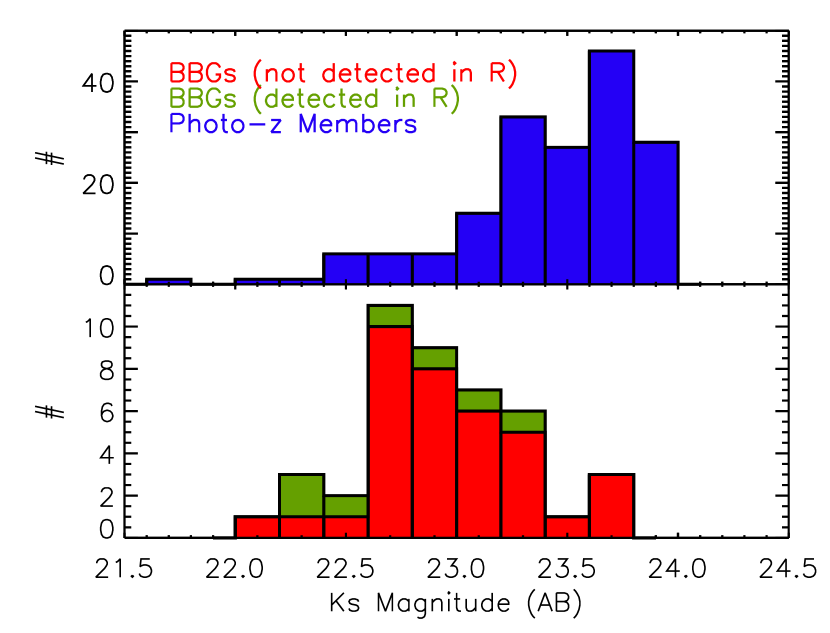
In the band, the BBGs have a mean AB (median 22.92), significantly brighter than the photo- members, which have (median 23.50). In Figure 5, we show the band distribution of the photo- (solid grey) and BBG candidates (hatched) where the BBGs are further split based on optical detection (labelled as ‘UV-faint’ and ‘UV-bright’). The disparity between their band brightness is driven by a selection effect: the IRAC color cut applied to the latter requires that they have to be bright enough in both IRAC 3.6m and 4.5m bands.
We construct the median SED for each BBG subsample by creating median image stacks and measuring aperture photometry (see Lee et al., 2011, for the full description of the stacking procedure). The CIGALE software is run in the same manner as done for individual galaxies. The SED fitting results are summarized in Table 1. We find that optically faint BBGs are well fit by old stellar populations with little to no star formation, while the remaining seven galaxies are best-fit as young post-starburst systems. We refer to the two groups as ‘quiescent’ and ‘post-starburst’ BBGs, respectively. In the next two subsections, we discuss each category in further detail.
| Quiescent | Post starburst | |||
|---|---|---|---|---|
| exp. decl. | two populations | exp. decl. | CSF | |
| SFH | ||||
| + | ||||
| SFR ( yr-1) | ||||
| Age (Myr) | ||||
| E() | ||||
| (Myr) | 50 | 100, 300 | 500 | |
| - | - | - | ||
| 6.39 | 5.22 | 5.29 | 5.38 |
3.2. Quiescent Galaxy Candidates
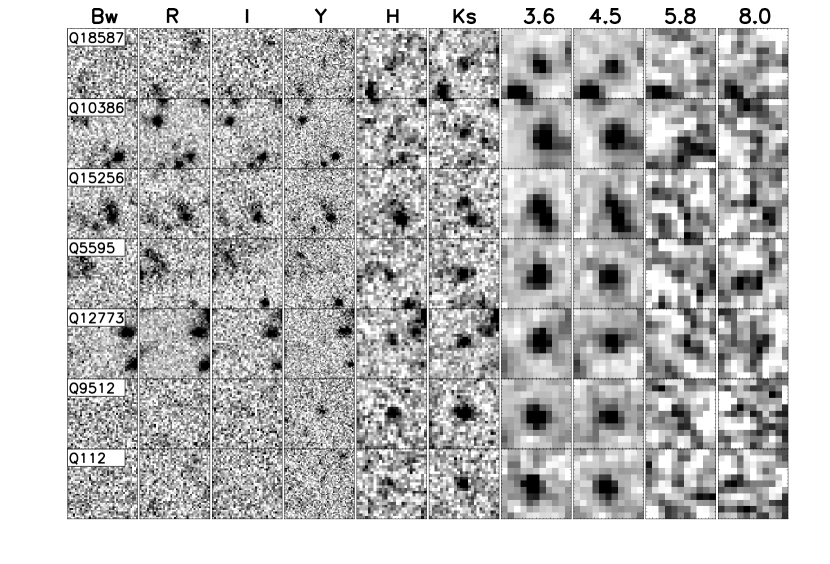
In Figure 6, we show sample postage stamp images of the quiescent BBGs. Most of the quiescent BBG candidates are detected only in 3 or 4 bands; the limited dynamic range in the wavelength coverage and shallow depths in the IRAC 5.8m and 8.0m bands result in poorly constrained photometric redshift estimates. While we return to the issue of redshift degeneracy later in this section, we fix the redshift of all quiescent BBGs to in deriving their physical parameters, which is motivated by the redshift of the protocluster in the field. Changing the redshift by would result a 5% change in mass.
Twelve BBGs show an excess flux in the 5.8m and 8.0m bands suggesting possible contamination by warm dust emission, possibly arising from hidden starburst or AGN. When we exclude the 5.8-8.0m data from the SED fitting and refit their masses, the change in stellar mass is minimal (6%). This is consistent with the expectation based on infrared SEDs of high-redshift starburst/AGN systems that the flux contribution by AGN at m is not significant (e.g., Sajina et al., 2012; Kirkpatrick et al., 2015). The median value of the individual stellar mass measurements is =11.30 (=0.29), consistent with that obtained from the stacked photometry (Table 1). The four most massive galaxies lie in the range =11.7–11.9 (see Fig 3); if confirmed, their masses already rival some of the brightest cluster galaxies in the local universe.
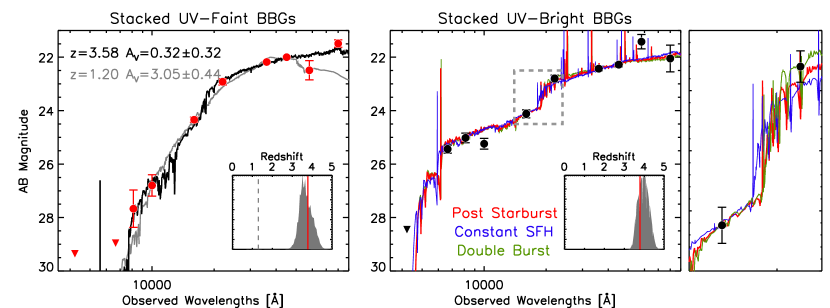
The stacked SED of the UV-faint BBGs is consistent with an old (980 Myr) and very massive () galaxy with little star formation. When combined with the best-fit photometric redshift at , the formation redshift is at . While similarly massive and old galaxies have been reported in the literature (Marchesini et al., 2010; Nayyeri et al., 2014; Glazebrook et al., 2017), the presence of such massive galaxies in large number may pose a considerable challenge to the hierarchical theory of galaxy formation.
The redshift PDF of the stacked SED (Figure 7, left inset) is singly peaked at strongly ruling out a lower-redshift () solution. This gives us confidence that our quiescent galaxy sample is not dominated by heavily obscured lower-redshift sources. However, the photo- constraints on individual galaxies are more ambiguous (Figure 3). Only eleven of the thirty six galaxies have a singly peaked PDF at ; the remainder shows a rather flat -distribution or has two peaks. For the latter, the low-redshift solution typically lies at and the high- solution lies at .
The color degeneracy between an old quiescent galaxy at high redshift and a very dusty galaxy at lower redshift is well known. Dunlop et al. (2007) reanalyzed the photometric data of a putative massive and quiescent galaxy at named HUDF-JD2 (Mobasher et al., 2005), and showed that a very dusty () galaxy at is equally likely. The galaxy was later detected in the 16 m and 22 m bands lending further credence to the lower-z solution (: Chary et al., 2007). Similarly, Marchesini et al. (2010) selected a sample of massive galaxies at using the photometric redshift technique, and noted that nearly a half are equally well fit by very old and very dusty () galaxies at , if such models are included in the spectral template set.
In the redshift range to which our BBG selection is sensitive, the strongest constraint comes from the IRAC 5.8m and 8.0m photometry. For galaxies at , these bands sample beyond the 1.65m stellar bump which arises from the declining H- ion opacity in the stellar atmosphere (see, e.g., Sawicki, 2002). Indeed, when we repeat the SED fitting procedure while limiting the redshift range to , the best-fit solution is an old and heavily reddened galaxy at (, Gyr) which is shown in Figure 7 (left). Given the similarity of the rest-frame UV and optical colors of the two model fits, it is evident that flux measurements in the 5.8m and 8.0m band are important in breaking the redshift degeneracy.
Indeed, all of the BBGs with the 8.0m detection have singly peaked redshift PDFs. In the image stack of the remaining 25 galaxies, we do not obtain a clear detection, and as a result, the redshift PDF is doubly peaked confirming our expectation. However, the non-detection is not surprising considering the sensitivity of the SDWFS data (5 limit for a point source is 20.25 mag). If we assume Poisson noise (i.e., the most optimistic case), stacking 25 sources would result in the limiting magnitude of 22.0, which is very close to the measured 8.0m flux from the full stack (see Fig. 7). Thus, the non-detection does not rule out the possibility that these 25 galaxies have similar SEDs to the 8.0m-brighter counterparts but with slightly lower fluxes.
As a final check, we repeat our image stacking, photometry, and SED fitting procedure for 200 times while each time randomly excluding 7 BBGs (20% of the sample). We integrate the redshift PDF above to obtain the formal probability for the high-redshift solution. In 73% of the time, the photometric redshift solution prefers the high-z solution (). We conclude that the redshift ambiguity of the BBGs is mainly driven by the existing depth at the 8.0m band and that deeper data will be necessary to place more stringent constraints on their redshift distribution.
Finally, we note that several studies reported a significant fraction of MIPS 24m detections among massive quiescent galaxies (Mancini et al., 2009; Marchesini et al., 2010; Nayyeri et al., 2014; Marsan et al., 2015). At =3.0–4.5, the 24 m samples 4–6 m, where warm-hot dust continua or polycyclic aromatic hydrocarbons excited by star formation or AGN activity could contribute significantly to the flux. Exploration of such possibilities offers a promising avenue to learn about how the ‘red-and-dead’ galaxies form and what roles AGN activity and nuclear starburst plays in the process. We notice the submillimeter (ALMA+SCUBA2) detection a fraction of an arcsecond away from a confirmed post-starburst galaxy has been reported recently (Glazebrook et al., 2017). However, given the shallow MIPS coverage in the Boötes field (5 detection limit is 250Jy), we are unable to quantify what fraction of our BBG candidates may harbor hidden AGN or starbursts.
3.3. UV-bright Balmer Break Galaxy Candidates: Post-starburst or normal star-forming galaxy?
The relatively strong Lyman break present in the seven optically bright BBGs places their redshift in the range =3.6–4.0, giving us confidence that the and bands straddle the Balmer/4000Å break. The overall chi-square distribution obtained from our SED fitting procedure suggests that either delayed or exponentially declining SFH models with relatively short values (100–300 Myr) are preferred over constant SFH models, where the latter typically returns larger values. The median fit value are =11.0 (=0.2) in stellar mass, 145 in SFR, and 433 Myr (23 Myr) in population age. In comparison, the CSF model returns higher values of SFR 205 but similar stellar masses and ages. These values are also consistent with the stacking results shown in Table 1.
In Figure 7 (right), we show the stacked photometry together with the best-fit SEDs assuming CSF (blue) and exponentially declining (red) models. The overall SED shapes are very similar in the entire range of the rest-frame UV-to-IR wavelengths with the exception of the band sampling the rest-frame 4500Å. A zoom-in on the wavelength range near the Balmer/4000Å break is shown in the far right panel.
We also consider a scenario in which the galaxies are composed of two stellar populations formed at different times where the old population dominates the rest-frame optical emission while the UV emission originates from newly formed stars (e.g., Kriek et al., 2009). We explore a range of ‘double burst’ models as follows: the SFHs of both populations are modeled as exponentially declining functions with values ranging in Myr. The ages of the two populations are also allowed to vary. The fraction of stellar mass formed in the second burst relative to the old population, , is varied from 0.01 to 0.50. The minimum is achieved at where a 200 Myr-old new burst is currently forming stars at rates of 114 (green line in Fig 7, right panel). The values are similar out to , but increase more rapidly at ( and 0.9 at and 0.3, respectively). Thus, we conclude that the mass formed during the recent SF episode is small (10%) compared to that of the evolved stellar population. The stellar population parameters obtained for all three different star formation histories are listed in Table 1.
Finally, we consider the possibility that the seven optically bright candidates are normal star-forming galaxies misclassified as BBGs due to the contamination of the band flux by strong nebular emission such as [O iii] and H (Shim et al., 2011; Stark et al., 2013; Schenker et al., 2013). Of particular interest to the present sample is the [O iii] doublet, which falls into the band at . For all but two, the redshift PDF peaks at even though the majority has a non-zero probability of lying in the range . For the remaining two, the peak of the PDF is . Schenker et al. (2013) measured the rest-frame [O iii] equivalent widths (EWs), and determined the median value of 280Å (see also, Holden et al., 2016). At , it would lead to a substantial overestimation of the band continuum flux by 0.37 mag.
However, Malkan et al. (2017) recently noted that a strong anti-correlation exists between [O iii] EW and stellar mass such that the EW could be as low as 80Å in galaxies. The median stellar mass of our UV-bright BBGs is nearly an order of magnitude larger than this value. Similarly, only two galaxies in the Schenker et al. sample have UV brightness similar to our sample222The magnitudes of the Schenker et al. galaxies are 24.4 and 25.3 AB; the magnitude range of our UV-bright BBGs is and AB. whose EWs are 100Å and 150Å corresponding to a much less severe contamination of of 0.15 and 0.21 mag, respectively. The trend of decreasing EWs with increasing mass and UV luminosity is likely the same, given the relatively tight correlation between the two quantities among star-forming populations (e.g., Stark et al., 2009; Lee et al., 2012; Salmon et al., 2015).
We measure the mean [3.6][4.5] color to be ; Stark et al. (2013) reported that the median [3.6][4.5] color is mag for galaxies, significantly bluer than the mag color measured in their sample for the systems at . The color difference is attributed to the presence of strong H emission in the former. The lack of excess 3.6m band flux corroborates the possibility that nebular line contamination is not significant.
Given the color degeneracies between the above possibilities, discriminating a young post-starburst from a rejuvenated old galaxy will be harder, requiring detection of their respective spectroscopic signatures; these will include Balmer absorption lines for post-starburst galaxies (e.g., Kriek et al., 2009; Glazebrook et al., 2017) and nebular lines such as [O ii], [O iii], H, and H, from the H ii regions. Future James Webb Space Telescope spectroscopy will help resolve this issue unambiguously (Kalirai, 2018).
Regardless of their nature, we have uncovered a rare population of ultra-massive galaxies () which may have recently halted their star formation, or are nearing the end of their star-formation activity.
A summary of all the 43 BBG candidates is given in Table 2.
4. A Massive Galaxy Overdensity?
4.1. Sky Distribution of Protocluster Candidates
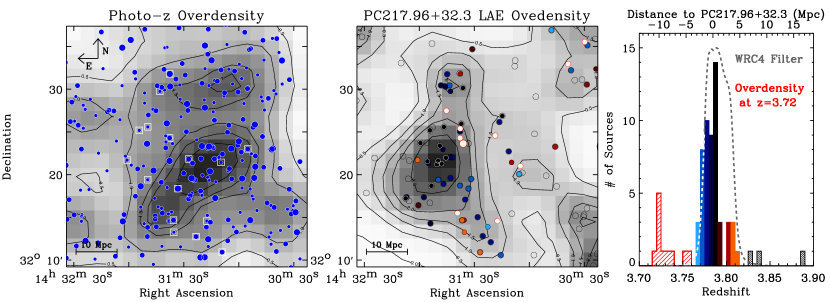
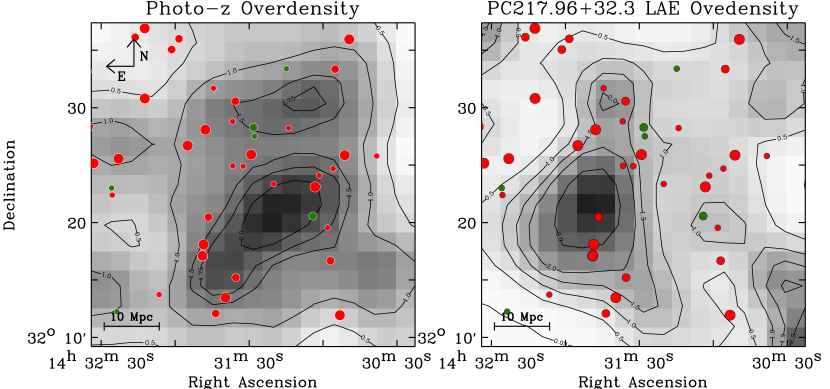
We show the sky distribution of the photo- protocluster candidates in the left panel of Figure 8; the surface density enhancement relative to the mean density is shown as both greyscale and contour lines. The true density enhancement is expected to be higher as the mean density computed from the entire field includes the galaxies in the overdense region. There is a clear indication of a large overdensity slightly south of the field center, outlined by the and lines. A smaller less significant one is found north of the field center.
In the same figure, the sky distribution of known members of PC217.96+32.3 is shown in the middle panel; spectroscopic sources (which include both LAEs and LBGs) are color-coded by redshift. The density contour of the protocluster is constructed as before, but only using the LAE positions. Because our spectroscopic efforts were heavily focused on the LAE overdensity region, including the non-LAE members in the density calculation would artificially increase the overdensity.
Comparing the density maps of the photo- and of protocluster LAEs, it is evident that they are not co-spatial. We perform a two-dimensional Kolmogorov-Smirnov (K-S) test (Peacock, 1983; Fasano & Franceschini, 1987) to compare the the photo- distribution with the LAE distribution, and find the -value of . Thus, it is extremely unlikely that they are drawn from the same parent distribution at random. The 2D K-S test has also been used in Kuiper et al. (2012) to compare between different structures.
The largest photo- overdensity runs in the NW-SE direction. While it partially overlaps with the southern end of PC217.96+32.3, it stretches further west to the region devoid of the LAEs. A smaller and less significant overdensity lies just north of the main overdensity, which also overlaps slightly with a small LAE group north of the main LAE overdensity. The larger overdensity is also closer to PC217.96+32.3, and thus most likely to have a physical connection to the confirmed protocluster. Being separated from each other, the physical association of the two photo- overdensities is unclear. Thus, we focus on the larger overdensity in this work.
The shapes and locations of the photo- and LAE surface overdensities are suggestive of a possible physical connection. One hypothesis is that they are part of a single structure where the photo- overdensity lies in the foreground of the LAEs (i.e., at ), and as a result any Ly emission from galaxies in this region is missed by the LAE selection filter. In the right panel of Figure 8, we show the narrow-band filter bandpass converted to the redshift selection function (dashed line) together with the distribution of all spectroscopic sources in the range of . Most of the known members residing in the LAE overdensity lie at , i.e., the blue half of the filter response. The southern end of PC217.96+32.3 is composed of galaxies in the redshift range where the filter response falls off steeply. Existing spectroscopy reveals that three LAEs there have the line centroids outside the narrow-band filter, but are selected as LAEs because of their high line luminosities and broad line widths. The high concentration of LAEs where the two overdensities overlap provides a circumstantial evidence that the LAEs only partially trace the true extent of a single very large structure.
Another possibility is that the photo- overdensity is located further in the foreground of PC217.96+32.3 near an LBG overdensity at . Of the ten galaxies at within our NEWFIRM coverage, three reside within the region, and additional five lie just outside the contour line. The significance of this spectroscopic overdensity is difficult to assess given the limited extent and depth of the existing spectroscopy. All confirmed LBGs – including the eight galaxies at – either have relatively strong Ly emission or high UV continuum luminosities. Further lending support to this possibility is G6025 (large white circle in Figure 8), one of the eight galaxies that is unusually large (end-to-end length of 20 kpc: Lee et al., 2018). The ground-based morphology and large angular size are consistent with two UV-luminous galaxies involved in a major merger, a type of event that should occur more frequently in a dense environment.
Finally, the photo- overdensity may represent a protocluster with no physical connection to PC217.96+32.3. The stacked redshift probability density function of protocluster candidates peaks at , but its width is not narrow enough to rule out the possibility that the true peak may be away from the peak value, which would place the structure at Mpc away from PC217.96+32.3.
Multiple protoclusters in close proximity are unlikely, but not impossible. Kuiper et al. (2012) noted that there may be two separate galaxy overdensities near MRC 0317-257, a radio galaxy at z=3.13. Similarly, a string of galaxy overdensities in the COSMOS field was found spanning over a line-of-sight distance of Mpc (, 2.44, 2.47, and 2.51 reported by Diener et al., 2015; Chiang et al., 2015; Casey, 2016; Wang et al., 2016, respectively). With the limited spectroscopy, their physical connection remains unclear. Two additional LAE overdensities of smaller magnitudes exist just outside our NEWFIRM field north of PC217.96+32.3 (Lee et al., 2014), one of which was confirmed to be a galaxy overdensity (Dey et al., 2016a). In § 5.5, we return to this topic and evaluate the likelihood of multiple protoclusters in our survey volume.
4.2. Sky Distribution of Balmer Break Galaxy Candidates
Several previous studies have reported a high concentration of galaxies dominated by old stellar populations near known massive protoclusters (Steidel et al., 2005; Kubo et al., 2013, 2015; Wang et al., 2016). While those galaxies still await spectroscopic confirmation, such information would have important implications to the formation histories of massive cluster ellipticals. In this context, we investigate whether our BBGs are physically associated with the structure revealed by the photo- overdensity.
In Figure 9 we show the locations of the 43 BBG candidates overlaid on the photo- (left) and LAE (right) density maps. The BBGs seem to avoid the most overdense regions of both the LAEs and photo- candidates. Only one quiescent galaxy candidate lies near the LAE core, and two additional sources are near the line. Only three BBG candidates locate near the contour line. The relative void of all types of galaxies potentially associated with the structure in the southern corner and northern end of the field is also noteworthy. The fact that the same regions are well populated with lower-redshift sources perhaps suggests that the void is not artificially created by the presence of bright sources such as saturated stars or large galaxies.
We perform a 2D K-S test using the BBG and LAE distributions, and find the -value of , indicating the significant disparity between the spatial distributions of the two samples. The same test using the BBG and photo- distributions result in the value of . The K-S test evaluates the similarity of two univariate samples by constructing their cumulative distributions and computing their maximum distance. Because multivariate samples can be ordered in more than one way, multi-dimensional K-S tests lack the statistical rigor of the 1D test, and thus need to be understood in the context of carefully controlled tests. To this end, we populate the survey field with two a priori known distributions and perform the 2D K-S test to quantify the range of the values. For each test, we create 1,000 separate realizations.
First, we create two random distributions, each matching the number of BBGs and photo- sources. We obtain the mean (median) value of 0.30 (0.27) with the standard deviation () of 0.21. Second, we compare the photo- sample with a randomly chosen subset of itself consisting of 43 sources (matching the number of BBGs), which result in the value of 0.37 (0.36; ). These tests suggests that we can reliably rule out the possibility that the LAEs and BBGs – having – are drawn from the same parent distribution.
The relationship between the BBGs and photo-z candidates, however, is less clear with . Comparison of the photo- distribution with 43 randomly distributed sources yields the value of 0.11 (0.07, ), comfortably bracketing the measured value. Thus, we cannot statistically rule out the possibility that the BBG positions are not correlated with those of photo- members. Spectroscopic redshifts are necessary for progress.
4.3. Estimate of true overdensity and descendant mass
We assess the significance of the structure by estimating the range of the true galaxy overdensity given the observed level of the surface density enhancement. The transverse size of the photo- overdensity is computed by interpolating the 1.5 iso-density contour, which yields 139 arcmin2 or 26.4 Mpc2 (physical) at . Since physical scale remains constant within 2% at , our subsequent estimate of the overdensity and masses should be relatively insensitive to the precise redshift of the structure. We assume that the line-of-sight distance from the front to back of the structure is 15 Mpc; this is motivated by the fact that the effective diameter of the progenitors of massive present-day clusters lies in this range (Chiang et al., 2013). The redshift distribution of the known members of PC217.96+32.3 ranges over is consistent with this expectation (see the right panel of Figure 8).
We infer the range of the intrinsic galaxy overdensity by performing Monte Carlo simulations as follows. In each run, we create a mock field containing one protocluster with a galaxy overdensity in the middle by populating points randomly in the space. The “protocluster region” is defined as a rectangle. The overall number of sources and the transverse area of the protocluster match those of the data. An intrinsic galaxy overdensity, , is chosen at random in the range . We divide the redshift range into 40 bins with a binsize of , corresponding to the stepsize of 15 Mpc in comoving line-of-sight distance. Taking as intrinsic overdensity, the number of true members is where is the total number of observed protocluster candidates in the field, and populate them at random within the protocluster region. Setting (5) means that 58 (35) galaxies are part of the structure. The remainder () are assigned randomly assuming a uniform distribution in both transverse and line-of-sight positions. We construct the surface density map of the mock image using the identical procedure as described previously, and estimate the mean surface density enhancement within the protocluster region.
We repeat the above procedure 10,000 times and obtain the empirical relation between the true overdensity and surface overdensity. The scaling relation is well-behaved and nearly linear. Given the observed surface overdensity (the mean enhancement is 1.81 within the 1.5 iso-density contour), we estimate that the intrinsic overdensity of the structure is with the median value of 7.8. The value is comparable to the redshift overdensities found for several known protoclusters. Steidel et al. (2005) measured a redshift overdensity of for a structure. Based on the VIMOS Ultra Deep Survey (Le Fèvre et al., 2015), Lemaux et al. (2014) and Cucciati et al. (2014) reported the inferred redshift overdensity of and for a protocluster at and , respectively. These values are larger than that determined for the SSA22 protocluster at , (Steidel et al., 1998, 2000; Hayashino et al., 2004; Matsuda et al., 2005; Yamada et al., 2012; Topping et al., 2018).
To investigate how sensitive the inferred value is to the transverse area of the surface overdensity, we rerun the simulations using the iso-density of 1.3 and 1.6; lowering the density contrast effectively increases the effective area, while raising it has the opposite effect. We find that the estimate of the underlying overdensity is relatively insensitive to a specific choice of density contrast used to estimate the extent of the structure. However, our test does not include the possibility that the surface overdensity is systematically overestimated either due to Poisson shot noise or a superposition of another unrelated group of galaxies. Given the lack of spectroscopy in the region, we currently have no way of quantifying this possibility. If the surface overdensity region is reduced by 20%, the value would decrease to 3.9–7.0.
Based on the inferred galaxy overdensity , we estimate the descendant mass of the underlying structure, i.e., the total mass enclosed within the overdense region which will be gravitationally bound and virialized by , which can be expressed as:
where is the average matter density of the universe (), is the matter overdensity, and is the comoving volume of the galaxy overdensity. With the adopted cosmology, Equation 4.3 is equivalent to . The two overdensity parameters, and , are related through the equation where denotes a factor correcting for the effect of redshift-space distortions (Steidel et al., 1998), and is galaxy bias. Given the lack of details to assume otherwise, we use the in the case of spherical collapse: . As for galaxy bias, we adopt . Our choice is justified by the fact that the majority of our photo- sources lie in the observed UV luminosity range comparable to those of LBGs at . The bias value of the latter has been estimated through measurements of their clustering properties (e.g., Ouchi et al., 2004; Lee et al., 2006; Hildebrandt et al., 2009). We solve the above equations for and use Equation (1) to obtain the mass estimate.
The enclosed mass in the photo- structure is given the overdensity of . The inferred dark matter overdensity is . Increasing the bias value to would decrease the mass by 10%.
5. Discussion
5.1. The prevalence of massive quiescent galaxies in protocluster environment
We evaluate how the number of massive quiescent galaxies () in our field compares with that expected in an average field. Based on -selected galaxies in the 1.6 deg2 COSMOS/UltraVISTA field, Muzzin et al. (2013) estimated that at , the cumulative number density of galaxies with is Mpc-3. In our survey field (28′35′), one expects to find BBG-selected quiescent galaxies. Similarly, Spitler et al. (2014) identified 6 quiescent galaxies above in the ZFOURGE survey corresponding to the surface density of arcmin-2, such that quiescent galaxies are expected in our field. We assume in the above calculations that the selection function takes the form of a top hat filter in the range where the color samples the Balmer/4000Å break. The relative change of angular diameter distance in this range is 6%, and should result in 12% in the expected number depending on the redshift distribution of BBGs.
Taking the Muzzin et al. (2013) measurement as the field average, the implied overdensity of massive quiescent galaxies is ! Excluding all of our post-starburst BBG candidates (assuming all are strong [O iii] emitters at ), the remaining BBGs correspond to . Using the Spitler et al. (2014) estimates, the overdensity is (9) with (without) the potential [O iii] emitters.
We also compare the observed abundance of quiescent galaxies with that measured in the SSA22 protocluster at . Kubo et al. (2013) used color criteria tuned to (, , and ), and identified 11 massive galaxies () concentrated near the overdensities of other types of galaxies with the surface density of arcmin-2. In comparison, the overall surface density of BBGs in our field is arcmin-2. Within a smaller rectangular region (15′16′) in which the surface density of photo- sources is enhanced by 50% (Figure 9, left), we find 21 quiescent BBGs there in, corresponding to the surface density of arcmin-2. All errors are given assuming Poisson shot noise. Considering the change of angular diameter distance, the surface density per unit comoving transverse area is Mpc-2 and Mpc-2 for the SSA22 and the present structure, respectively. Similarly, Lemaux et al. (2014) estimated that the implied overdensity of massive () red galaxies in a protocluster is .
A large population of massive quiescent galaxies found in our field implies that the formation of cluster galaxies occurred in shorter timescales and at earlier times than the field galaxies. Our results confirm an early onset of cluster red sequence (e.g., Kodama et al., 2007; Lemaux et al., 2014). This is in a broad agreement with star formation histories of present-day cluster ellipticals inferred from absorption line studies (Thomas et al., 2005). Little to no evolution of the cluster red sequence out to further strengthens this expectation (e.g., Blakeslee et al., 2003; Mei et al., 2006).
The sky distribution of BBGs appears to trace the full extent of the large scale structure rather than being concentrated in the highest density environments. Few are found in either LAE or photo- overdensity peaks (see §4.2). We speculate that BBGs may be the central (and most massive) inhabitants of the massive halos that are in the process of merging. The implication is that they were quenched long before the final coalescence of the structure which occurred much later. Therefore, the quenching of massive cluster ellipticals is caused by the early onset of the ‘mass quenching’ rather than by any environmental effect suppressing their formation (Peng et al., 2010). This is in line with a study of intermediate-redshift galaxy clusters by Brodwin et al. (2013), who found that the level of star formation in cluster environment declines below that in the average field only at (also see, Tran et al., 2010). Recent discoveries of compact galaxy groups in protocluster environments support this view, as a fraction of quiescent galaxies in such a group is observed to be low (e.g., Wang et al., 2016; Kubo et al., 2016).
5.2. Diverse types of galaxies tracing a massive protocluster
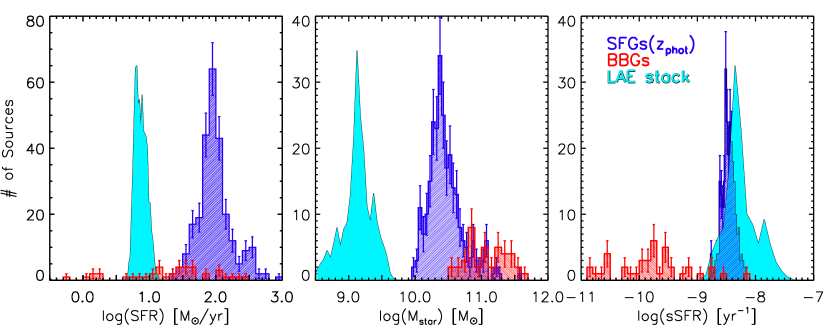
In this work, we have identified protocluster member candidates by employing two selection methods, namely photo- selected star-forming galaxies and Balmer break galaxies. When combined with a population of LAEs in the same field (Lee et al., 2014; Dey et al., 2016a), these samples showcase diverse types of inhabitants residing in a very overdense cosmic structure.
In Figure 10, we show SFR, stellar mass, and sSFR values measured for our sample galaxies. The estimates for the photo- candidates are made on individual galaxies. As for the quiescent BBG candidates, we fix the redshift to for the SED fitting (see § 3.2 for discussion on redshift degeneracy); for the UV-bright BBGs with robust photo- estimates, we fix the redshift to the best-fit value.
As for the LAEs, while they have robust redshift estimates, they are too faint at infrared wavelengths to yield robust estimates of stellar population parameters on an individual basis. Instead, we perform image stacking on their positions, and measure the parameters based on the aperture photometry on the stacked images. A total of 150 LAEs are used for stacking analysis after removing those too close to nearby bright sources. To estimate the range of their physical parameters, we randomly draw a subset of the LAEs, and perform image stacking, aperture photometry, and SED fitting procedure. Their distributions of stellar population parameters shown in Figure 10 are based on 2,500 such realizations. Since median stacking is insensitive to significant outliers, the distribution of their physical parameters should be taken as a lower limit rather than the full range spanned by the LAEs.
The sample galaxies span a wide range of SFRs and stellar masses: the lack of overlap is at least in part driven by the selection effect. The lack of photo- candidates at is tied to the sensitivity of our band data. A 10 detection (=24.0) corresponds to the rest-frame optical luminosity of a galaxy with stellar mass , assuming an exponentially decaying star formation history with the value of 0.5 Gyr. The paucity of galaxies with is also driven by the same mass limit, given the correlation between SFR and . The large median mass of the BBGs is driven by the IRAC color selection as discussed in Sec 3.1. The steep decline in the number of galaxies at (e.g., Smit et al., 2012) is likely further helped by the photo- selection which is biased against redder (dustier) galaxies than typical LBGs. The intrinsic distribution of these parameters spanned by different types of galaxies remains uncertain: such information will require careful analyses of deeper multiwavelength data and the modeling of their respective selection biases, which are outside the scope of this paper.
The measured overdensities of different galaxy types highlight how they trace the same underlying large scale structure(s). Such measures are more robust against any selection biases mentioned previously as any such bias should apply equally to field and cluster galaxies, and thus should minimally impact their spatial distributions. The observed surface overdensity of photo- galaxies is , similar to that of the LAEs over the same general area. However, we show in § 4.3 that the spatial overdensity of the photo- galaxies is much larger, , than that of the LAEs. This is because the former is distributed over a much larger line-of-sight distance (i.e., larger ), and as a result, its surface overdensity is substantially diluted by the interlopers. It is also possible that the narrow band Ly filter ‘misses’ the core of the protocluster, and is only picking up the outer parts of the protocluster. In comparison, the surface overdensity of BBGs of the region is much higher at 9–16.
If all types of galaxies we consider here (LAEs, BBGs, and photo- candidates) trace the same underlying structure represented by a matter overdensity , the implication would be that more massive BBGs are far more biased tracers of the matter distribution than less massive star-forming galaxies. Our findings are consistent with the expectation from existing clustering studies, that more luminous/massive galaxies have larger biases (e.g. Giavalisco & Dickinson, 2001; Ouchi et al., 2004; Adelberger et al., 2005; Lee et al., 2006; Gawiser et al., 2007; Guaita et al., 2010; Kusakabe et al., 2018).
One corollary to the luminosity/mass-dependent bias is that, everything being equal, low-mass low-bias galaxies such as LAEs are the least biased (thus most reliable) tracers of the density distribution within the large-scale structure. Using LAEs to ‘map out’ the protocluster environment has additional advantages including the relative ease of redshift identification through the narrow-band selection technique and the abundance of low-luminosity galaxies implied by the steep faint-end slope of the UV luminosity function at this redshift range (e.g., Bouwens et al., 2007; Reddy & Steidel, 2009; Alavi et al., 2016; Malkan et al., 2017). Given the difficulties of obtaining spectroscopic redshifts for faint distant galaxies, LAEs offer the best practical means to survey the local environment of massive protoclusters, thereby allowing for studying the impact of local environment on its galaxy constituents (e.g., Kubo et al., 2013; Umehata et al., 2014; Kubo et al., 2016). While large numbers of protocluster candidates are being identified from wide-field deep surveys (e.g., Toshikawa et al., 2016, 2018), the lack of narrow-band observations targeting these structures will remain a main challenge in utilizing these structures to elucidate the physics in the main epoch of cluster formation.
5.3. Impact of local environment on stellar populations
The primary challenge in investigating the environmental effect on protocluster constituents is the lack of spectroscopic redshifts, which prevents unambiguous confirmation of cluster membership and inhibits a robust mapping of the density profile of the cluster. Because our selection methods target a relatively broad range of redshift, all galaxy samples are expected to contain and may be even dominated by interlopers not associated with the structure we wish to probe. These considerations testify to the clear need of spectroscopic information in making progress.
One possible way to discern any environment trend is to compare the galaxy statistic measured in a protocluster field with that obtained in a field without any strong density enhancements.. Provided that the environmental effects are strong and a substantial number of galaxies in the sample belong to the protocluster, a qualitative trend may be identified through this comparison (e.g., Cooke et al., 2014). However, a comparative study is only meaningful if the two datasets are well matched in depth, dynamic range, and wavelength coverage, which determine the precision with which photometric redshifts and stellar population parameters of the galaxies can be measured.
With these caveats in mind, we compare the properties of protocluster candidates with those of a control sample. The control sample is constructed from the COSMOS15 catalog (Laigle et al., 2016) where the sources whose best-fit photo- solution lies in the range are selected. After removing galaxies with multiple peaks in the photo- PDFs, the sample consists of 19,318 sources. We run the CIGALE software using the identical setup as previously, assuming constant SFHs for the both samples. While it is unrealistic to expect that all galaxies have constant SFHs, we are interested in the comparison of the two samples and not in exploring the full behavior of galaxies. A different SFH choice would generally shift measured quantities in the same direction for most galaxies, and thus would not change our conclusions. Finally, we note that the photo- precision for the COSMOS galaxies is expected to be much better () than for our sample () thanks to the better imaging depth and finer wavelength sampling in the optical/near-IR wavelengths. While the larger uncertainty can introduce a larger scatter in the overall distribution of a derived quantity, it will not impact our ability to discern any mean relation between two different quantities.
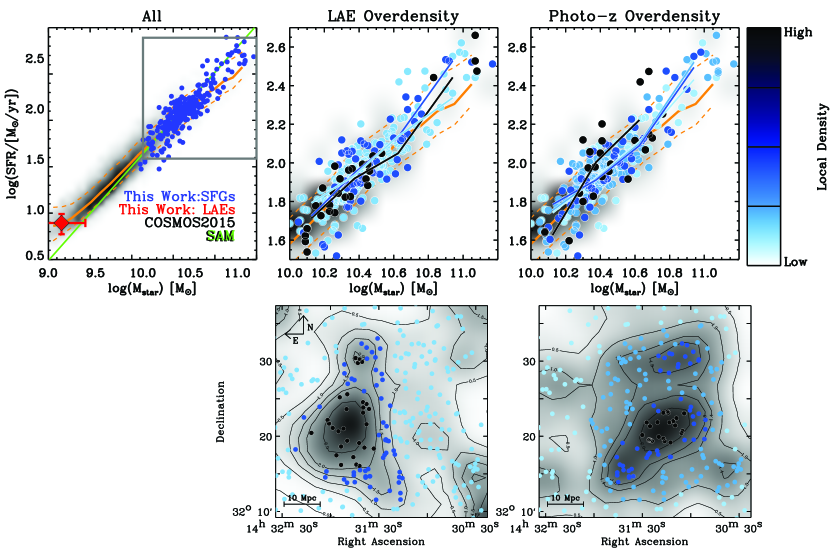
In the left panel of Figure 11, we show the locations of our photo- sources and of LAEs on the SFR- plane together with those of the control sample. A prediction from a semi-analytic model (Dutton et al., 2010) is also shown. Both our photo- candidates and LAEs occupy the same region as the field galaxies, suggesting that they obey the same star formation ‘main sequence’ scaling relation, consistent with existing studies (e.g., Koyama et al., 2014; Cucciati et al., 2014; Erfanianfar et al., 2016). From the same figure, it is evident that the COSMOS datasets can probe galaxies down to much lower masses than the present dataset. The mismatch of the sensitivities of the two datasets renders it challenging to compare how the number counts in bins of SFR or stellar mass differ in the these samples.
To investigate possible environmental trends, we divide the photo- sample into several environmental bins and color-code them accordingly where darker shades represent higher densities. Given the uncertainties in the extent and center of the structure, we define local environment using the LAE and photo- surface densities. The results are shown in top middle and right panels. The overall correlation – measured for each subsample in mass bins of – is shown in solid lines. The SFR- scaling laws measured from these subsamples are generally similar to that measured in the COSMOS sample.
We detect a hint of enhanced star formation activity in the highest photo- overdensity subsample. Four galaxies deviate from the field average by 0.3-0.4 dex (a factor of 2–3). The overall scaling relation in this bin has a slightly higher normalization (i.e., 0.1 dex higher SFR in a given stellar mass bin) although the scatter is substantial. Interestingly, the same bin also lacks massive galaxies above . The high-mass high-SFR end is well populated by galaxies residing in all environments. All in all, the environmental effects on star-forming galaxies appear to be minimal.
The lack of detectable environmental effects on the galaxy properties is puzzling. Uncertain cluster membership surely plays a role in diluting any existing trend by misplacing a subset of galaxies into a wrong density bin. However, should there be an excess of high-mass or high-SFR galaxies in dense environments, our analyses would have captured it as the regions most likely to be dense are counted as such in one or the other scenario. Hence, our analysis suggests that the environmental effect on star formation is likely a subtle one.
Alternatively, most of the enhanced star formation is perhaps obscured from our view by dust. Koyama et al. (2013) reported that while sSFRs are higher for galaxies in cluster environment than those in the field, the trend emerges only when the mid-infrared budget of the SFR is properly accounted for. They argued that their result may be explained if a higher fraction of nucleated dusty starbursts exist in cluster environments where dust properties are significantly different from normal star-forming galaxies, such that applying the same dust correction as the field galaxies would underestimate the true SFRs.
The lack of extreme star-formers in our sample (in both field and protocluster) is also in part a selection effect. Extremely dusty starbursting galaxies would not be included in our sample, as they would not have a strong enough spectral break for us to identify them robustly, or perhaps, are entirely invisible in the optical or infrared wavelengths. We therefore cannot test for the prevalence of dusty starburst systems in dense environments reported by several studies (Hung et al., 2016; Casey, 2016). Testing these hypothesis will require deeper infrared and submillimeter coverage of the field.
5.4. Search for Extreme Sources in the Protocluster Field
The presence of powerful radio galaxies has been used as a signpost of highly overdense regions (Venemans et al., 2005; Miley et al., 2006; Kajisawa et al., 2006; Venemans et al., 2007; Overzier et al., 2008; Hatch et al., 2011; Kuiper et al., 2012; Cooke et al., 2014; Rigby et al., 2014). Likewise, highly overdense structures appear to harbor powerful AGN observed as X-ray or submillimeter luminous sources, or giant Ly nebula (e.g., Steidel et al., 2000; Prescott et al., 2008; Lehmer et al., 2009; Hung et al., 2016; Casey et al., 2015; Casey, 2016).
Motivated by these findings, we search the existing radio and X-ray source catalogs to look for a sign of enhanced AGN activity. We cross-match the Chandra X-ray point-source catalog of the Boötes field (XBoötes: Kenter et al., 2005) with our photo-, BBG, and LAE positions, and find no match. The XBoötes survey sensitivity of the full band (0.5–8 keV) is ergs cm-2 s-1. Lehmer et al. (2009) studied X-ray detected sources in and around the SSA structure at , and found that the X-ray flux for the confirmed members range in ergs cm-2 s-1. Thus, non-detection merely suggests that even the brightest X-ray sources in SSA22 would lie below the XBoötes detection limit.
We also search for radio counterparts of our protocluster candidates (both photo- and BBG candidates) in the radio source catalog based on deep Low Frequency Array (LOFAR) 150 MHz observations (Tasse et al. in prep). The rms noise of of the data is 59 Jy/beam. Using the matching radius of 2″, no counterpart is found. We also compare our source positions against the photometric redshift catalog of the same LOFAR-detected sources constructed following the method presented in Duncan et al. (2018a, b), which covers roughly two thirds of our survey field and only half of the photo- overdensity region. This is because the bottom one third of our survey field lies outside of the NDWFS field (Jannuzi & Dey, 1999). Once again, no credible counterpart is identified. In addition, we cross-match our candidates with deep Westerbork Synthesis Radio Telescope (WSRT) 1.4-GHz catalog covering Boötes field (de Vries et al., 2002), and find no counterpart. Therefore, we can rule out the presence of any high-redshift radio source with the flux density 0.2 mJy in the probed redshift range.
Apart from the limited survey sensitivities, non-detection of powerful AGN in the protocluster member candidates is perhaps not surprising. As discussed previously, the majority of our photo- candidates, by design, resemble LBGs with a clean spectral break. This requirement effectively removes all galaxies that are either dusty starbursts or AGN with power-law-like SEDs similar to those identified by Hung et al. (2016) in the COSMOS field; robust identification of such galaxies will require improved sensitivities and wavelength baseline.
5.5. The plausibility of a very large structure
We assess how likely it is to find both structures or one very large structure in our survey volume. We utilize a catalog containing 2,731 simulated clusters identified from the Millennium I+II runs as described in Chiang et al. (2013). The minimum cluster mass is at . The comoving volume of the simulation is Mpc3 or 0.364 Gpc3. Our survey volume is estimated conservatively to be Mpc3 assuming a flat redshift distribution at over a 28′28′ area, which is 0.6% of the Millennium volume.
We randomly pick a region matching our survey volume, and record the number of clusters therein and the position and the mass of each cluster. The procedure is repeated 500,000 times. The median (mean) number of clusters is found to be 16.0 (16.5) with a standard deviation of 5.2; i.e., our survey volume is large enough to contain multiple clusters.
If the LAE and photo- overdensities are part of a single very large structure, its combined mass would be enormous. In Dey et al. (2016a), based on the level and extent of the LAE overdensity alone, we estimated that the enclosed mass is . As discussed in § 4.3, the photo- overdensity should contain a comparable mass. Given that the two overdensities only partially overlap (and the regions of the peak overdensities do not overlap), a conservative limit on its combined mass is in the range of . We find the probability of these scenarios to be 4.4% and 0.8%, respectively. In the entire Millennium volume, eight and one structures exist with masses above and respectively, corresponding to the comoving number density of Mpc-3 and Mpc-3, respectively. The most massive structure in the Millennium simulations has a total mass of . The observational counterpart of such an ultramassive cluster may be the El Gordo system, which is a merging pair of Coma-analogs at (Marriage et al., 2011).
To test the possibility that the two overdensities are unrelated structures, we search for the cases in which there are two Coma-like clusters (i.e., each with mass ). This occurs only 3.6% of the time. Finally, we assess how unlikely it is that the photo- overdensity lies at (see discussion in § 4), which would put the distance between the two at 47 Mpc or 10 proper Mpc. Only four distinct pairs of Coma analogs exist in the Millennium sample that are within 10 Mpc (physical) from each other. Two of those pairs have the physical separation of 5.2 Mpc and 5.3 Mpc from each other, and the other two at 9.3 Mpc and 9.8 Mpc. The separation for the latter is comparable to that between PC217.96+32.3 and the putative overdensity at (Lee et al., 2018). The likelihood of such a configuration falling into our survey is 0.8%. These considerations show that both scenarios are extremely unlikely to occur by chance, but also that it is not impossible.
The overall density of the regions in and around PC217.96+32.3 is remarkably high. Apart from the two overdensities we discuss here, two other LAE overdensities lie within Mpc (physical) north of of PC217.96+32.3 (Lee et al., 2014), one of which is spectroscopically confirmed and has the estimated descendant mass of (Dey et al., 2016a). Given the distances between these system, it is unlikely they will coalesce into a single structure within the Hubble time, but rather, will evolve separately and form structures similar to local superclusters (e.g., Einasto et al., 1997, 2014).
6. Summary
Utilizing the multi-wavelength dataset taken in the sightline of PC217.96+32.3, a spectroscopically confirmed protocluster at , we have detected continuum-faint LAEs (Lee et al., 2014; Dey et al., 2016a), UV-luminous star-forming galaxies, candidates of passive galaxies and of young post-starburst galaxies with a strong Balmer/4000Å break. Together, these constituent galaxies span 2–3 orders of magnitudes in both stellar masses and SFRs, highlighting diverse galaxy types residing in and around one of the largest structures discovered to date. Although we do not have spectroscopic redshifts for the new candidate protocluster members, the photometric redshift estimates suggest that they lie at or near the redshift of PC217.96+32.3. Based on our analyses, we conclude the following:
[1] A significant overdensity of massive star-forming galaxies is present in the field.
The extent of the newly identified photo- overdensity only partially overlaps with that of the previously known and spectroscopically confirmed members, which are mostly LAEs; the two are offset by 3–4 Mpc in the east-west direction.
While the origin of this separation is unclear, we speculate that the true extent of the structure may be larger than previously thought with a complex geometry only a part of which is traced by the LAE sample. This is presumably because the redshift of the main portion of the overdensity puts the Ly emission just outside the bandpass of the narrow-band filter used for the LAE selection. If the combined overdensity traces a single structure, a conservative estimate would place its total mass in the range of , making it a singularly large cosmic structure rarely seen in cosmological simulations. However, we cannot rule out that the galaxy distributions are produced by a chance projection of two unassociated protoclusters at , each of which will evolve into a Coma-like cluster by . The likelihoods of both scenarios are extremely low (%).
[2] We find a large excess ( 9–16) of ultramassive () galaxies exhibiting a strong Balmer/4000Å break. Their SEDs are consistent with those of passively evolving galaxies and of young post-starburst galaxies entering into quiescence. The sky distribution of BBGs appears to trace the full extent of the large scale structure rather than being concentrated in the highest density environments. We speculate that BBGs may represent the central and most massive inhabitants of the dark matter halos that are in the process of merging. Quenching of massive cluster ellipticals occurred in the epoch when the high-density environment did not adversely impact star formation activities therein, and long before these galaxies become part of a single coalesced structure. If confirmed, the presence of massive and quiescent galaxies as early as would push back the formation epoch of the cluster red sequence to beyond in the largest clusters such as Coma.
[3] Stellar population parameters measured for all member candidates span several orders of magnitude in the dynamic range of stellar masses, SFRs, and specific SFRs, showcasing the diverse constituents inhabiting the underlying large scale structure. We find that the protocluster galaxies obey the same SFR- scaling relation as the field galaxies. Our results suggest that the environmental effect on the stellar population properties of galaxy constituents is a subtle one at best.
Alternatively, the impact of local environment manifests itself in producing extremely dust starburst systems, which would entirely elude our selection of galaxy candidates.
[4] While all galaxy types (LAEs, LBGs, and BBGs) show significant overdensities in the region, the BBGs show the largest overdensity. If they trace the same underlying structure, our results would be consistent with the theoretical expectation that more massive galaxies are more biased tracers of the underlying matter. These results highlight the usefulness of using low-mass galaxies such as LAEs as the least biased visible tracers in quantifying the large-scale structures around massive protoclusters such as the one we have studied. Sensitive LAE surveys are therefore an efficient method to characterize large scale structure at high redshift, discover protoclusters, and as tracers of the physical processes responsible for cluster formation.
References
- Aaronson & Olszewski (1984) Aaronson, M., & Olszewski, E. W. 1984, Nature, 309, 414
- Adelberger et al. (2005) Adelberger, K. L., Steidel, C. C., Pettini, M., et al. 2005, ApJ, 619, 697
- Alavi et al. (2016) Alavi, A., Siana, B., Richard, J., et al. 2016, ApJ, 832, 56
- Ashby et al. (2009) Ashby, M. L. N., Stern, D., Brodwin, M., et al. 2009, ApJ, 701, 428
- Autry et al. (2003) Autry, R. G., Probst, R. G., Starr, B. M., et al. 2003, in Proc. SPIE, Vol. 4841, Instrument Design and Performance for Optical/Infrared Ground-based Telescopes, ed. M. Iye & A. F. M. Moorwood, 525–539
- Bertin (2011) Bertin, E. 2011, in Astronomical Society of the Pacific Conference Series, Vol. 442, Astronomical Data Analysis Software and Systems XX, ed. I. N. Evans, A. Accomazzi, D. J. Mink, & A. H. Rots, 435
- Bertin & Arnouts (1996) Bertin, E., & Arnouts, S. 1996, A&AS, 117, 393
- Blakeslee et al. (2003) Blakeslee, J. P., Franx, M., Postman, M., et al. 2003, ApJ, 596, L143
- Bolzonella et al. (2010) Bolzonella, M., Kovač, K., Pozzetti, L., et al. 2010, A&A, 524, A76
- Bosch et al. (2018) Bosch, J., Armstrong, R., Bickerton, S., et al. 2018, PASJ, 70, S5
- Bouwens et al. (2007) Bouwens, R. J., Illingworth, G. D., Franx, M., & Ford, H. 2007, ApJ, 670, 928
- Brammer & van Dokkum (2007) Brammer, G. B., & van Dokkum, P. G. 2007, ApJ, 654, L107
- Brodwin et al. (2013) Brodwin, M., Stanford, S. A., Gonzalez, A. H., et al. 2013, ApJ, 779, 138
- Bruzual & Charlot (2003) Bruzual, G., & Charlot, S. 2003, MNRAS, 344, 1000
- Bădescu et al. (2017) Bădescu, T., Yang, Y., Bertoldi, F., et al. 2017, ApJ, 845, 172
- Cai et al. (2017) Cai, Z., Fan, X., Yang, Y., et al. 2017, ApJ, 837, 71
- Cai et al. (2018) Cai, Z., Hamden, E., Matuszewski, M., et al. 2018, The Astrophysical Journal Letters, 861, L3
- Calzetti et al. (2000) Calzetti, D., Armus, L., Bohlin, R. C., et al. 2000, ApJ, 533, 682
- Capak et al. (2011) Capak, P. L., Riechers, D., Scoville, N. Z., et al. 2011, Nature, 470, 233
- Casey (2016) Casey, C. M. 2016, ApJ, 824, 36
- Casey et al. (2015) Casey, C. M., Cooray, A., Capak, P., et al. 2015, ApJ, 808, L33
- Chambers et al. (2016) Chambers, K. C., Magnier, E. A., Metcalfe, N., et al. 2016, ArXiv e-prints, arXiv:1612.05560
- Chary et al. (2007) Chary, R.-R., Teplitz, H. I., Dickinson, M. E., et al. 2007, ApJ, 665, 257
- Chiang et al. (2013) Chiang, Y.-K., Overzier, R., & Gebhardt, K. 2013, ApJ, 779, 127
- Chiang et al. (2017) Chiang, Y.-K., Overzier, R. A., Gebhardt, K., & Henriques, B. 2017, ApJ, 844, L23
- Chiang et al. (2015) Chiang, Y.-K., Overzier, R. A., Gebhardt, K., et al. 2015, ApJ, 808, 37
- Cooke et al. (2014) Cooke, E. A., Hatch, N. A., Muldrew, S. I., Rigby, E. E., & Kurk, J. D. 2014, MNRAS, 440, 3262
- Cucciati et al. (2014) Cucciati, O., Zamorani, G., Lemaux, B. C., et al. 2014, A&A, 570, A16
- Cucciati et al. (2018) Cucciati, O., Lemaux, B. C., Zamorani, G., et al. 2018, ArXiv e-prints, arXiv:1806.06073
- de Vries et al. (2002) de Vries, W. H., Morganti, R., Röttgering, H. J. A., et al. 2002, AJ, 123, 1784
- Dey et al. (2016a) Dey, A., Lee, K.-S., Reddy, N., et al. 2016a, ApJ, 823, 11
- Dey et al. (2005) Dey, A., Bian, C., Soifer, B. T., et al. 2005, ApJ, 629, 654
- Dey et al. (2016b) Dey, A., Rabinowitz, D., Karcher, A., et al. 2016b, in Proc. SPIE, Vol. 9908, Ground-based and Airborne Instrumentation for Astronomy VI, 99082C
- Diener et al. (2015) Diener, C., Lilly, S. J., Ledoux, C., et al. 2015, ApJ, 802, 31
- Donley et al. (2012) Donley, J. L., Koekemoer, A. M., Brusa, M., et al. 2012, ApJ, 748, 142
- Duncan et al. (2018a) Duncan, K. J., Jarvis, M. J., Brown, M. J. I., & Röttgering, H. J. A. 2018a, MNRAS, 477, 5177
- Duncan et al. (2018b) Duncan, K. J., Brown, M. J. I., Williams, W. L., et al. 2018b, MNRAS, 473, 2655
- Dunlop et al. (2007) Dunlop, J. S., Cirasuolo, M., & McLure, R. J. 2007, MNRAS, 376, 1054
- Dutton et al. (2010) Dutton, A. A., van den Bosch, F. C., & Dekel, A. 2010, MNRAS, 405, 1690
- Einasto et al. (1997) Einasto, J., Einasto, M., Gottloeber, S., et al. 1997, 385, 139
- Einasto et al. (2014) Einasto, M., Lietzen, H., Tempel, E., et al. 2014, A&A, 562, A87
- Eisenhardt et al. (2008) Eisenhardt, P. R. M., Brodwin, M., Gonzalez, A. H., et al. 2008, ApJ, 684, 905
- Erfanianfar et al. (2016) Erfanianfar, G., Popesso, P., Finoguenov, A., et al. 2016, MNRAS, 455, 2839
- Fasano & Franceschini (1987) Fasano, G., & Franceschini, A. 1987, MNRAS, 225, 155
- Franx et al. (2003) Franx, M., Labbé, I., Rudnick, G., et al. 2003, ApJ, 587, L79
- Fritz et al. (2014) Fritz, A., Scodeggio, M., Ilbert, O., et al. 2014, A&A, 563, A92
- Gawiser et al. (2007) Gawiser, E., Francke, H., Lai, K., et al. 2007, ApJ, 671, 278
- Giavalisco & Dickinson (2001) Giavalisco, M., & Dickinson, M. 2001, ApJ, 550, 177
- Glazebrook et al. (2017) Glazebrook, K., Schreiber, C., Labbé, I., et al. 2017, Nature, 544, 71
- Goto et al. (2017) Goto, T., Utsumi, Y., Kikuta, S., et al. 2017, MNRAS, 470, L117
- Guaita et al. (2010) Guaita, L., Gawiser, E., Padilla, N., et al. 2010, ApJ, 714, 255
- Hatch et al. (2011) Hatch, N. A., De Breuck, C., Galametz, A., et al. 2011, MNRAS, 410, 1537
- Hayashino et al. (2004) Hayashino, T., Matsuda, Y., Tamura, H., et al. 2004, AJ, 128, 2073
- Hildebrandt et al. (2009) Hildebrandt, H., Pielorz, J., Erben, T., et al. 2009, A&A, 498, 725
- Holden et al. (2016) Holden, B. P., Oesch, P. A., González, V. G., et al. 2016, ApJ, 820, 73
- Hopkins et al. (2008) Hopkins, P. F., Cox, T. J., Kereš, D., & Hernquist, L. 2008, ApJS, 175, 390
- Huang et al. (2011) Huang, J.-S., Zheng, X. Z., Rigopoulou, D., et al. 2011, ApJ, 742, L13
- Hung et al. (2016) Hung, C.-L., Casey, C. M., Chiang, Y.-K., et al. 2016, ApJ, 826, 130
- Jacoby et al. (1998) Jacoby, G. H., Liang, M., Vaughnn, D., Reed, R., & Armandroff, T. 1998, in Proc. SPIE, Vol. 3355, Optical Astronomical Instrumentation, ed. S. D’Odorico, 721–734
- Jannuzi & Dey (1999) Jannuzi, B. T., & Dey, A. 1999, in Astronomical Society of the Pacific Conference Series, Vol. 191, Photometric Redshifts and the Detection of High Redshift Galaxies, ed. R. Weymann, L. Storrie-Lombardi, M. Sawicki, & R. Brunner, 111
- Kajisawa et al. (2006) Kajisawa, M., Kodama, T., Tanaka, I., Yamada, T., & Bower, R. 2006, MNRAS, 371, 577
- Kalirai (2018) Kalirai, J. 2018, Contemporary Physics, 59, 251
- Kashikawa et al. (2007) Kashikawa, N., Kitayama, T., Doi, M., et al. 2007, ApJ, 663, 765
- Kato et al. (2016) Kato, Y., Matsuda, Y., Smail, I., et al. 2016, MNRAS, 460, 3861
- Kenter et al. (2005) Kenter, A., Murray, S. S., Forman, W. R., et al. 2005, ApJS, 161, 9
- Kirkpatrick et al. (2015) Kirkpatrick, A., Pope, A., Sajina, A., et al. 2015, ApJ, 814, 9
- Kodama et al. (2007) Kodama, T., Tanaka, I., Kajisawa, M., et al. 2007, MNRAS, 377, 1717
- Komatsu et al. (2011) Komatsu, E., Smith, K. M., Dunkley, J., et al. 2011, ApJS, 192, 18
- Koyama et al. (2014) Koyama, Y., Kodama, T., Tadaki, K.-i., et al. 2014, ApJ, 789, 18
- Koyama et al. (2013) —. 2013, MNRAS, 428, 1551
- Kriek et al. (2009) Kriek, M., van Dokkum, P. G., Labbé, I., et al. 2009, ApJ, 700, 221
- Kubo et al. (2015) Kubo, M., Yamada, T., Ichikawa, T., et al. 2015, ApJ, 799, 38
- Kubo et al. (2016) —. 2016, MNRAS, 455, 3333
- Kubo et al. (2013) Kubo, M., Uchimoto, Y. K., Yamada, T., et al. 2013, ApJ, 778, 170
- Kuiper et al. (2012) Kuiper, E., Venemans, B. P., Hatch, N. A., Miley, G. K., & Röttgering, H. J. A. 2012, Monthly Notices of the Royal Astronomical Society, 425, 801
- Kusakabe et al. (2018) Kusakabe, H., Shimasaku, K., Ouchi, M., et al. 2018, PASJ, 70, 4
- Labbé et al. (2005) Labbé, I., Huang, J., Franx, M., et al. 2005, ApJ, 624, L81
- Laidler et al. (2007) Laidler, V. G., Papovich, C., Grogin, N. A., et al. 2007, PASP, 119, 1325
- Laigle et al. (2016) Laigle, C., McCracken, H. J., Ilbert, O., et al. 2016, ApJS, 224, 24
- Le Fèvre et al. (2015) Le Fèvre, O., Tasca, L. A. M., Cassata, P., et al. 2015, A&A, 576, A79
- Lee et al. (2013) Lee, K.-S., Dey, A., Cooper, M. C., Reddy, N., & Jannuzi, B. T. 2013, ApJ, 771, 25
- Lee et al. (2014) Lee, K.-S., Dey, A., Hong, S., et al. 2014, ApJ, 796, 126
- Lee et al. (2006) Lee, K.-S., Giavalisco, M., Gnedin, O. Y., et al. 2006, ApJ, 642, 63
- Lee et al. (2011) Lee, K.-S., Dey, A., Reddy, N., et al. 2011, ApJ, 733, 99
- Lee et al. (2012) Lee, K.-S., Ferguson, H. C., Wiklind, T., et al. 2012, ApJ, 752, 66
- Lee et al. (2018) Lee, K.-S., Dey, A., Matheson, T., et al. 2018, ApJ, 862, 24
- Lehmer et al. (2009) Lehmer, B. D., Alexander, D. M., Chapman, S. C., et al. 2009, MNRAS, 400, 299
- Lemaux et al. (2014) Lemaux, B. C., Cucciati, O., Tasca, L. A. M., et al. 2014, A&A, 572, A41
- Lemaux et al. (2018) Lemaux, B. C., Le Fèvre, O., Cucciati, O., et al. 2018, A&A, 615, A77
- Malkan et al. (2017) Malkan, M. A., Cohen, D. P., Maruyama, M., et al. 2017, ApJ, 850, 5
- Mancini et al. (2009) Mancini, C., Matute, I., Cimatti, A., et al. 2009, A&A, 500, 705
- Mancone & Gonzalez (2012) Mancone, C. L., & Gonzalez, A. H. 2012, PASP, 124, 606
- Mancone et al. (2010) Mancone, C. L., Gonzalez, A. H., Brodwin, M., et al. 2010, ApJ, 720, 284
- Marchesini et al. (2010) Marchesini, D., Whitaker, K. E., Brammer, G., et al. 2010, ApJ, 725, 1277
- Marriage et al. (2011) Marriage, T. A., Acquaviva, V., Ade, P. A. R., et al. 2011, ApJ, 737, 61
- Marsan et al. (2015) Marsan, Z. C., Marchesini, D., Brammer, G. B., et al. 2015, ApJ, 801, 133
- Matsuda et al. (2004) Matsuda, Y., Yamada, T., Hayashino, T., et al. 2004, AJ, 128, 569
- Matsuda et al. (2005) —. 2005, ApJ, 634, L125
- Mawatari et al. (2016) Mawatari, K., Yamada, T., Fazio, G. G., Huang, J.-S., & Ashby, M. L. N. 2016, PASJ, 68, 46
- Mei et al. (2006) Mei, S., Holden, B. P., Blakeslee, J. P., et al. 2006, ApJ, 644, 759
- Merlin et al. (2015) Merlin, E., Fontana, A., Ferguson, H. C., et al. 2015, A&A, 582, A15
- Miley et al. (2006) Miley, G. K., Overzier, R. A., Zirm, A. W., et al. 2006, ApJ, 650, L29
- Miyazaki et al. (2018) Miyazaki, S., Komiyama, Y., Kawanomoto, S., et al. 2018, PASJ, 70, S1
- Mobasher et al. (2005) Mobasher, B., Dickinson, M., Ferguson, H. C., et al. 2005, ApJ, 635, 832
- Muldrew et al. (2015) Muldrew, S. I., Hatch, N. A., & Cooke, E. A. 2015, MNRAS, 452, 2528
- Muzzin et al. (2013) Muzzin, A., Marchesini, D., Stefanon, M., et al. 2013, ApJ, 777, 18
- Nayyeri et al. (2014) Nayyeri, H., Mobasher, B., Hemmati, S., et al. 2014, ApJ, 794, 68
- Noirot et al. (2018) Noirot, G., Stern, D., Mei, S., et al. 2018, ApJ, 859, 38
- Noll et al. (2009) Noll, S., Burgarella, D., Giovannoli, E., et al. 2009, A&A, 507, 1793
- Oke & Gunn (1983) Oke, J. B., & Gunn, J. E. 1983, ApJ, 266, 713
- Ouchi et al. (2004) Ouchi, M., Shimasaku, K., Okamura, S., et al. 2004, ApJ, 611, 685
- Overzier (2016) Overzier, R. A. 2016, A&A Rev., 24, 14
- Overzier et al. (2008) Overzier, R. A., Bouwens, R. J., Cross, N. J. G., et al. 2008, ApJ, 673, 143
- Peacock (1983) Peacock, J. A. 1983, MNRAS, 202, 615
- Peng et al. (2010) Peng, Y.-j., Lilly, S. J., Kovač, K., et al. 2010, ApJ, 721, 193
- Planck Collaboration et al. (2015) Planck Collaboration, Aghanim, N., Altieri, B., et al. 2015, A&A, 582, A30
- Prescott et al. (2008) Prescott, M. K. M., Kashikawa, N., Dey, A., & Matsuda, Y. 2008, ApJ, 678, L77
- Probst et al. (2008) Probst, R. G., George, J. R., Daly, P. N., Don, K., & Ellis, M. 2008, in Proc. SPIE, Vol. 7014, Ground-based and Airborne Instrumentation for Astronomy II, 70142S
- Reddy & Steidel (2009) Reddy, N. A., & Steidel, C. C. 2009, ApJ, 692, 778
- Rigby et al. (2014) Rigby, E. E., Hatch, N. A., Röttgering, H. J. A., et al. 2014, MNRAS, 437, 1882
- Sajina et al. (2012) Sajina, A., Yan, L., Fadda, D., Dasyra, K., & Huynh, M. 2012, ApJ, 757, 13
- Salmon et al. (2015) Salmon, B., Papovich, C., Finkelstein, S. L., et al. 2015, ApJ, 799, 183
- Salpeter (1955) Salpeter, E. E. 1955, ApJ, 121, 161
- Sanders & Mirabel (1996) Sanders, D. B., & Mirabel, I. F. 1996, ARA&A, 34, 749
- Sawicki (2002) Sawicki, M. 2002, AJ, 124, 3050
- Schenker et al. (2013) Schenker, M. A., Ellis, R. S., Konidaris, N. P., & Stark, D. P. 2013, ApJ, 777, 67
- Shim et al. (2011) Shim, H., Chary, R.-R., Dickinson, M., et al. 2011, ApJ, 738, 69
- Smit et al. (2012) Smit, R., Bouwens, R. J., Franx, M., et al. 2012, ApJ, 756, 14
- Snyder et al. (2012) Snyder, G. F., Brodwin, M., Mancone, C. M., et al. 2012, ApJ, 756, 114
- Spitler et al. (2014) Spitler, L. R., Straatman, C. M. S., Labbé, I., et al. 2014, ApJ, 787, L36
- Stanford et al. (1998) Stanford, S. A., Eisenhardt, P. R., & Dickinson, M. 1998, ApJ, 492, 461
- Stark et al. (2009) Stark, D. P., Ellis, R. S., Bunker, A., et al. 2009, ApJ, 697, 1493
- Stark et al. (2013) Stark, D. P., Schenker, M. A., Ellis, R., et al. 2013, ApJ, 763, 129
- Steidel et al. (1998) Steidel, C. C., Adelberger, K. L., Dickinson, M., et al. 1998, 492, 428
- Steidel et al. (2005) Steidel, C. C., Adelberger, K. L., Shapley, A. E., et al. 2005, ApJ, 626, 44
- Steidel et al. (2000) —. 2000, 532, 170
- Stern et al. (2005) Stern, D., Eisenhardt, P., Gorjian, V., et al. 2005, ApJ, 631, 163
- Thomas et al. (2005) Thomas, D., Maraston, C., Bender, R., & Mendes de Oliveira, C. 2005, ApJ, 621, 673
- Topping et al. (2018) Topping, M. W., Shapley, A. E., Steidel, C. C., Naoz, S., & Primack, J. R. 2018, ApJ, 852, 134
- Toshikawa et al. (2016) Toshikawa, J., Kashikawa, N., Overzier, R., et al. 2016, ApJ, 826, 114
- Toshikawa et al. (2018) Toshikawa, J., Uchiyama, H., Kashikawa, N., et al. 2018, PASJ, 70, S12
- Tran et al. (2010) Tran, K.-V. H., Papovich, C., Saintonge, A., et al. 2010, ApJ, 719, L126
- Umehata et al. (2014) Umehata, H., Tamura, Y., Kohno, K., et al. 2014, MNRAS, 440, 3462
- Vaccari (2015) Vaccari, M. 2015, in The Many Facets of Extragalactic Radio Surveys: Towards New Scientific Challenges, 27
- van Dokkum & van der Marel (2007) van Dokkum, P. G., & van der Marel, R. P. 2007, ApJ, 655, 30
- Venemans et al. (2005) Venemans, B. P., Röttgering, H. J. A., Miley, G. K., et al. 2005, A&A, 431, 793
- Venemans et al. (2007) —. 2007, A&A, 461, 823
- Wang et al. (2016) Wang, T., Elbaz, D., Daddi, E., et al. 2016, ApJ, 828, 56
- Wiklind et al. (2008) Wiklind, T., Dickinson, M., Ferguson, H. C., et al. 2008, ApJ, 676, 781
- Xue et al. (2017) Xue, R., Lee, K.-S., Dey, A., et al. 2017, ApJ, 837, 172
- Yamada et al. (2012) Yamada, T., Matsuda, Y., Kousai, K., et al. 2012, ApJ, 751, 29
| ID | R.A. (J2000) | Decl. (J2000) | [3.6] | [4.5] | [5.8] | [8.0] | ||||||
|---|---|---|---|---|---|---|---|---|---|---|---|---|
| Q112 | 217.953683 | 32.28450 | 27.41 | 27.02 | 26.67 | 26.34 | 24.530.29 | 23.210.10 | 21.980.15 | 21.560.14 | 21.23 | 20.90 |
| Q2396 | 217.741855 | 32.32550 | 27.41 | 26.360.37 | 25.890.47 | 25.470.37 | 24.270.23 | 23.000.14 | 22.960.26 | 22.560.22 | 21.23 | 20.90 |
| Q3161 | 217.721483 | 32.19860 | 27.41 | 27.02 | 26.67 | 26.34 | 24.250.24 | 22.890.10 | 21.830.20 | 21.330.14 | – | – |
| Q3268 | 217.943585 | 32.34119 | 27.41 | 26.450.48 | 26.67 | 25.980.76 | 24.100.32 | 22.700.14 | 22.150.20 | 21.680.18 | 21.23 | 20.90 |
| Q3296 | 217.931437 | 32.20151 | 27.41 | 27.02 | 26.67 | 24.780.46 | 24.060.33 | 22.690.13 | 22.510.63 | 22.780.53 | – | 20.90 |
| P3374 | 217.766615 | 32.34254 | 27.41 | 25.370.16 | 25.190.25 | 24.980.27 | 23.680.15 | 22.370.08 | 22.260.14 | 21.930.12 | 20.84 0.35 | 20.220.16 |
| P3433 | 218.098397 | 32.20417 | 27.41 | 26.100.28 | 25.570.31 | 26.010.73 | 24.720.28 | 23.320.12 | 22.910.56 | 22.610.32 | – | 20.90 |
| Q4670 | 217.914775 | 32.22440 | 27.41 | 27.02 | 26.67 | 26.34 | 23.890.23 | 22.630.08 | 21.520.18 | 21.430.15 | – | 20.90 |
| Q4943 | 218.106545 | 32.37317 | 27.41 | 26.550.38 | 26.67 | 25.550.41 | 24.880.40 | 23.290.22 | 22.680.27 | 22.310.26 | 21.23 | 20.90 |
| Q4948 | 218.027168 | 32.22880 | 27.41 | 27.02 | 26.67 | 26.34 | 24.630.29 | 23.280.15 | 22.750.53 | 22.740.36 | – | 20.90 |
| P5479 | 218.107794 | 32.38329 | 27.41 | 24.910.21 | 24.940.24 | 24.850.27 | 24.610.35 | 23.140.17 | 22.920.27 | 22.420.24 | 21.23 | 20.90 |
| Q5595 | 217.762752 | 32.38484 | 27.41 | 27.02 | 26.67 | 25.670.53 | 23.860.18 | 22.550.08 | 21.690.12 | 21.430.11 | 21.05 0.33 | 20.780.28 |
| Q5788 | 217.833271 | 32.38915 | 27.41 | 26.490.29 | 26.350.49 | 26.34 | 24.620.26 | 23.190.11 | 22.960.23 | 22.650.21 | 21.23 | 20.90 |
| Q6407 | 217.756014 | 32.40108 | 27.41 | 27.02 | 25.850.53 | 26.080.86 | 25.05 | 22.930.15 | 22.900.37 | 22.640.33 | 21.23 | 20.90 |
| Q6497 | 217.897260 | 32.25346 | 27.41 | 26.610.78 | 25.850.69 | 24.970.50 | 23.980.29 | 22.680.11 | 21.840.36 | 22.160.39 | – | 20.90 |
| Q6936 | 217.732113 | 32.41123 | 27.41 | 27.02 | 26.67 | 26.34 | 25.05 | 23.760.22 | 22.990.29 | 22.570.26 | 21.23 | 20.90 |
| Q7103 | 217.884829 | 32.41509 | 27.41 | 27.02 | 26.67 | 26.34 | 25.05 | 23.680.19 | 23.180.39 | 22.990.35 | 20.470.37 | 20.90 |
| Q7163 | 217.902270 | 32.41554 | 27.41 | 27.02 | 26.67 | 25.310.50 | 25.05 | 22.660.13 | 22.990.44 | 22.800.39 | 21.190.77 | 20.90 |
| Q7361 | 218.138166 | 32.41936 | 27.41 | 27.02 | 26.67 | 26.150.70 | 24.390.36 | 23.050.14 | 21.680.18 | 21.250.18 | 21.23 | 20.450.28 |
| Q7775 | 218.095899 | 32.42599 | 27.41 | 27.02 | 26.67 | 26.34 | 23.990.19 | 22.790.12 | 21.530.14 | 21.130.14 | 20.51 0.24 | 20.90 |
| Q7961 | 217.658322 | 32.42931 | 27.41 | 26.610.45 | 26.220.57 | 25.720.54 | 24.540.27 | 23.260.18 | 22.660.28 | 22.700.29 | 21.23 | 20.530.33 |
| Q8038 | 217.712417 | 32.43066 | 27.41 | 27.02 | 26.67 | 26.34 | 24.220.28 | 22.770.13 | 22.150.19 | 21.690.18 | 20.36 0.27 | 20.90 |
| Q8068 | 217.871038 | 32.43181 | 27.41 | 27.02 | 26.67 | 26.121.07 | 24.330.27 | 22.750.16 | 21.720.24 | 21.390.23 | 20.270.44 | 20.90 |
| Q8108 | 217.737275 | 32.27759 | 27.41 | 27.02 | 26.67 | 25.700.57 | 24.230.27 | 22.930.15 | 22.430.24 | 22.030.19 | 21.23 | 20.90 |
| Q8847 | 217.978870 | 32.44496 | 27.41 | 27.02 | 26.67 | 26.34 | 24.250.25 | 22.970.16 | 22.100.22 | 21.790.21 | 20.22 0.28 | 20.90 |
| Q9512 | 217.951934 | 32.30146 | 27.41 | 27.02 | 26.020.54 | 24.700.26 | 23.450.12 | 22.240.06 | 21.470.10 | 21.560.10 | 21.23 | 20.90 |
| P9576 | 217.865190 | 32.45845 | 27.41 | 25.870.18 | 25.810.35 | 25.230.26 | 24.000.15 | 22.730.09 | 23.090.21 | 22.900.20 | 20.870.25 | 20.90 |
| Q10133 | 217.948664 | 32.46798 | 27.41 | 27.02 | 26.67 | 25.820.55 | 24.120.24 | 22.790.10 | 21.870.15 | 21.510.14 | 21.23 | 20.90 |
| Q10226 | 217.807902 | 32.47021 | 27.41 | 27.02 | 26.67 | 26.34 | 24.350.23 | 22.880.11 | 22.960.23 | 22.720.22 | 21.23 | 20.90 |
| P10316 | 217.867090 | 32.47131 | 26.790.30 | 25.610.19 | 25.280.27 | 25.010.28 | 23.620.15 | 22.370.08 | 22.010.12 | 21.770.12 | 20.580.22 | 20.90 |
| Q10386 | 218.147692 | 32.47255 | 27.41 | 27.02 | 26.67 | 26.34 | 23.350.27 | 22.080.13 | 20.630.16 | 20.390.16 | 20.69 0.52 | 20.90 |
| Q10794 | 217.902578 | 32.48004 | 27.41 | 27.02 | 26.67 | 26.34 | 25.05 | 23.710.17 | 23.170.43 | 22.720.34 | 20.950.55 | 20.90 |
| Q12526 | 217.897738 | 32.50942 | 27.41 | 27.02 | 26.67 | 25.980.60 | 24.650.48 | 23.340.18 | 22.390.24 | 22.370.27 | 21.23 | 20.800.52 |
| Q12773 | 218.051315 | 32.51337 | 27.41 | 27.02 | 26.67 | 26.34 | 24.040.18 | 22.830.09 | 21.820.13 | 21.490.12 | 21.23 | 20.550.21 |
| Q13609 | 217.935053 | 32.52815 | 27.41 | 27.02 | 26.600.66 | 25.800.46 | 24.840.34 | 23.580.12 | 23.260.30 | 22.90 0.26 | 21.23 | 20.90 |
| P15053 | 218.146435 | 32.55216 | 27.41 | 25.730.32 | 25.250.36 | 24.470.31 | 24.270.37 | 22.920.23 | 22.340.28 | 22.350.31 | 21.23 | 20.90 |
| Q15256 | 217.728406 | 32.55562 | 27.41 | 27.02 | 26.67 | 26.34 | 24.350.29 | 22.900.14 | 22.500.23 | 22.120.21 | 21.23 | 20.90 |
| P15333 | 217.810823 | 32.55629 | 27.100.60 | 24.83 0.22 | 24.570.27 | 24.130.26 | 23.840.31 | 22.590.16 | 21.930.23 | 21.760.23 | 21.23 | 20.90 |
| Q17001 | 218.005890 | 32.58427 | 27.41 | 27.02 | 26.67 | 26.34 | 24.650.31 | 23.190.11 | 22.270.17 | 21.940.17 | 21.23 | 20.90 |
| Q17800 | 217.704266 | 32.59865 | 27.41 | 27.02 | 26.590.84 | 26.200.81 | 24.590.29 | 23.110.12 | 22.080.18 | 21.640.17 | 21.23 | 20.90 |
| Q17832 | 217.993321 | 32.59982 | 27.41 | 27.02 | 25.800.41 | 25.040.30 | 24.250.29 | 22.770.12 | 22.530.22 | 22.180.20 | 21.23 | 20.90 |
| Q17976 | 218.067814 | 32.60220 | 27.41 | 27.02 | 26.67 | 25.850.53 | 24.340.26 | 23.090.13 | 22.190.18 | 22.230.19 | 21.23 | 20.90 |
| Q18587 | 218.051648 | 32.61501 | 27.41 | 27.02 | 26.67 | 26.34 | 24.070.31 | 22.840.14 | 21.660.21 | 21.300.20 | 21.23 | 20.90 |
-
•
Notes: The letter in front of the ID number represents the type of BBGs: ‘P’ for post-starbursts and ‘Q’ for quiescent galaxies. In the case of non-detection, the corresponding 2 limiting magnitude is given. The sign ‘–’ is used when a source is out of image bounds or lies in the region with less than 20% of the maximum exposure time.