Neutron detection in the SNO+ water phase
Abstract
SNO+ is a multipurpose neutrino experiment located approximately 2 km underground in SNOLAB, Sudbury, Canada. The detector started taking physics data in May 2017 and is currently completing its first phase, as a pure water Cherenkov detector. The low trigger threshold of the SNO+ detector allows for a substantial neutron detection efficiency, as observed with a deployed 241Am9Be source. Using a statistical analysis of one hour AmBe calibration data, we report a neutron capture constant of (208.2 2.1)s and a lower bound of the neutron detection efficiency of 46% at the center of the detector.
1 Introduction
SNO+[1] is an underground multipurpose neutrino experiment that reuses the infrastructure of the SNO experiment. Located at a depth of 5890 meter water equivalent, the detector consists of a 12 m diameter spherical acrylic vessel (AV), which is currently filled with 1000 tonnes ultra pure water. Outside the AV, 9400 PMTs are mounted on an 18 m diameter geodesic stainless steel structure (PSUP). During the water phase, the experiment explores several interesting aspects of particle physics, including possible antineutrino searches using neutron tagging.
Electron antineutrinos are measured in most experiments via the inverse beta decay, as it provides a delayed neutron signal which can be used to suppress random background. In SNO+, neutrons propagating in light water will thermalize and then get captured by a proton, giving out a 2.2 MeV . Due to the small amount of energy deposited in the detector, neutron capture signals are very hard to detect in traditional pure water Cherenkov detectors. One approach[2] was explored in a previous experiment, which involves a forced trigger system after high energy events. Thanks to the good optical transparency and the upgraded electronics in SNO+, we are able to lower the detector threshold to 1.5 MeV, and can therefore trigger on the 2.2 MeV s with a substantial efficiency. In this proceeding we present the first result of neutron detection in a light water Cherenkov detector with normal trigger settings.
2 AmBe calibration
The 241Am9Be source is a common neutron source that mimics the electron antineutrino signal very well. The -particle emitted by 241Am (with a half-life of 432.2 years) can be absorbed by the 9Be target, which will then decay into 12C through neutron emission. About 60% of the time 12C is produced in an excited state and the immediate de-excitation predominantly emits a 4.4 MeV . The neutron, on the other hand, will thermalize and then get captured by a proton in 200 s. The AmBe source provides coincident signals with the prompt event being the 4.4 MeV and the delayed event being the neutron capture.
We used an AmBe source with a nominal strength of 1683.33 kBq and 62 Hz neutron rate[3]. The source was doubly encapsulated with black Delrin in SNO, and since then it had been used in the same form by other experiments at SNOLAB. Because the cleanliness of the existing encapsulations was not easy to assess, an extra encapsulation layer was designed, fabricated, leak tested and thoroughly cleaned prior to the source deployment in SNO+. This third encapsulation layer further reduces the risks of detector contamination.
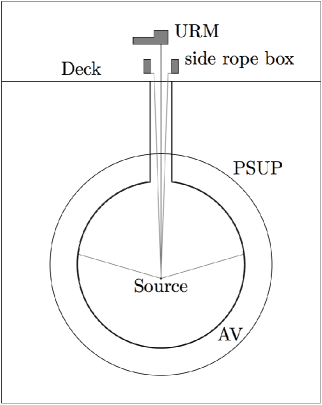
SNO+ reuses most of the SNO infrastructure for calibration[4] in the water phase with major upgrades on the side rope boxes. The Manipulator system, show schematically in Figure 1, contains an Umbilical Retrieval Mechanism (URM) which is mounted on the Universal Interface (UI). Calibration sources that are attached to a 33 meters umbilical and side ropes can then be placed in different positions inside the detector.
The AmBe calibration was carried out in January 2018, at 23 different positions along the two axes: the vertical z-axis and the y-axis which points to the North. This allows detailed studies across the full detector volume. The total AmBe calibration time is 15 hours.
3 AmBe data analysis
Because the AmBe source is an untagged source, traditional analyses utilize time, position and other cuts to obtain a relatively pure sample. This method requires estimation of the background contamination, which often leads to large systematic uncertainties. The statistics can also be greatly reduced because of the stringent cuts. Here we present a statistical analysis that avoids the above problems, and also gives a direct measurement of the neutron detection efficiency.
The analysis started by filling a histogram with the time differences between the prompt event and the delayed event. These prompt events and delayed events were selected with a minimum Nhit (number of hit PMTs in one event) cut and only the first delayed event was kept for each prompt event. We did not exclude the possibility of one event being both the delayed event in one pair and the prompt event in the next pair. This histogram can then be categorized into three components:
-
•
True-True event: the prompt is the 4.4 MeV , and the delayed is the associated neutron.
-
•
True-Fake event: the prompt is the 4.4 MeV , but the delayed is background event.
-
•
Fake-Fake event: both prompt and delayed are backgrounds. The distribution of Fake-Fake events will follow an exponential with an exponential constant of the background rate.
For a True-Fake event, the prompt 4.4 MeV is correctly identified. If the neutron does not trigger the detector or gets removed by the Nhit cut, the distribution will be an exponential with an exponential constant of the background rate. However, if the neutron triggers the detector and passes the Nhit cut, the delayed event can be either the associated neutron or a background event that happens to appear before the neutron. Therefore, the probability of the delayed event being a background is:
| (1) | ||||
where is the fraction of true 4.4 MeV s in the prompt events, is the neutron detection efficiency, is the neutron capture constant and is the background rate.
Similarly, for a True-True event we have:
| (2) |
Therefore, we derived the fit function for the time difference histogram:
| (3) |
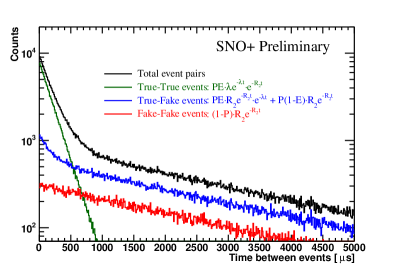
where is a normalization factor associated with detector livetime and histogram bin size and is the prompt event rate. Figure 2 shows the three different components of the time difference histogram from a toy MC model.
4 Analysis results
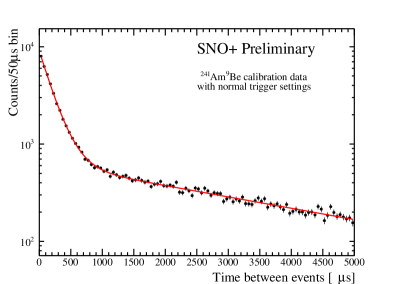
We present here the analysis result for a one hour AmBe run where the source is positioned at the center of the detector. Figure 3 shows the fitted results. We report a neutron capture constant of (208.2 2.1)s, which is consistent with previous measurements[5][6][7].
By varying the Nhit cut on the prompt events, we found the maximum value to be 46%. By definition is smaller than 1,therefore we derived a conservative lower limit for at the center of the detector:
| (4) |
This is the highest neutron detection efficiency achieved to date in a pure water Cherenkov detector.
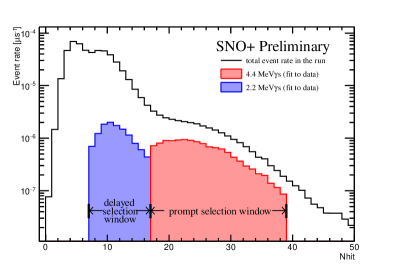
Note that is the rate of true -n coincidences, regardless of whether there is a background event before the neutron. By calculating the difference of for two consecutive Nhit cuts, we can plot the Nhit distributions for both the 4.4 MeV s and the neutrons, which is shown in Figure 4. Also note that using this method, the Nhit distributions are not biased by random background and therefore can be used for energy calibration for the detector. It will not only provide an additional check on the energy scale linearity, but additionally will help to constrain measurement of backgrounds from U/Th chains.
5 Conclusion
SNO+ started its water phase in May 2017 and has been steadily taking data since then. An AmBe source was deployed in the SNO+ detector for energy calibration and potential antineutrino searches. In this proceeding, we presented a novel data analysis method using statistical separation. With one hour central run data, we measured the neutron capture constant to be (208.2 2.1)s. A lower limit of 46% neutron detection efficiency was obtained at the SNO+ detector center. This is the highest neutron detection efficiency achieved to date in a pure water Cherenkov detector.
This work is supported by ASRIP, CIFAR, CFI, DF, DOE, ERC, FCT, FedNor, NSERC, NSF, Ontario MRI, Queen’s University, STFC, UC Berkeley and benefitted from services provided by EGI, GridPP and Compute Canada. The poster presenter thanks FCT (Fundaço para a Cincia e a Tecnologia, Portugal) and the Arthur B. McDonald Canadian Astroparticle Physics Research Institute for financial support. We thank SNOLAB and Vale for valuable support.
References
References
- [1] Andringa S et al. (The SNO+ Collaboration) 2016 Adv. High Energy Phys. 2016 6194250 (Preprint 1508.05759)
- [2] Watanabe H et al. (The Super-Kamiokande Collaboration) 2009 Astropart. Phys. 31 320–328 (Preprint 0811.0735)
- [3] Loach J 2009 Ph.D. thesis University of Oxford
- [4] Moffat B A, Ford R J, Duncan F A, Graham K, Hallin A L, Hearns C A W, Maneira J, Skensved P and Grant D R 2005 Nucl. Instrum. Meth. A554 255–265 (Preprint nucl-ex/0507026)
- [5] Zhang Y et al. (The Super-Kamiokande Collaboration) 2016 Phys. Rev. D93 012004 (Preprint 1509.08168)
- [6] Zhang H et al. (Super-Kamiokande) 2015 Astropart. Phys. 60 41–46 (Preprint 1311.3738)
- [7] Cokinos D and Melkonian E 1977 Phys. Rev. C15 1636–1643