The first orbital period of a very bright and fast Nova in M31: M31N 2013-01b
Abstract
We present the first X-ray and UV/optical observations of a very
bright and fast nova in the disc of M31, M31N 2013-01b. The nova reached a peak magnitude
15 mag and decayed by 2 magnitudes in only 3 days, making it one of the
brightest and fastest novae ever detected in Andromeda. From archival
multi-band data we have been able to trace its fast evolution down to mag in less
than two weeks and to uncover for the first time the Super-Soft X-ray phase, whose onset
occurred 10-30 days from the optical maximum.
The X-ray spectrum is consistent with a blackbody with a temperature of 50 eV and
emitting radius of 4 cm, larger than a white dwarf radius, indicating
an expanded region.
Its peak X-ray luminosity, 3.5 erg s-1, locates M31N 2013-01b
among the most luminous novae in M31.
We also unambiguously detect a short 1.280.02 h X-ray periodicity that we
ascribe to the binary orbital period, possibly due to partial eclipses. This makes
M31N 2013-01b the first nova in M31
with an orbital period determined. The short period also makes this nova one of the few
known below the 2-3 h orbital period gap.
All the observed characteristics strongly indicate that M31N 2013-01b harbours
a massive white dwarf and a very low-mass companion, consistent with being a nova belonging to the disc population
of the Andromeda Galaxy.
1 Introduction
Classical Novae (CN) are close binary systems ( 1.5 - 10 h) consisting of a late type main sequence or red giant secondary and an accreting white dwarf (WD) primary that experience an outburst triggered by a thermonuclear runaway in the hydrogen-rich accreted material (Bode&Evans, 2008). CN thus belong to the cataclysmic variable (CV) class. After a maximum (brightening up to 7-16 mag), the optical emission declines due to the receding photosphere at a rate which defines the Nova speed class (Payne-Gaposchkin, 1964). Part of the material is expelled at high velocities (Shore et al., 2011). The decline time, typically defined as the time needed to decline by 2 magnitudes (t2) was found to be related to the peak maximum (Della Valle&Livio, 1995) and to the expansion velocity of the ejected envelope (Della Valle et al., 2002; Shafter et al., 2011; Schwarz et al., 2011). Fast novae tend to be brighter and to display high expansion velocities.
After one to a few weeks, the receding atmosphere towards the hotter inner regions is such that the emission moves to X-rays, making the Nova a Super-Soft X-ray Source (SSS) with temperature of the order of 20-80 eV and X-ray luminosities erg s-1. This phase is powered by stable hydrogen burning within the part of the accreted envelope and is observable when the ejected matter becomes optically thin to soft X-rays (Orio et al., 2001; Krautter, 2002).
Few novae during the SSS phase were found to display short period X-ray oscillations or quasi-oscillations on time-scales of several tens of sec with relatively short duty cycles (Beardmore et al., 2008; Ness et al., 2015), ascribed to pulsations of the burning envelope, which, if confirmed, have the potential to estimate the WD mass (see Ness et al., 2015; Wolf et al., 2018, and references within). Oscillations on time-scales of thousands of seconds detected during the SSS phase have been interpreted as non-radial pulsations (Drake et al., 2003; Dobrotka&Ness, 2010) while those found to be coherent signify the rotation period of a magnetic WD (Pietsch et al., 2011; Dobrotka&Ness, 2010). On the other hand, periodic variations on longer (hours) timescales are compatible with the binary orbit, showing either eclipses (Sala et al., 2008) or X-ray modulations (Henze et al., 2010, 2014; Page et al., 2013; Beardmore et al., 2012).
Most Milky Way novae are found either in the Galactic Bulge or lying in the Galactic plane, thus suffering from strong absorption. Novae in Local Group galaxies provide instead the best targets to study outburst evolution and especially the SSS phase. Thanks to its close distance (776 pc, Dalcanton et al. (2012); we will adopt this distance throughout this article) and low Galactic extinction (Dalcanton et al., 2012) M31 is an ideal target to study nova populations. Henze et al. (2010, 2014) published 25 novae (out of the 80 known) in M31 that show the SSS phase, covering the period until 2012. Only two of them, M31N 2006-04a and M31N 2011-11e, possess a candidate X-ray orbital period (1.6 h and 1.3 h respectively), not confirmed due to the low statistics (Henze et al., 2014; Pietsch et al., 2011).
The Exploring the X-ray Transient and variable Sky (EXTraS) project (De Luca et al., 2016) developed new techniques and
tools to extract and describe the timing behavior of archival X-ray sources detected by XMM-Newton/EPIC (Strüder et al., 2001; Turner et al., 2001).
Thanks to the great improvement of EXTraS with respect to the 3XMM source catalog,
we performed a systematic search for eclipsing and/or dipping sources in the XMM-Newton data set pointing the M31 Galaxy, finding
significant and periodic dips in the light curve of 3XMM J004401.9+412544.
The X-ray source is located at
R.A., Dec. (J2000)1113XMM-DR8: http://xmmssc.irap.omp.eu/Catalogue/3XMM-DR8/3XMM_DR8.html
(1 statistical plus systematic error of 2”), positionally consistent with the optical nova
PNV J00440207+4125442=M31N 2013-01b (henceforth M31N2013),
located at R.A., Dec. (J2000) (5” statistical plus systematic error) (Hornoch, 2013).
It was detected only once by XMM-Newton (out of 12 observations)
on Feb.8, 2013, 14 days after the optical maximum reported by Hornoch (2013) and during a follow-up observation of the nova,
thus confirming the association of the two sources.
M31N2013 was found as a bright optical transient (Hornoch, 2013), with a peak
R-band magnitude on 2013, Jan. 25.728 UT (this will be considered as T0 for the rest of the paper) of 15.05(7).
Follow-up observations222IAU CBAT: http://www.cbat..eps.harvard.edu/unconf/followups/J00440207+4125442.html
showed a rapid fading in a few days. M31N2013 was spectroscopically confirmed
as a He/N or hybrid (Fe IIb) nova by Shafter et al. (2013), displaying broad (FWHM Balmer emission lines.
The magnitude and X-ray luminosity (see Table 1) are consistent with a
nova in M31, while excluding a foreground nova or a nova in our Galaxy
(that would be much more or much less luminous than the other observed novae, respectively).
It is located in the M31 disc (Hornoch, 2013), further supporting the M31 membership.
During the optical decline, apart from XMM-Newton, M31N2013 was also observed with the Neil Gehrels Swift satellite (henceforth Swift) in the X-rays and UV and optical, the Chandra X-ray Observatory, using either HRC (Murray et al., 2000) or ACIS instruments (Nousek et al., 1998). Here we present a complete analysis of optical/UV and X-ray SSS phase of this nova exploiting all the available data. Section 2 describes the data reduction, Section 3 the analysis, and in Section 4 we discuss the results.
2 Data reduction
An 24 ks XMM-Newton ToO was dedicated to M31N2013 on Feb. 8 (see Table 1). We made use of SAS v.15 to perform a standard data reduction from Observation Data Files, followed by a barycentrization to the Solar System using the SAS tool barycen. For the timing analysis we only made the standard selection on pattern (0-4 for pn and 0-12 for MOSs), using the 0.2-1 keV energy band since the source is not detected above 1 keV. Pn and MOSs events were then added to perform the analysis. We then made use of the EXTraS tools and cuts 333http://www.extras-fp7.eu/index.php to study M31N2013 light curves in the 0.2-1 keV energy band. For the spectral analysis we used the entire EPIC data set, excluding high background periods (this reduced the exposure to 16 ks). The Optical Monitor (OM)(Mason et al., 2001) data were reprocessed using the standard SAS tool omichain444http://xmm-tools.cosmos.esa.int/external/sas/current/doc/ . The transient was not detected by the Reflection Grating Spectrometers (RGS1,2) (Den Herder, 2001).
The Swift XRT data of the 8 observations (see Table 1) were processed with standard procedures using the
Ftool (v.6.19) task xrtpipeline. We selected events with grades
0-12 and limited the analysis between 0.3-1.0 keV.
The standard UVOT processing pipeline was used for the observations carried out with the UV filters,
UW1,UW2 and UM2. We used Heasoft tool uvotmaghist (taking into account the Small Scale Sensitivity check as recommendend in the cookbook) to
obtain a detection or an upper limit magnitude for each observation.
The Chandra observations (see Table 1), were reprocessed using the Chandra Interactive Analysis of Observation
(CIAO) software v4.5 with the chandra_repro task.
Table 1 reports the details of the X-ray and UV/optical simultaneous observations used in this paper.
| Instrument | OBS-ID | Optical/UV Band | Tstart | Exposure | L50 | Optical/UV magnitude |
|---|---|---|---|---|---|---|
| - | - | - | date(UTC) | ks | erg s-1 | mag |
| Swift | 00032697001 | U | 2013-02-01 11:40:59 | 3.9 | 3.6 | 18.840.08 |
| Swift | 00032697002 | U | 2013-02-05 19:48:59 | 3.5 | 3.51.3 | 19.850.15 |
| XMM-Newton | 0701981201 | UVW1 | 2013-02-08 21:55:52 | 24.0 | 3.30.2 | 19.930.38 |
| Swift | 00032697003 | U | 2013-02-09 13:42:58 | 3.9 | 1.80.8 | 20.370.18 |
| Swift | 00032697004 | U | 2013-02-13 07:39:59 | 3.8 | 3.7 | 20.780.35 |
| Swift | 00032697005 | U | 2013-02-17 04:27:59 | 4.0 | 3.5 | 21.9 |
| Chandra/ACIS-I | 14930 | - | 2013-02-18 08:02:31 | 3.9 | 250 | - |
| Swift | 00032697006 | UW1 | 2013-02-24 01:14:13 | 6.0 | 2.6 | 22.7 |
| Chandra/HRC-I | 14400 | - | 2013-02-24 10:38:42 | 5.1 | 0.94 | - |
| Swift | 00032697007 | UW2 | 2013-02-26 12:36:58 | 8.9 | 1.9 | 21.8 |
| Swift | 00032697008 | UM2 | 2013-03-07 03:18:38 | 5.2 | 3.3 | 21.8 |
| Chandra/HRC-I | 15620 | - | 2013-03-11 23:03:17 | 5.1 | 0.98 | - |
| Chandra/ACIS-I | 14931 | - | 2013-03-12 00:43:55 | 3.9 | 250 | - |
3 Data analysis
3.1 X-ray data
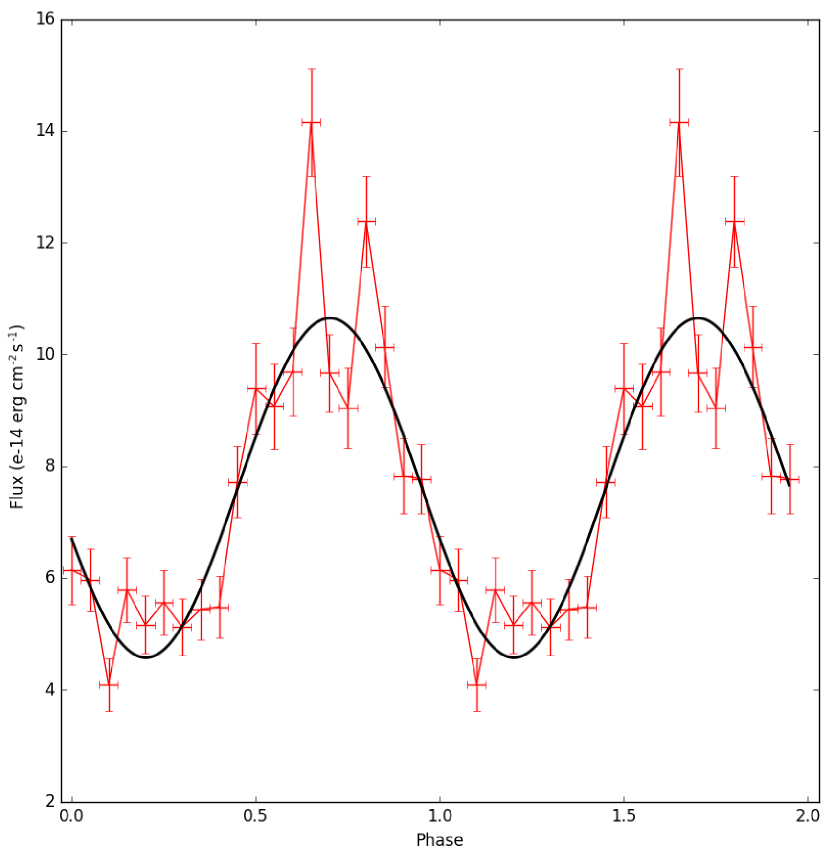
M31N2013 was selected among the 3XMM source list in M31 as one of the best eclipsing object candidate. We adopted the spectral model used for the equivalent luminosity (see below) to convert EXTraS background-subtracted count rates into absorbed fluxes, then we made a weighted average of the flux light curve of each EPIC instrument to obtain a total flux light curve. We fitted a periodic eclipse model on the filtered 500 s flux light curve. Using an f-test, we found a significant improvement with respect to a constant model, with a chance probability of 3.4. However, the model itself does not give a good representation of the light curve shape, giving null hypothesis probability (nhp) of 1.2, indicating a more complex shape. We performed an independent search on pn plus MOSs events with a Rayleigh test on the XMM-Newton pn plus MOSs event list (Buccheri et al., 1983) over more than 9000 independent periods in the range 0.001-4.2 h. This yielded a Z2 value of 90 for P=1.29 h , which corresponds to a chance probability of 3 (taking into account the number of trials). We note that % of events come from pn. A similar analysis based on pn only events still gives the periodicity at . To refine the period value we used a standard folding analysis based on the sum of pn and MOS counts into 10 phase bins. This resulted in a best period of P=1.280.02 h. All uncertainties are 1 error as estimated following Leahy (1987).
We fitted the XMM-Newton spectra using an absorbed (abundances from Wilms et al., 2000) blackbody, obtaining a good fit (nhp=0.16, d.o.f.=37) with column density NH = (2.60.4) cm-2 (in this paper, all the uncertainties are at 1), a temperature kT = (473) eV, an emission radius R = 4.2 cm and an absorbed 0.2-10 keV flux of (6.82.5) erg cm-2 s-1. For such a supersoft source, degeneration among parameters is expected and the flux cannot be de-absorbed correctly. In order to compare M31N2013 with the other novae from M31, we adopted the definition of “equivalent luminosity” L50 from Henze et al. (2014), obtained using a blackbody temperature kT = 50 eV and the Galactic foreground absorption NH = cm-2 (Henze et al., 2014). For M31N2013 we therefore obtain an unabsorbed flux of (4.60.2) erg cm-2 s-1, that translates into a L50 = (3.30.2) erg s-1. See also Figure 3.
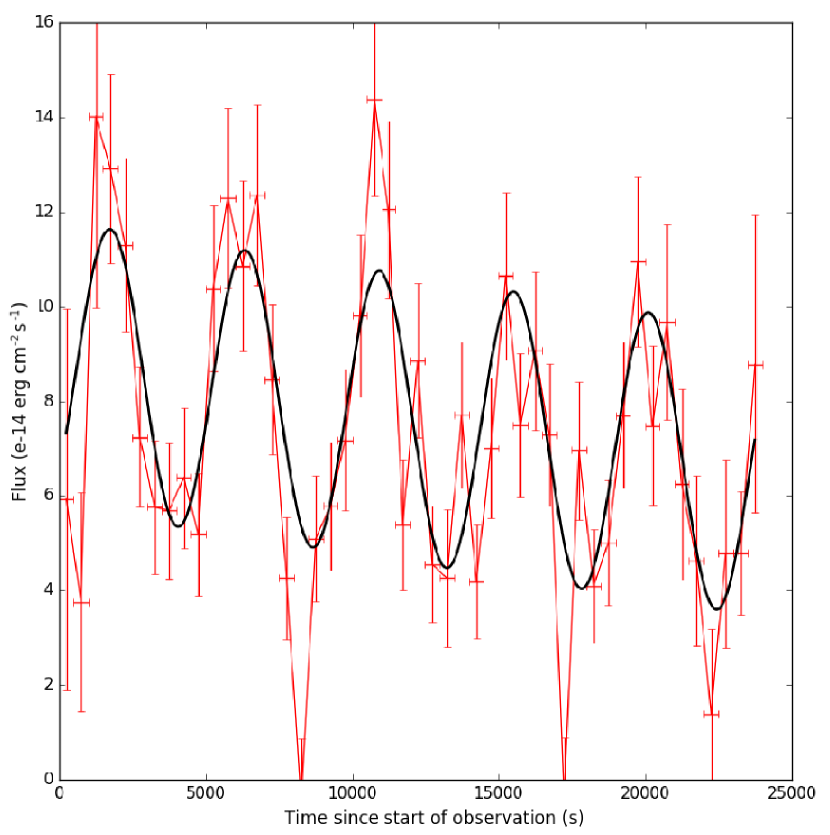
The XMM-Newton light curve of M31N2013 has been folded using 20 bins (so that each bins has 50 counts, see Section 2) using the period obtained through the timing analysis (see Figure 1). The phased light curve shows a quasi-sinusoidal shape, even if the low significance of a constant plus sinusoidal model (nhp = 4.2, 17 d.o.f.) and of a simple eclipse model (nhp = 4.6, 16 d.o.f) point to a more complex behavior. Using a sinusoidal model, the pulsed fraction (defined as the normalization of the sinusoid over the constant) is (405)%. The light curve also shows hints of a linear decrease with time (see Figure 2), but not statistically significant (an f-test gives a chance probability for the improvement of 0.07).
In order to search for spectral variability, we extracted XMM-Newton spectra in two phase ranges, namely 0.0-0.5 (off-pulse phase) and 0.5-1 (on-pulse phase). A spectral fit with all the parameters tied but the normalization gives an acceptable fit, nhp=0.98 d.o.f.=30 (Roff=3.1 cm, Ron=4.1 cm). Similarly, leaving free the column density we obtain an acceptable fit, nhp=0.96 d.o.f. 30 (N = (2.40.5), N = (1.80.4)). We also checked the spectra of the first and second half of observation, obtaining again an acceptable fit. To further inspect possible spectral changes, we also produced Hardness Ratios (HR) both phased (10 bins) and with time (one per orbital period) in the energy bands 0.2-0.4 keV and 0.4-0.7 keV. The HR distributions are consistent with a constant model. We therefore do not detect spectral variation with phase or time.
Using the ximage detect Heasoft tool, we checked for source detection in all the Swift/XRT observations. Obs.id. 00032697002 and 00032697003 revealed a source at the position of M31N2013 at 2.5. By adding the two images, we obtain a detection at 3.6. Altought statistically poor, we consider these as detections due to the positional coincidence and the fact that the XMM-Newton detection is in between these two observations. The background-subtracted count rates were then converted into equivalent luminosities L50 of (3.51.3) and (1.80.8) erg s-1 respectively, taking into account the exposure map, effective area and response matrix. For all the other Swift/XRT observations we extracted a 3 upper limit L50 using the definition of signal-to-noise. Similarly, we did not detect the X-ray counterpart in any of the Chandra data set, hence we derive 3 upper limits to L50 reported in Table 1 and Figure 3.
3.2 UV and optical data
An UV counterpart of M31N2013 is detected () only during the first 4 Swift/UVOT observations and by the XMM-Newton OM
(see Table 1), when the nova was brighter.
There is a clear exponential decrease in the U-band during the 12 days in which the source was detected.
For the first three Swift/UVOT observations we also obtained the UVOT positions overlapping at 1
and coincident with the optical position from Hornoch (2013); Shafter et al. (2013)
(R.A.,DEC. J2000): ,
(0.57”, systematic plus statistical error),
, (0.57”) and
, (0.62”).
To construct a long-term UV/optical light curve of M31N2013 we made use of the
measurements reported in Table 2, Swift/UVOT and XMM-Newton OM data in Table 1.
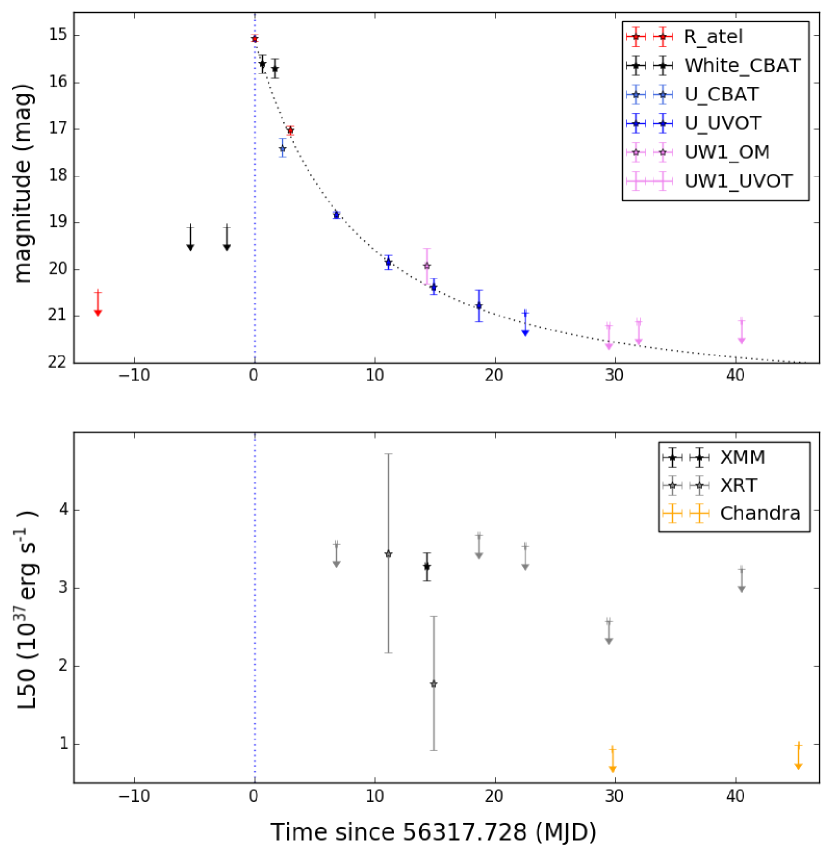
The long-term UV/optical light curve with all collected photometry is shown in the upper panel of
Figure 3 along the X-ray equivalent luminosities L50 from
XMM-Newton, Swift and Chandra, reported in the lower panel.
Bearing in mind that novae show different color decays and brightness at different wavelengths and we are using measurement from different filters, we
estimated using a power law fit to the composite long-term light curve. We derive =1.7 and =2.80.2 d
which is consistent with the simple difference between the two R band measures (3.0 days).
| Time | Optical band | magnitude | reference |
|---|---|---|---|
| UTC | - | mag | - |
| 2013-01-12 16:52:19.2 | R | 20.5 | [1] |
| 2013-01-20 10:06:14.4 | W | 19.1 | [3] |
| 2013-01-23 10:06:10.0 | W | 19.1 | [3] |
| 2013-01-25 17:28:19.2 | R | 15.050.07 | [1] |
| 2013-01-26 10:14:52.8 | W | 15.60.2 | [3] |
| 2013-01-27 10:42:14.4 | W | 15.70.2 | [3] |
| 2013-01-28 01:44:49.9 | U | 17.40.2 | [3] |
| 2013-01-28 17:26:52.8 | R | 17.020.09 | [2] |
4 Discussion
4.1 The X-ray periodicity
Our analysis of the XMM-Newton X-ray data resulted in a periodic modulation with a period of 1.280.02 h, obtained in an observation lasting about 5 cycles. The amplitude of this variability is large 40. The modulation appears to be also structured with hints of a double-peaked maximum and a flat minimum. The timescale and large amplitude of the modulation exclude that the SSS luminosity variation is due to pulsations (see Section 1). We ascribe the periodicity to the orbital period of the system. It is the first nova in M31 with an orbital period unambiguously detected in the X-rays. Only candidate periods of two novae in M31 were found by Henze et al. (2010, 2014) during the SSS phase of M31N 2006-04a and M31N 2011-11e, 1.6 h and 1.3 h, respectively. The orbital period of CVs is an observational proxy of their evolutionary state, where the secular mass transfer rate decreases as the systems evolve towards short orbital periods (Howell et al., 2001; Barker&Kolb, 2003). Hence, systems below the 2-3 h orbital period gap (Warner, 1995) are old systems and expected to accrete at a low-rates (Knigge et al., 2011). Assuming a 1.3 h orbital period, the donor in M31N2013 is expected to be a very low-mass () star and of late M or even later spectral type (Knigge et al., 2011). Observed spectral types of CV donors at these short periods have been found to be late M dwarfs, M6-M9 as it is the case for the short period (1.4 h) old novae CP Pup or GQ Mus (M6) (Szkody&Feinswog, 1988). For L-type donors the systems could also be period-bouncers and a few have been found so far with only one confirmed X-ray emitting magnetic system (Stelzer et al., 2017) accreting at very low rate (). The very short 1.28 h period locates M31N 2013-01b close to the expected theoretical orbital minimum of CVs ( 1.1 h) (Howell et al., 2001). Comparing the orbital period distribution of novae from Ritter&Kolb (2003) this nova is among the shortest orbital period systems and one of the few detected to display an orbital modulation in the SSS phase.
Orbital X-ray variability could be due to structures in the accretion disc although absorption effects should be present. Additionally, a partial eclipse from fixed regions such as the disc-rim or by the donor star could be viable solutions. Similar partial eclipses were claimed for two Galactic novae HV Cet (Beardmore et al., 2012) and V5116 Sgr (Sala et al., 2008). Both the models require an high-inclination system (i) Another possibility is that M31N2013 harbours a magnetic WD of the polar type (see Cropper, 1990, for a review), where no disc is formed due to the high magnetic field of the WD primary () that locks its rotation at the orbital period. The polars show strong X-ray variations (up to 100) due to localised accretion spots at the magnetic poles. However, the burning in the very early phases of a nova would rapidly reach a spherical symmetry, heating the whole WD surface (Casanova et al., 2010). The radius of the SSS emitting region is found to be in the range cm that is indeed much larger than those of WDs, indicating an expanded emitting envelope. The lack of observed spectral variability along the phase may favour an eclipse, possibly partial, of the X-ray emitting region.
4.2 M31N 2013-Ib: a very fast nova in M31
M31N2013 is a very fast nova, with a decay in the R band of 3 d. The rate of decay is then and consistent with the universal law by Hachisu&Kato (2006) where the flux decays as with =1.7-1.75. We find =1.7. Lee et al. (2012) suggests that such very fast novae are more rarely encountered in M31 than in our Galaxy, even if selection effects should be taken into account. In particular, the online catalogue of optical apparent novae in M31 by Pietsch & Haberl777http://www.mpe.mpg.de/ m31novae/opt/m31/index.php reports a handful (11) of very fast novae with similar 2-4 d. Fast novae are found to harbour massive WD () (Della Valle&Livio, 1995; Della Valle et al., 2002) and the light curves are predicted to be almost independent of the chemical composition once iron content is fixed (Hachisu&Kato, 2006).
The SSS X-ray turn-on and turn-off times cannot be fully constrained due to the lack of a deep monitoring shortly after the optical maximum. While the Swift/XRT upper limit on Feb. 1 is too weak to constrain the turn-on time, the detections by Swift/XRT and XMM-Newton could hint to a fast turn-on t 10 d (taking into account the T0 reported in Section 1). The turn-off time could have occurred about one month after the optical maximum given the non-detection in the Chandra data, or before. Such short times are consistent with the correlation found between the turn-on and turn-off times found for M31 novae by Henze et al. (2014). The hot blackbody temperature as derived from the X-ray spectral fit is also in agreement with a short turn-off time on similar timescale (see e.g. Henze et al., 2014). Additionally, results from the M31N2013 datasets – including the short t2, the extremely high expension velocity detected in the optical spectrum of the early phases of the outburst (Shafter et al., 2013), turn-on and turn-off time – appear to be consistent with the relations found for the M31 novae (Henze et al., 2014). Althought consistent, in all these graphs M31N2013 is always at the edge of the relationships, owing to its short t2, turn-on time and turn-off time, thus allowing for a better constraint of the link among these quantities. The X-ray luminosity of the SSS of M31N2013 is consistent with other M31 novae found so far (L erg s-1, Henze et al. (2014)), although it is in the bulk of the most luminous ones (only 4 out of the 24 M31 novae reported in Henze et al. (2014) show a higher L50).
Using the dust maps by Montalto et al. (2009) that include the contribution of the Galactic foreground extinction (Egal(B-V)=0.10), we derive a total extinction , since the location of M31N2013 within M31 is not known. This translates into a range of extinction in the R band of . Assuming a distance of 77618 kpc and this range of extinction, we estimate an absolute magnitude at the peak of the optical light curve in the range . This range is fully consistent with the absolute peak magnitude observed in fast novae with similar and in particular with the super-bright Galactic nova V1500 Cyg (Kato et al., 2013). Unfortunately, due to the loosly constrained optical and X-ray positions, a search for the nova progenitor resulted inconclusive.
Although not studied until now, M31N2013 is one of the brightest and fastest nova ever detected in M31, belonging to the disc population and likely harbouring a massive WD and one of the few known at very short orbital periods.
References
- Barker&Kolb (2003) Barker, J. & Kolb, U., 2003, MNRAS, 340, 623
- Beardmore et al. (2008) Beardmore, A.P. et al., 2008, ASPC, 401, 296
- Beardmore et al. (2012) Beardmore, A.P. et al., 2012, A&A, 545, 116
- Bode&Evans (2008) Bode, M.F & Evans, A., 2008, Classical Novae, eds. M.F. Bode, & A. Evans (Cambridge University Press)
- Buccheri et al. (1983) Buccheri, R., et al., 1983, A&A, 128, 245
- Casanova et al. (2010) Casanova, J., et al., 2010, A&A, 513, L5
- Cropper (1990) Cropper, M., 1990, SSRv, 54, 195
- Dalcanton et al. (2012) Dalcanton, J. J., et al., 2012, ApJS, 200, 18
- De Luca et al. (2016) De Luca, A., Salvaterra, R., Tiengo, A., et al. 2016, in The Universe of Digital Sky Surveys, Astrophysics and Space Science Proceedings, Vol. 42, ed. N. R. Napolitano et al. (Cham: Springer International), 291
- Della Valle&Livio (1995) Della Valle, M. & Livio, M., 1995, ApJ, 452, 704
- Della Valle et al. (2002) Della Valle, M. et al, 2002, A&A, 390, 155
- Den Herder (2001) Den Herder, J.W., et al. 2001, A&A 365, L7
- Dobrotka&Ness (2010) Dobrotka, A. & Ness, J.-U., 2010, MNRAS, 405, 2668
- Drake et al. (2003) Drake, J. J. et al., 2003, ApJ, 584, 448
- Hachisu&Kato (2006) Hachisu, I. & Kato, M., 2006, ApJS, 167, 59
- Henze et al. (2010) Henze, M., et al., 2010, A&A, 523, 89
- Henze et al. (2014) Henze, M. et al. 2014, A&A 563, A2
- Hornoch (2013) Hornoch, K., 2013, ATel.4765
- Howell et al. (2001) Howell, S.B., et al., 2001, ApJ, 550, 897
- Kato et al. (2013) Kato, M. et al., 2013, ApJ, 779, 19
- Knigge et al. (2011) Knigge, C., Baraffe I. & Patterson, J., 2011, ApJS, 194, 28
- Krautter (2002) Krautter, J., 2002 in Classical Nova Explosions, eds. M. Hernanz, & J.Jose AIP Conf. Proc., 637, 345
- Leahy (1987) Leahy, D. A., 1987, A&A, 180, 275
- Lee et al. (2012) Lee C.-H., et al., 2012, A&A, 537, A43
- Mason et al. (2001) Mason K.O., et al. 2001, A&A 365, L36
- Montalto et al. (2009) Montalto, M. et al., 2009, A&A, 507, 283
- Murray et al. (2000) Murray, S.S., et al., 2000, Proc.SPIE, 4012, 68
- Ness et al. (2015) Ness, J.-U. et al., 2015, A&A, 578, 39
- Nousek et al. (1998) Nousek, J.A., et al., 1998, Proc.SPIE, 3444, 225
- Orio et al. (2001) Orio, M., et al., 2001, A&A, 373, 542
- Page et al. (2013) Page et al., 2013, ApJ, 768, L26
- Payne-Gaposchkin (1964) Payne-Gaposchkin, C., 1964, The galactic novae (New York: Dover Publication)
- Pietsch et al. (2011) Pietsch, W. et al. 2011, A&A 531, A22
- Ritter&Kolb (2003) Ritter H. & Kolb U., 2003, A&A, 404, 301
- Sala et al. (2008) Sala, G., et al., 2008, ApJ, 675, L93
- Schwarz et al. (2011) Schwarz, G.J., et al., 2011, ApJS, 197, 31
- Shafter et al. (2011) Shafter, A.W., et al., 2011, ApJ, 734, 12
- Shafter et al. (2013) Shafter, A.W., 2013, ATel.4768
- Shore et al. (2011) Shore, S.N., et al., 2011, A&A, 533, 8
- Stelzer et al. (2017) Stelzer, B., et al., 2017, A&A, 598, L6
- Strope et al. (2010) Strope, R.J., et al. 2010, AJ, 140, 34
- Strüder et al. (2001) Strüder, L., et al. 2001, A&A 365, L18
- Szkody&Feinswog (1988) Szkody & Feinswog, 1988, ApJ, 334, 422
- Turner et al. (2001) Turner, M.J.L., et al., 2001, A&A 365, L27
- Warner (1995) Warner, B., 1995, Camb. Astrophys. Ser., Vol. 28
- Wilms et al. (2000) Wilms, J., Allen, A. & McCray, R. 2000, ApJ, 542, 914
- Wolf et al. (2018) Wolf, W.M., et al. 2018, ApJ 855, 127