]pmaterne@anl.gov
Microscopic phase diagram of LaFeAsO single crystals under pressure
Abstract
We investigated LaFeAsO single crystals by means of synchrotron Mössbauer spectroscopy under pressure up to 7.5 GPa and down to 13 K and provide a microscopic phase diagram. We found a continuous suppression of the magnetic hyperfine field with increasing pressure and it completely vanishes at 7.5 GPa which is in contrast to the behavior in polycrystalline samples where the magnetic order vanishes at 20 GPa. The different behavior of the polycrystalline samples might be due to As-vacancies. Our results are in qualitative agreement with density functional theory calculations where a reduction of the magnetic moment with increasing pressure was found. We found that among different samples at ambient pressure the magnetic phase transition temperature as well as the low-temperature magnetic hyperfine field decrease with increasing unit cell volume.
pacs:
74.70.Xa, 76.80.+y, 74.62.Dh, 74.62.FjI introduction
LaFeAsO as a member of the 1111 family is one of the most studied compounds of the iron-based superconductors. It offers high superconducting transition temperatures in the case of F-substitutionKamihara et al. (2008); Luetkens et al. (2009) or multiple antiferromagnetic phases in the case of P-substitution.Lai et al. (2014) Additionally LaFeAsO is theoretically approachable without the additional complication due to 3d-4f interaction in other rare earth 1111 compounds such as CeFeAsO, SmFeAsO, or PrFeAsO.Maeter et al. (2009); Pourovskii et al. (2008); McGuire et al. (2009) In this work we focus on the pressure dependent phase diagram on LaFeAsO single crystals.
Upon cooling LaFeAsO exhibit a structural phase transition from P4/nmm to Cmma at 145 K and shows spin density wave order below 127 K.Kappenberger et al. (2018) Measurements on polycrystalline samples have shown that the magnetic order is suppressed with increasing pressure and fully vanished for pressures of 20 GPa.Kumar et al. (2014); Kawakami et al. (2009) On the other hand, single crystal resistivity measurements by McElroy et al. have shown that the suppression of the magnetic order with increasing pressure is much stronger than in polycrystalline samples.McElroy et al. (2014) They found a nearly linear reduction of the magnetic ordering temperature to around 60 K at 6 GPa and extrapolated that the critical pressure for a full suppression of the magnetic order is 8 – 10 GPa. Following up on their work we investigated the microscopic magnetic phase diagram of LaFeAsO under pressure by means of synchrotron Mössbauer spectroscopy. We found that LaFeAsO single crystals behave differently from polycrystalline samples and that the magnetic order is already vanished at 7.5 GPa.
II experimental details
A LaFeAsO single crystal was investigated by means of synchrotron Mössbauer spectroscopy (SMS), also known as nuclear resonant forward scattering at the beamline 3ID-B of the Advanced Photon Source (APS), Argonne National Laboratory, USA. The single crystal growth is described in detail elsewhere.Kappenberger et al. (2018) The SMS experiments were performed in the hybrid filling operation mode of the APS in linear polarization of the beam and with a bunch separation time of 1594 ns. This large time window allows for a high precision measurement of weak hyperfine interactions. The single crystals were enriched with 15 % 57Fe to ensure a sufficient count rate. SMS spectra were recorded between 13 and 125 K and at applied pressures between 0.5 and 7.5 GPa using a special He-flow cryostat and a miniature diamond anvil cell .Bi et al. (2015); Zhao et al. (2017) Diamond anvils with 800 m culet size were used. A Re gasket was preindented to 140 m and a hole of 400 m diameter was EDM drilled to act as a sample chamber. Daphne oil 7575 was used as the pressure transmitting medium ensuring quasi-hydrostaticity. The pressure was measured in situ using an online ruby system and changed at 100 K by a gas membrane system. The uncertainty in the pressure determination is 0.1 GPa. The beam size was 15 20 m2 full width at half maximum. CONUSS was used to analyze the SMS data.Sturhahn (2000) For a detailed introduction into SMS the interested reader is referred to the reviews of Sturhahn.Sturhahn et al. (1998); Sturhahn (2004)
III results and discussion
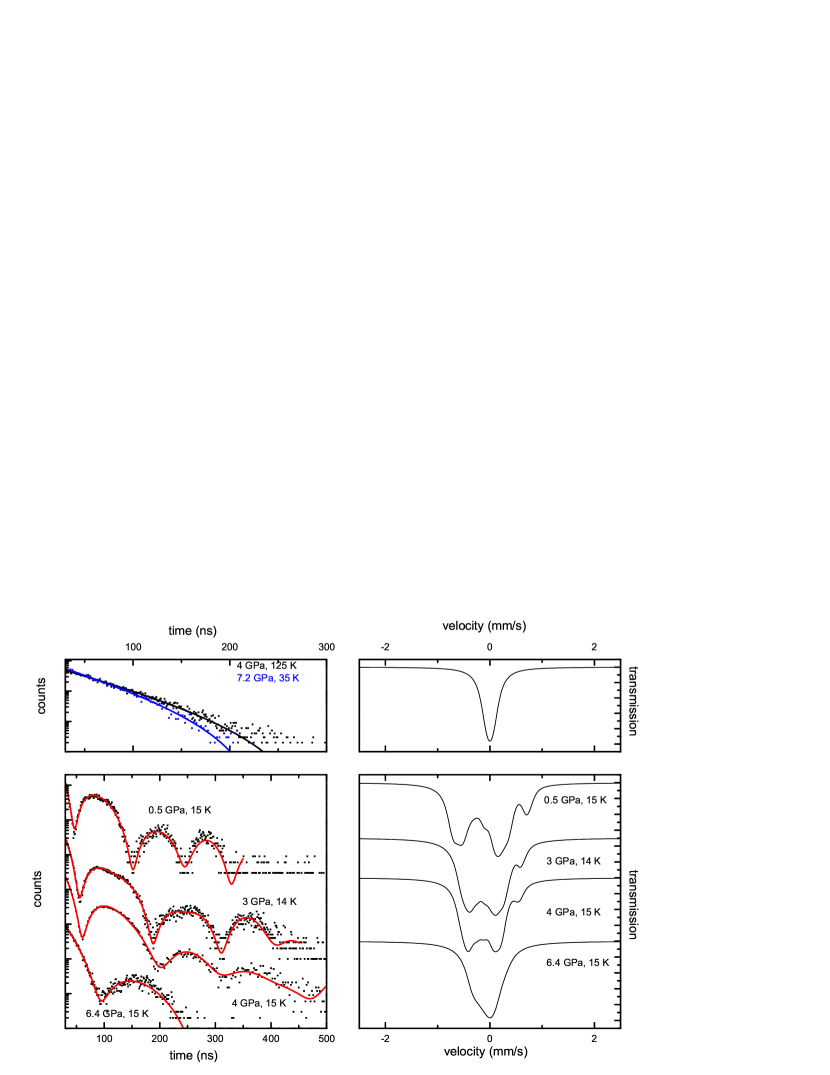
Synchrotron Mössbauer spectra for representative pressures and temperatures are shown in Fig. 1. No quantum beats were observed in the paramagnetic temperature regime in the investigated pressure region. This gives an upper limit for the quadrupole splitting of 0.04 mm/s which corresponds to an electric field gradient at the Fe nucleus of close to zero. This shows that the electronic environment of the Fe nucleus is nearly spherical. Therefore the FeAs tetrahedra is uniformly compressed with increasing pressure. Additionally this indicates a hydrostatic pressure condition. In the magnetic phase the quadrupole splitting is 0.34 mm/s at 0.5 GPa and decreases to 0.3 mm/s and 0.2 mm/s at 4 GPa and 6.4 GPa, respectively. At ambient pressure in polycrystalline samples in the magnetic phase quadrupole splittings of 0.12 to 0.3 mm/s were reported which are in fair agreement with our results.Klauss et al. (2008); McGuire et al. (2008); Kawakami et al. (2009) Studies in CeFeAsO and FeSe indicate that the increase in the quadrupole splitting is a result of the magnetic ordering and that the influence of the orthorhombic distortion is negligible.Materne et al. (2018); Błachowski et al. (2010)
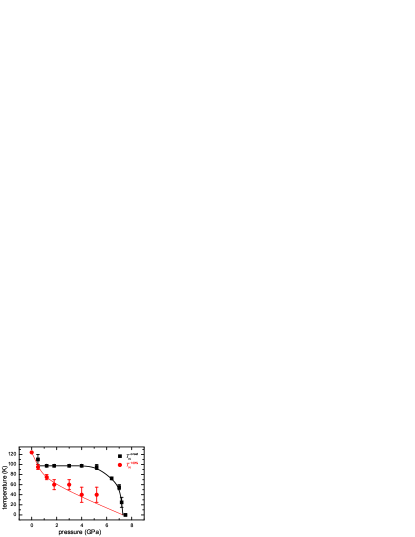
In the magnetically ordered phase the SMS spectra quantum beats appear arising from the nuclear Zeeman splitting. With increasing pressure the quantum beat period increases indicating a reduction of the magnetic hyperfine field. The magnetic phase transition region was modeled using a paramagnetic and magnetically ordered signal fraction indicating values of the magnetic volume fraction (MVF) between zero and one. From the temperature dependence of the MVF, which is shown in Fig. 2, two characteristic temperatures for the magnetic phase transition, T and T, can be extracted. T describes the highest temperature with a non-zero MVF while T is the highest temperature with 100 % MVF and both are shown in Fig. 3. T remains constant within error bars at 95 K up to 5.2 GPa and is vanished at 7.5 GPa.
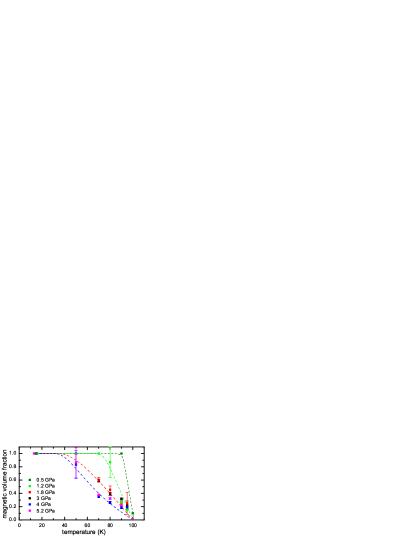
In contrast T is reduced with increasing pressure to 40(15) K at 5.2 GPa. Therefore, the magnetic phase transition region T = T T increases from 0 to 60 K for 0 and 5.2 GPa, respectively. This increase in T was also seen in muon spin relaxation experiments under pressure.Renzi et al. (2012) An increase in T is commonly attributed to a spatial distribution of TN.Materne et al. (2015, 2018); Goltz et al. (2014); Prando et al. (2013) A possible cause could be an increased strain from lattice misfit with increasing pressure.Ricci et al. (2010) For 6.4 and 7.2 GPa an extraction of the MVF was not possible due to small magnetic hyperfine fields. Thus the MVF was set to one during the analysis of those pressures in the magnetic phase transition region. However, this does not influence the analysis of the low-temperature data.
The magnetic hyperfine field as a function of temperature for representative pressure values is shown in Fig. 4. A reduction of the magnetic hyperfine field with increasing pressure was observed.

The low-temperature magnetic hyperfine field as a function of pressure is shown in Fig. 5. The low-temperature magnetic hyperfine field is continuously reduced to zero at 7.5 GPa. For this pressure an Fe-As distance of 2.37 Å can be extrapolated from reported room temperature data.Kobayashi et al. (2016)

It was shown that the Fe magnetic moment and thus the magnetic hyperfine field are related to the Fe-As distance which controls the Fe 3d-As 4p hybridization strength.Mirbt et al. (2003) If the hybridization is strong enough the Fe magnetic moment is quenched.McQueen et al. (2008); Wu et al. (2008) Therefore the continuous reduction of the magnetic hyperfine field to zero with decreasing Fe-As distance supports the picture that the dp hybridization strength controls the value of the iron magnetic moment. Theoretical calculations suggested that the critical Fe-As distance where the Fe magnetic moment vanishes is 2.36 Å.Mirbt et al. (2003) In our study the critical Fe-As distance is estimated to be 2.37 Å which is in good agreement with the calculations. Additionally our results are in qualitative agreement with density functional theory calculations where a reduction of the magnetic moment with increasing pressure was found.Opahle et al. (2009)
Extrapolating the obtained pressure dependence of the magnetic hyperfine field to zero pressure results in 3.7(1) T which is 1.3 1.6 T smaller than for LaFeAsO polycrystalline samples.Klauss et al. (2008); McGuire et al. (2008, 2009) Additionally the magnetic phase transition temperature TN determined by electrical resistivity, magnetic susceptibility, and specific-heat measurements on single crystalsKappenberger et al. (2018); McElroy et al. (2013, 2014); Jesche et al. (2012) has values between 117 and 127 K which are up to 36 K smaller than in polycrystalline samples.Klauss et al. (2008); Kawakami et al. (2009); McGuire et al. (2008) Both TN and the low-temperature magnetic hyperfine field B for single and polycrystalline samples are summarized in Tab. 1.
| B / T | TN/ K | |
| 3.7(1) | 127 | single crystalKappenberger et al. (2018) |
| 4.86(5) | 138 | polycrystalKlauss et al. (2008) |
| 5.1 | 139 | polycrystalRaffius et al. (1993) |
| 5.19(1) | 153 | polycrystal McGuire et al. (2008) |
| 5.3 | 145(5) | polycrystal, 0.1 MPaKawakami et al. (2009) |
| 5.5 | polycrystal, 4 GPaKumar et al. (2014) |
Samples with smaller TN also show a smaller B. This can be qualitatively understood in the framework of Landau theory where the magnetic order parameter M is proportional to TN with . Therefore a reduction of TN results in a reduction of M and thus of B.

Additionally different samples not only deviate in TN and B but also in the crystallographic parameters. This is shown in Fig. 6. The crystallographic a axis varies between 4.0367 Å and 4.0308 Å and thus is changed by 0.15 %.Kappenberger et al. (2018); McElroy et al. (2013); McGuire et al. (2008); Jesche et al. (2012); Raffius et al. (1993); Okada et al. (2008); Qureshi et al. (2010); Nomura et al. (2008); Luetkens et al. (2009) In contrast the crystallographic c axis varies between 8.793 Å and 8.7364 Å and thus is changed by up to 0.65 %.Kappenberger et al. (2018); McElroy et al. (2013); McGuire et al. (2008); Jesche et al. (2012); Raffius et al. (1993); Okada et al. (2008); Qureshi et al. (2010); Nomura et al. (2008); Luetkens et al. (2009) By increasing the unit cell volume and in particular the crystallographic c axis both TN and B decrease. Theoretical calculations suggest that the interlayer coupling is weak but important to stabilize the magnetic order.Andersen and Boeri (2011); Xu et al. (2008); Kou et al. (2009) By increasing the crystallographic c axis and thus the interlayer distance the interlayer coupling may decrease resulting in a weakened magnetic order. This theoretical picture is supported by the reduction of TN and B with increasing c. However, the origin of the discrepancy in the crystallographic parameters among different samples is unknown.
Resistivity measurements on polycrystalline samples show a linear reduction of the magnetic phase transition temperature between 0 and 2 GPa followed by an upturn.Okada et al. (2008) In contrast resistivity measurements on a single crystal show a linear reduction of TN to 60 K at 6 GPa.McElroy et al. (2014) Energy-domain Mössbauer spectroscopy measurements of polycrystalline samples under pressure have shown 100 % magnetic volume fraction at 8 GPa and 8 K.Kawakami et al. (2009) At pressures 8 GPa the magnetic volume fraction decreases with increasing pressure until a pure paramagnetic signal is observed at 24 GPa and 8 K.Kawakami et al. (2009) The pressure dependence of the reported magnetic hyperfine field follows the pressure dependence of the magnetic phase transition temperature determined by resistivity measurements in polycrystalline samples.Okada et al. (2008); Kawakami et al. (2009) It shows a linear reduction between 0 and 2 GPa followed by a plateau up to 20 GPa and a subsequent reduction to zero.Kawakami et al. (2009) In contrast, the magnetic hyperfine field obtained from SMS data on a single crystal shows a continuous reduction to zero at 7.5 GPa. The combination of the resistivity and Mössbauer experiments indicate that the single- and polycrystalline samples behave qualitatively similar at pressures below 2 GPa but differ at higher pressures.
The large difference between single and polycrystals may be due to the granular and inhomogeneous nature and O-deficiency at the grain boundaries of the latter. It was pointed out by McElroy et al. that in polycrystalline samples the reduction in the resistivity at lower temperatures is very broad and it goes to zero only at 12 GPa which is maybe caused by tiny amounts of O-deficient sample volumes.McElroy et al. (2014); Okada et al. (2008) Mössbauer measurements by Nowik et al. on O-deficient LaFeAsO have shown that Fe in the vicinity of an O vacancy has a small magnetic hyperfine field of 0.8 T but a huge quadrupole splitting of 0.86 mm/s at low temperatures.Nowik et al. (2008) In the Mössbauer experiments under pressure of the polycrystalline samples no O-deficiency was detected.Kawakami et al. (2009) Taking into account the volume resolution of the method ( 1 %) it is in agreement with possible tiny amounts of O-vacancies causing filamentary superconductivity.Kawakami et al. (2009); McElroy et al. (2014) Additionally the magnetic hyperfine field of 0.8 T is too small to account for the oberserved plateau at 3 T and therefore a significant O-deficiency can be ruled out.Kawakami et al. (2009)
Another possible explanation are As-vacancies in the polycrystalline samples. It was shown in LaFeAs1-xO0.9F0.1 that As-vacancies act as magnetic defects with a magnetic moment of 0.8 /Fe due to a spin polarization of the Fe 3d electrons if the Fe 3d-As 4p hybridization is sufficiently strong enough.Grinenko et al. (2011) This might lead to the situation that with increasing pressure the Fe 3d-As 4p hybridization will reduce the magnetic moment but the As-vacancies will enhance the spin polarization of the Fe 3d electrons and thus stabilize the magnetic order. To support or falsify this possibility further investigations are needed.
IV summary and conclusion
In summary we conducted synchrotron Mössbauer experiments at pressures up to 7.5 GPa and at temperatures between 13 and 125 K and provide a microscopic phase diagram of LaFeAsO single crystals under pressure. At the magnetic phase transition an increase in the quadrupole splitting was observed which is most likely of magnetic origin. The magnetic hyperfine field is continuously suppressed to zero at 7.5 GPa which corresponds to a Fe-As distance of 2.37 Å. Our results indicate that single and polycrystalline samples behave qualitatively similar up to 2 GPa but differ at higher pressures. Possible cause in polycrystalline samples could be due to their granular and inhomogeneous nature and O-deficiency at the grain boundaries. Another possibility in polycrystalline samples could be As-vacancies acting as magnetic centers as shown in Ref.Grinenko et al. (2011). We found that among different samples the magnetic phase transition temperature as well as the low-temperature magnetic hyperfine field decrease with increasing unit cell volume which might explain the difference in the observed quantities. Interestingly the behavior of both LaFeAsO single crystalsMcElroy et al. (2013, 2014); Fu et al. (2012); Jesche et al. (2012); Ok et al. (2018) and polycrystalline samplesKlauss et al. (2008); Kawakami et al. (2009); Kumar et al. (2014); Okada et al. (2008) are consistent within each other.
Acknowledgements.
Part of this work was funded by the Deutsche Forschungsgemeinschaft (DFG, German Research Foundation) – MA 7362/1-1, WU 595/3-3, BU 887/15-1, and the research training group GRK-1621. This research used resources of the Advanced Photon Source, a U.S. Department of Energy (DOE) Office of Science User Facility operated for the DOE Office of Science by Argonne National Laboratory under Contract No. DE-AC02-06CH11357. Support from COMPRES under NSF Cooperative Agreement EAR-1606856 is acknowledged for partial support of W. Bi.References
- Kamihara et al. (2008) Y. Kamihara, T. Watanabe, M. Hirano, and H. Hosono, J. Am. Chem. Soc. 130, 3296 (2008).
- Luetkens et al. (2009) H. Luetkens, H.-H. Klauss, M. Kraken, F. J. Litterst, T. Dellmann, R. Klingeler, C. Hess, R. Khasanov, A. Amato, C. Baines, M. Kosmala, O. J. Schumann, M. Braden, J. Hamann-Borrero, N. Leps, A. Kondrat, G. Behr, J. Werner, and B. Buchner, Nat. Mater. 8, 305 (2009).
- Lai et al. (2014) K. T. Lai, A. Takemori, S. Miyasaka, F. Engetsu, H. Mukuda, and S. Tajima, Phys. Rev. B 90, 064504 (2014).
- Maeter et al. (2009) H. Maeter, H. Luetkens, Y. G. Pashkevich, A. Kwadrin, R. Khasanov, A. Amato, A. A. Gusev, K. V. Lamonova, D. A. Chervinskii, R. Klingeler, C. Hess, G. Behr, B. Büchner, and H.-H. Klauss, Phys. Rev. B 80, 094524 (2009).
- Pourovskii et al. (2008) L. Pourovskii, V. Vildosola, S. Biermann, and A. Georges, Europhys. Lett. 84, 37006 (2008).
- McGuire et al. (2009) M. A. McGuire, R. P. Hermann, A. S. Sefat, B. C. Sales, R. Jin, D. Mandrus, F. Grandjean, and G. J. Long, N. J. Phys. 11, 025011 (2009).
- Kappenberger et al. (2018) R. Kappenberger, S. Aswartham, F. Scaravaggi, C. G. Blum, M. I. Sturza, A. U. Wolter, S. Wurmehl, and B. B chner, J. Cryst. Growth 483, 9 (2018).
- Kumar et al. (2014) R. S. Kumar, J. J. Hamlin, M. B. Maple, Y. Zhang, C. Chen, J. Baker, A. L. Cornelius, Y. Zhao, Y. Xiao, S. Sinogeikin, and P. Chow, Appl. Phys. Lett. 105, 251902 (2014).
- Kawakami et al. (2009) T. Kawakami, T. Kamatani, H. Okada, H. Takahashi, S. Nasu, Y. Kamihara, M. Hirano, and H. Hosono, J. Phys. Soc. Jpn. 78, 123703 (2009).
- McElroy et al. (2014) C. A. McElroy, J. J. Hamlin, B. D. White, S. T. Weir, Y. K. Vohra, and M. B. Maple, Phys. Rev. B 90, 125134 (2014).
- Bi et al. (2015) W. Bi, J. Zhao, J.-F. Lin, Q. Jia, M. Y. Hu, C. Jin, R. Ferry, W. Yang, V. Struzhkin, and E. E. Alp, J. Synch. Radiat. 22, 760 (2015).
- Zhao et al. (2017) J. Y. Zhao, W. Bi, S. Sinogeikin, M. Y. Hu, E. E. Alp, X. C. Wang, C. Q. Jin, and J. F. Lin, Rev. Sci. Instrum. 88, 125109 (2017).
- Sturhahn (2000) W. Sturhahn, Hyperfine Interact. 125, 149 (2000).
- Sturhahn et al. (1998) W. Sturhahn, E. Alp, T. Toellner, P. Hession, M. Hu, and J. Sutter, Hyperfine Interact. 113, 47 (1998).
- Sturhahn (2004) W. Sturhahn, J. Phys.: Condens. Matter 16, S497 (2004).
- Klauss et al. (2008) H.-H. Klauss, H. Luetkens, R. Klingeler, C. Hess, F. J. Litterst, M. Kraken, M. M. Korshunov, I. Eremin, S.-L. Drechsler, R. Khasanov, A. Amato, J. Hamann-Borrero, N. Leps, A. Kondrat, G. Behr, J. Werner, and B. Büchner, Phys. Rev. Lett. 101, 077005 (2008).
- McGuire et al. (2008) M. A. McGuire, A. D. Christianson, A. S. Sefat, B. C. Sales, M. D. Lumsden, R. Jin, E. A. Payzant, D. Mandrus, Y. Luan, V. Keppens, V. Varadarajan, J. W. Brill, R. P. Hermann, M. T. Sougrati, F. Grandjean, and G. J. Long, Phys. Rev. B 78, 094517 (2008).
- Materne et al. (2018) P. Materne, W. Bi, E. E. Alp, J. Zhao, M. Y. Hu, A. Jesche, C. Geibel, R. Kappenberger, S. Aswartham, S. Wurmehl, B. Büchner, D. Zhang, T. Goltz, J. Spehling, and H.-H. Klauss, Phys. Rev. B 98, 014517 (2018).
- Błachowski et al. (2010) A. Błachowski, K. Ruebenbauer, J. Zukrowski, J. Przewoznik, K. Wojciechowski, and Z. Stadnik, J. Alloys Compd. 494, 1 (2010).
- Renzi et al. (2012) R. D. Renzi, P. Bonf , M. Mazzani, S. Sanna, G. Prando, P. Carretta, R. Khasanov, A. Amato, H. Luetkens, M. Bendele, F. Bernardini, S. Massidda, A. Palenzona, M. Tropeano, and M. Vignolo, Supercond. Sci. Technol. 25, 084009 (2012).
- Materne et al. (2015) P. Materne, S. Kamusella, R. Sarkar, T. Goltz, J. Spehling, H. Maeter, L. Harnagea, S. Wurmehl, B. Büchner, H. Luetkens, C. Timm, and H.-H. Klauss, Phys. Rev. B 92, 134511 (2015).
- Goltz et al. (2014) T. Goltz, V. Zinth, D. Johrendt, H. Rosner, G. Pascua, H. Luetkens, P. Materne, and H.-H. Klauss, Phys. Rev. B 89, 144511 (2014).
- Prando et al. (2013) G. Prando, O. Vakaliuk, S. Sanna, G. Lamura, T. Shiroka, P. Bonfà, P. Carretta, R. De Renzi, H.-H. Klauss, C. G. F. Blum, S. Wurmehl, C. Hess, and B. Büchner, Phys. Rev. B 87, 174519 (2013).
- Ricci et al. (2010) A. Ricci, N. Poccia, B. Joseph, L. Barba, G. Arrighetti, G. Ciasca, J.-Q. Yan, R. W. McCallum, T. A. Lograsso, N. D. Zhigadlo, J. Karpinski, and A. Bianconi, Phys. Rev. B 82, 144507 (2010).
- Kobayashi et al. (2016) K. Kobayashi, J.-i. Yamaura, S. Iimura, S. Maki, H. Sagayama, R. Kumai, Y. Murakami, H. Takahashi, S. Matsuishi, and H. Hosono, Sci. Rep. 6, 39646 (2016).
- Mirbt et al. (2003) S. Mirbt, B. Sanyal, C. Isheden, and B. Johansson, Phys. Rev. B 67, 155421 (2003).
- McQueen et al. (2008) T. M. McQueen, M. Regulacio, A. J. Williams, Q. Huang, J. W. Lynn, Y. S. Hor, D. V. West, M. A. Green, and R. J. Cava, Phys. Rev. B 78, 024521 (2008).
- Wu et al. (2008) J. Wu, P. Phillips, and A. H. Castro Neto, Phys. Rev. Lett. 101, 126401 (2008).
- Opahle et al. (2009) I. Opahle, H. C. Kandpal, Y. Zhang, C. Gros, and R. Valentí, Phys. Rev. B 79, 024509 (2009).
- McElroy et al. (2013) C. A. McElroy, J. J. Hamlin, B. D. White, M. A. McGuire, B. C. Sales, and M. B. Maple, Phys. Rev. B 88, 134513 (2013).
- Jesche et al. (2012) A. Jesche, F. Nitsche, S. Probst, T. Doert, P. Müller, and M. Ruck, Phys. Rev. B 86, 134511 (2012).
- Raffius et al. (1993) H. Raffius, E. M rsen, B. Mosel, W. M ller-Warmuth, W. Jeitschko, L. Terb chte, and T. Vomhof, J. Phys. Chem. Solids 54, 135 (1993).
- Okada et al. (2008) H. Okada, K. Igawa, H. Takahashi, Y. Kamihara, M. Hirano, H. Hosono, K. Matsubayashi, and Y. Uwatoko, J. Phys. Soc. Jpn. 77, 113712 (2008).
- Qureshi et al. (2010) N. Qureshi, Y. Drees, J. Werner, S. Wurmehl, C. Hess, R. Klingeler, B. Büchner, M. T. Fernández-Díaz, and M. Braden, Phys. Rev. B 82, 184521 (2010).
- Nomura et al. (2008) T. Nomura, S. W. Kim, Y. Kamihara, M. Hirano, P. V. Sushko, K. Kato, M. Takata, A. L. Shluger, and H. Hosono, Supercond. Sci. Technol. 21, 125028 (2008).
- Andersen and Boeri (2011) O. Andersen and L. Boeri, Ann. Phys. 523, 8 (2011).
- Xu et al. (2008) C. Xu, M. Müller, and S. Sachdev, Phys. Rev. B 78, 020501 (2008).
- Kou et al. (2009) S.-P. Kou, T. Li, and Z.-Y. Weng, Europhys. Lett. 88, 17010 (2009).
- Nowik et al. (2008) I. Nowik, I. Felner, V. P. S. Awana, A. Vajpayee, and H. Kishan, J. Phys.: Condens. Matter 20, 292201 (2008).
- Grinenko et al. (2011) V. Grinenko, K. Kikoin, S.-L. Drechsler, G. Fuchs, K. Nenkov, S. Wurmehl, F. Hammerath, G. Lang, H.-J. Grafe, B. Holzapfel, J. van den Brink, B. Büchner, and L. Schultz, Phys. Rev. B 84, 134516 (2011).
- Fu et al. (2012) M. Fu, D. A. Torchetti, T. Imai, F. L. Ning, J.-Q. Yan, and A. S. Sefat, Phys. Rev. Lett. 109, 247001 (2012).
- Ok et al. (2018) J. M. Ok, S.-H. Baek, D. V. Efremov, R. Kappenberger, S. Aswartham, J. S. Kim, J. van den Brink, and B. Büchner, Phys. Rev. B 97, 180405 (2018).