Confirmation Of Two Galactic Supernova Remnant Candidates Discovered By THOR
Abstract
Anderson et al. (2017) identified seventy six candidate supernova remnants (SNRs) using data from The HI, OH, Recombination line survey of the Milky Way (THOR). The spectral index and polarization can help distinguish between SNRs and HIIregions, which are often confused. We confirm SNR candidates using spectral index data and morphology. However, we observe that the fractional linear polarization cannot distinguish between SNRs and HIIregions, . We also comment on the association of SNR candidates with pulsars
1 Introduction
The list of nearly 300 Galactic Supernova Remnants (SNRs) compiled by 2014BASI...42...47G is thought to be incomplete because it was estimated that there must be upwards of 1000 SNRs in the Milky Way . Even including recent TeV -ray SNRs detected by the H.E.S.S. collaboration does not increase this number greatly (Gottschall, 2017). Though the lack of detections at radio and X-ray wavelengths supports the arguments of Yamakazi et al. (2006) that there could be several SNRs with no radio, optical, ultraviolet or X-ray emissions, Brogan et al. (2006) have shown that the deficiency is primarily due to the lack of sensitivity to observe low surface brightness SNRs and due to low angular resolution that prevents the detection of small angular size SNRs.
Galactic SNRs are routinely identified in radio wavelengths. The emission (or the lack of it) at different wavelengths depends on intrinsic factors such as the progenitor’s history and also on external conditions such as the properties of surrounding medium. HIIregions, which are bright at radio wavelengths due to thermal emission, are frequently confused with SNRs. SNRs have a significantly smaller ratio of flux at Mid Infrared (MIR) wavelengths to flux at radio wavelengths than HIIregions . This feature led to the proposal of 76 candidate SNRs by Anderson et al. (2017) who have used radio continuum data from The HI, OH, Recombination line survey of the Milky Way (THOR; Beuther et al., 2016) and the Karl G. Jansky Very Large Array (VLA) 1.4 GHz Galactic Plane Survey (VGPS; Stil et al., 2006), and MIR wavelength data from Spitzer GLIMPSE, Spitzer MIPSGAL and WISE surveys.
We propose to confirm the by measuring the fractional linear polarization and spectral index of the total emission. We known SNRs and known HIIregions in the THOR survey region ( 1.25°, 17.5° 67.4°; Beuther et al., 2016, see) The list of known HIIregions was taken from The WISE Catalog of Galactic HIIregions (Anderson et al., 2014) through an interactive website (Anderson, 2014). We leave out candidate HIIregions and use only known HIIregions with sizes greater than , so that the comparison with known and candidate SNRs is appropriate.
Pulsars near the SNR candidates with associations to high energy sources could The Australia Telescope National Facility (ATNF) pulsar catalog (Manchester et al., 2005) provides the list of pulsars and their association with other sources.
HIIregions are expected to have no linearly polarized emission at radio wavelengths because their emission is thermal. They have flat radio spectra ()111Spectral index is defined by , for a flux density and a frequency for optically thin and for optically thick regions.
On the other hand, SNRs are strong synchrotron sources, which are highly linearly polarized. For synchrotron emission in a uniform magnetic field, fractional linear polarization is related to the spectral index by (Wilson et al., 2013):
| (1) |
Synchrotron emission usually has , so we expect fractional linear polarizations of above 0.6. However, we rarely observe . This is due to the Faraday depolarization effect (Fletcher & Shukurov, 2007). Varying rotation measure within the resolution element causes different Faraday rotations of the polarization vector, leading to reduced polarization fraction being observed. As the polarization data from THOR is not fully processed yet (Beuther et al., 2016), we use the polarization data from the 1.4 GHz Northern VLA Sky Survey (NVSS; Condon et al., 1998).
2 Data
2.1 List of known and candidate SNRs
The catalog by Green (2017) contains the list of all SNRs confirmed until 2016 along with their angular sizes. Of the 57 cataloged known SNRs in the THOR survey region, some SNRs are not visible in the 1.4 GHz THOR continuum data and some were classified as being HIIregions by Anderson et al. (2017). Such objects are excluded from calculations, leaving us with 49 known SNRs. The list of SNR candidates is taken in its entirety from the Anderson et al. (2017) paper. Anderson et al. (2017) have combined with VGPS data, which is called “THOR+VGPS”. . The THOR survey was taken by the VLA in C configuration, whereas VGPS was taken with the VLA in D configuration, and VGPS has single dish continuum data added from Effelsberg telescope (Stil et al., 2006).
2.2 Northern VLA Sky Survey (NVSS)
The NVSS covered entire sky north of declination at 1.4 GHz and its principal data products, maps of Stokes , and , are provided through a postage stamp server333https://www.cv.nrao.edu/nvss/postage.shtml (Condon et al., 1998). The compact D and DnC configurations of the VLA were used for the survey. Images were restored with a beam of . The largest angular scale detectable is about . The RMS noise for Stokes is 0.45 mJy beam-1 and for Stokes , it is 0.29 mJy beam-1. The noise in all Stokes maps can be higher in the Galactic plane by a factor of up to 1.5, depending on the observed region. We have measured the source integrated flux density by retaining only those pixels above 2.5 level. To calculate polarized flux density, we apply this 2.5 mask to the Stokes and maps, and only those pixels above a 3 level within this mask are retained. NVSS contains blank pixels in some regions due to inadequate coverage and poor sensitivity. Four known SNRs, three SNR candidates and 22 HIIregions contain a large portion of blank pixels, in either Stokes or Stokes & . These objects are omitted in our calculations.
2.3 TGSS-NVSS Spectral Index Map
We utilize the spectral index map444http://tgssadr.strw.leidenuniv.nl/doku.php?id=spidx#spectral_index_map created using 150 MHz TIFR GMRT Sky Survey (TGSS) and the 1.4 GHz NVSS, by de Gasperin et al. (2018). The TGSS covers all sky north of declination at 150 MHz with a resolution of . Intema et al. (2017) have made an alternative release of the data collected by the TGSS team. The survey provides Stokes images. The median RMS noise is 3.5 mJy beam-1. However, in the Galactic plane, the RMS noise can be as high as 10 mJy beam-1. For the TGSS, flux densities are well recoverable up to the order of a few arcminutes.
Similar to the NVSS, TGSS is solely interferometric data and lacks single dish data. Wezgowiec et al. (2016) have shown that for large structures (size ), , the use of these data together to measure spectral index is justified because the NVSS and TGSS have similar shortest baselines and they are two of the most sensitive centimeter and meter wavelength surveys with large sky coverage.
Though spectral indices can be derived from the THOR data between 1000 and 2000 MHz (Bihr et al., 2016), the TGSS-NVSS spectral indices span an even broader frequency range of a factor 10 between 150-1400 MHz. These should be better suited for spectral index maps of SNR candidates with angular sizes of several arcminutes. At these scales, the THOR data are affected by generally stronger spatial filtering than NVSS due to the more extended array configuration (VLA C-configuration).
2.4 List of known pulsars and their associations
The ATNF pulsar catalog contains all known spin-powered pulsars and magnetars but excludes accretion powered systems. The data is publicly available on the ATNF website555http://www.atnf.csiro.au/research/pulsar/psrcat/ (Manchester et al., 2005). The list also provides distances, frequencies and known associations of pulsars to , pulsar wind nebulae (PWNe), X-ray and gamma-ray sources where available.
3 Results and Discussion
For the three samples (HIIregions, known and candidate SNRs), we have measured linearly polarized flux density, total flux density and fractional linear polarization at 1.4 GHz from the NVSS, and the 150-1400 MHz spectral index. A significant number of HIIregions overlap with known and candidate SNRs. For instance, there are multiple bright HIIregions in the shell type SNRs G23.30.3 and G32.80.1. These introduce an uncertainty in both polarization and spectral index calculations. Unrelated sources such as Active Galactic Nuclei (AGN) also might affect the measurement of polarization and spectral index.
3.1 Spectral Index
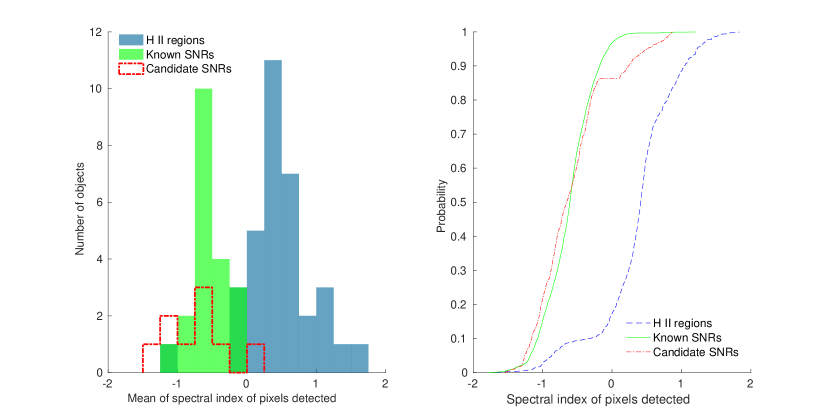
About 22% of known SNRs, 60% of SNR candidates and 78% of HIIregions are not detected in the TGSS.
Non-thermal spectral index from the shell can confirm the status of the candidates. Of the 76 candidates, only three have clear partial shell structure with their spectral indices determined unambiguously: G27.06+0.04, G51.21+0.11 and G53.41+0.03.
3.1.1 Candidate G27.06+0.04
3.1.2 Candidate G51.21+0.11
3.1.3 Candidate G53.41+0.03
Driessen et al. (2017) confirmed the status of candidate SNR G53.41+0.03 using observations from LOFAR and XMM-Newton. Our findings — matching partial shell shape in NVSS, TGSS and THOR data, and a non-thermal spectral index for the shell — agree with their .
3.1.4 Other candidates with non-thermal spectra
3.1.5 Candidates with lower limits on spectral index
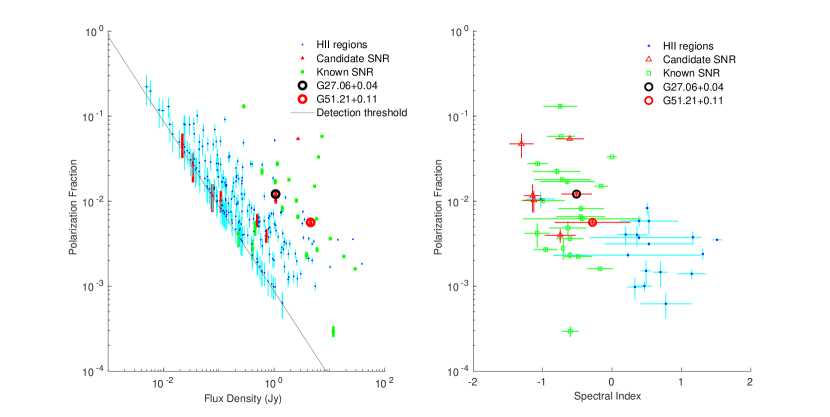
3.2 Polarization
3.3 Association with pulsars
4 Conclusions and Future Work
We have shown that the statistics of SNR candidates follows the sample of known SNRs more closely than that of HIIregions in spectral index and linear polarization. Compact sources and overlaps with known or candidate SNRs account for most of the steep negative spectra in HIIregions. There is only one HIIregion G050.31700.421 with an apparent non-thermal spectrum that needs to be explained.
Despite the above shortcomings, spectral index data, along with morphology, confirmed the status of G27.06+0.04 and G51.26+0.11 as SNRs.
References
- Anderson et al. (2017) Anderson, L. D., Wang, Y., Bihr, S., et al. 2017, A&A, 605, A58
- Anderson et al. (2014) Anderson, L. D., Bania, T. M., Balser, D. S., et al. 2014, ApJS, 212, A1
- Anderson (2014) Anderson, L. D., 2014, \aas, 223, id.312.01
- Benjamin et al. (2003) Benjamin, R. A., Churchwell, E., Babler, B. L., et al. 2003, PASP, 115, pp. 953-964
- Beuther et al. (2016) Beuther, H., Bihr, S., Rugel, M., et al. 2016, A&A, 595, A32
- Bihr et al. (2016) Bihr, S., Johnston, K. G., Beuther, H., et al. 2016, A&A, 588, A97
- Bonnarel et al. (2000) Bonnarel, F., Fernique, P., Bienaymé, O., et al. 2000, A&AS, 143, pp. 33
- Brogan et al. (2006) Brogan, C. L., Gelfand, J. D., Gaensler, B. M., et al. 2006, ApJ, 639, L25-L29
- Chatterjee et al. (2009) Chatterjee, S., Brisken, W. F., Vlemmings, W. H. T., et al. 2009, ApJ, 698, pp. 250-265
- Chatterjee et al. (2005) Chatterjee, S., Vlemmings, W. H. T., Brisken, W. F., et al. 2005, ApJ, 630, L61
- Cohen & Green (2001) Cohen, M. & Green, A. J., 2001, MNRAS, 325, pp. 531-544
- Condon et al. (1998) Condon, J. J., Cotton, W. D., Greisen E. W., et al. 1998, AJ, 115, pp. 1693
- de Gasperin et al. (2018) de Gasperin, F., Intema, H. T. & Frail, D. A., 2018, MNRAS, 474, p. 5008-5022
- Driessen et al. (2017) Driessen, L. N., Domček, V., Vink J., et al. 2017, eprint arXiv:1706.0608826
- Fletcher & Shukurov (2007) Fletcher, A. & Shukurov, A., 2007, EAS Publications Series, 23, pp. 109-128
- Green (2017) Green, D. A., 2017, VizieR Online Data Catalog: VII/278
- Gottschall (2017) Gottschall, D., Capasso, M., Deil, C., et al. 2017, AIP Conference Proceedings, 1792, 040030
- Intema et al. (2017) Intema, H. T., Jagannathan, P., Mooley, K. P. & Frail, D. A., 2017, A&A, 598, A78
- Lai (2000) Lai, D., 2000, Stellar Astrophysics, Proceedings of the Pacific Rim Conference, Hong Kong, 1999, ed. Cheng L. S., Chau H. F., Chan K. L., Leung K. C., Kluwer Academic Publishers, The Netherlands, p. 127
- Lu et al. (2001) Lu, F. J., Wang, Q. D., Aschenbach, B., et al. 2001, ApJ, 568, pp. L49-L52
- Manchester et al. (2005) Manchester, R. N., Hobbs, G. B., Teoh, A. & Hobbs, M., 2005, AJ, 129, pp. 1993-2006
- Nolan et al. (2012) Nolan, P. L., Abdo, A. A., Ackermann, M., et al. 2012, ApJS, 199, 31
- Prinz & Becker (2015) Prinz, T. & Becker, W., 2015, eprint arXiv:1511.07713
- Roberts et al. (2001) Roberts, M. S. E., Romani, R. W. & Kawai, N., 2001, ApJ, 133, pp. 451-465
- Stil et al. (2006) Stil, J. M., Taylor, A. R., Dickey, J. M., et al. 2006, AJ, 132, 1158
- Supan et al. (2018) Supán, L., Castelletti, G., Peters, W. M., Kassim, N. E., 2018, eprint arXiv:1806.07452
- Tammann et al. (1994) Tammann, G. A., Loeffler, W., & Schroeder, A., 1994, ApJS, 92, p. 487-493
- Wilson et al. (2013) Wilson, T. L., Rohlfs, K., & Huttemeister, S., 2013, Tools of Radio Astronomy, 6th edition. Springer-Verlag (Berlin)
- Wezgowiec et al. (2016) Wezgowiec, M., Jamrozy, M. & Mack, K.-H., 2016, Acta Astron., 66, p. 85-119
- Yamakazi et al. (2006) Yamazaki, R., Kohri, K., Bamba, A., et al. 2006, MNRAS, 371, pp. 1975-1982
- Yao et al. (2017) Yao, J. M., Manchester, R. N. & Wang, N., 2017, ApJ, 835, 29.