Shaping the spectrum of terahertz photoconductive antenna by frequency-dependent impedance modulation
Abstract
In this paper, we report on an approach for shaping the spectra of THz pulse generation in photoconductive antennas (PCAs) by frequency-dependent impedance modulation. We introduce a theoretical model describing the THz pulse generation in PCAs and accounting for impedances of the photoconductor and of the antenna. In order to showcase an impact of frequency-dependent impedance modulation on the spectra of THz pulse generation, we applied this model to simulating broadband PCAs with log-spiral topology. Finally, we fabricated two different log-spiral PCAs and characterized them experimentally using the THz pulsed spectroscopy. The observed results demonstrate excellent agreement between the theoretical model and experiment, justifying a potential of shaping the spectra of THz pulse generation in PCA by modulation of frequency-dependent impedances. This approach makes possible optimizing the PCA performance and thus accommodating the needs of THz pulsed spectroscopy and imaging in fundamental and applied branches of THz science and technologies.
Introduction
Since the first observations of terahertz (THz) radiation Rubens and Nichols (1897), it attracts considerable attention due to the specificity of THz wave – matter interaction: the THz dielectric response reveals low-energy molecular vibrations and structural features of the media Lee (2009). This allows to utilize THz spectroscopy and imaging for solving numerous fundamental and applied problems in condensed matter physics Ulbricht et al. (2011) and material science Stoik et al. (2008), gas sensing Jacobsen et al. (1996) and chemistry Zeitler et al. (2007), biology and medicine Yang et al. (2016). Despite considerable progress in THz technology, THz instruments remain rare and expensive; thus, stimulating the development of THz component base Popovic and Grossman (2011); Otsuji et al. (2012); Girard and Skorobogatiy (2014); Zaytsev et al. (2016); Chernomyrdin et al. (2017); Pham et al. (2017); Komandin et al. (2013); Ponomarev et al. (2018).
Major progress in THz technology is a result of seminal research on semiconductor photoconductivity by Auston Auston (1975) and is associated with the development of novel techniques for generation and coherent detection of sub-picosecond THz pulses Auston and Smith (1983), and related methods of THz pulsed spectroscopy van Exter et al. (1989) and imaging Hu and Nuss (1995).
During the past decades, numerous approaches for generation and detection of THz pulses with the use of femtosecond laser radiation have been developed,relying on various physical principles and exploiting novel materials Lee (2009). Here, we can broadly identify the following trends:
-
•
THz pulse generation and detection in accelerating charge carriers of semiconductors, such as low-temperature grown semiconductors (LT-GaAs or LT-InGaAs) and related heterostructures Verghese et al. (1997); Kostakis et al. (2012); Khusyainov et al. (2017), radiation-damaged semiconductors (GaAs or Si) Johnson et al. (1989), Tani et al. (1997), in ZnSe Ropagnol et al. (2014), GaAsBi Arlauskas et al. (2012), and others, using the photoconductivity Auston (1975), the photo-Dember effect Klatt et al. (2010) or the built-in electric field Hwang et al. (2007).
-
•
THz pulse generation and detection in nonlinear media, such as semiconductors (ZnTe, GaAs, GaP, InP, GaSe) Nagai et al. (2004), inorganic electrooptical crystals (LiNbO3, LiTaO3) Ilyakov et al. (2017); Hu et al. (1990), organic crystals Zhang et al. (1992), and VO2-films undergoing metal-insulator phase transition Esaulkov et al. (2015), using optical rectification Auston et al. (1972) and electrooptical effects Leitenstorfer et al. (1999).
- •
Among these principles of (and materials for) THz pulse generation and detection, the LT-GaAs and LT-InGaAs-based photoconductive antennas (PCAs) represent the most prevalent type of THz pulsed emitter and detector. They are widely applied in THz spectroscopy and imaging due to simplicity, flexibility and reliability of the PCAs’ design and their technical characteristics.
Nevertheless, a rapid progress in THz science and technology pushes further development of THz PCAs into a realm of improving the optical-to-THz conversion efficiency and optimizing the spectrum of THz pulse for different applications Castro-Camus and Alfaro (2016); Gregory et al. (2005); Yang et al. (2014); Brahm et al. (2014); Busch et al. (2014). Typically, a spectrum of THz pulse is modeling when a PCA’s impedance is frequency-independent and thus an influence of both antenna and photoconductor impedances on a spectrum shape is considered. In present article, in order to take into account this fact, we propose an approach for shaping a spectrum of THz pulse in broadband PCA by modulating its frequency-dependent impedance and improve correctness of a PCA’s numerical description.
To reveal an impact of frequency-dependent impedance modulation on the THz pulse spectrum, we proposed a theoretical model, which describes the THz generation in PCA and takes into account the impedances. Then, to showcase an impact of frequency-dependent impedance modulation on the THz pulse spectrum, this model is applied for studying the THz generation in two different broadband PCAs of the log-spiral topology. Finally, we fabricate these PCAs and characterize them experimentally: we use them as an emitter in a THz pulsed spectrometer to measure the spectra of THz pulse generation. By comparing the results of theoretical and experimental study, we demonstrate excellent agreement between the model and the experiment, justifying our approach for shaping the spectrum of THz pulsed generation in PCA by modulating frequency-dependent impedances of photoconductor and antenna. The results of this study open a new way to optimize the THz PCA performance for accommodating the needs of rapidly-developing THz science and technology, particularly, in condensed matter physics, material science, chemistry, biology and medicine.
I Modelling the THz pulse generation in PCA
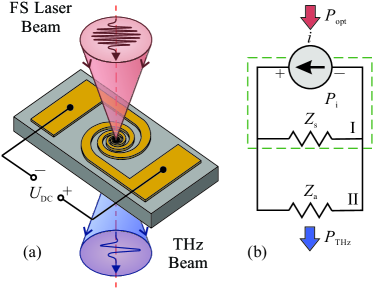
We start from modelling the process of THz pulsed generation in PCA and consider a low-temperature grown gallium arsenide (LT-GaAs) as a conventional material platform for PCA fabrication. As shown in Fig 1 (a), a femtosecond laser pulse irradiates the small area in the gap between electrodes in LT-GaAs photoconductor and results in generation of free carriers. A DC electric field, applied to the electrodes, drives the motion of these free carriers, resulting in the sub-picosecond-duration photocurrent and thus, the THz pulse generation. The transient process occurs not only in photoconductor but in entire PCA and is described by Maxwell equations with appropriate boundary condition on metal and photoconductor’s surface. Different antenna topology leads to different transient current distribution, traditionally characterized by antenna impedance value, that consequently results in spectral features of emitted THz waves.
Figure 1 (b) shows an equivalent circuit Khiabani et al. (2013); Berry and Jarrahi (2012), applied for the PCA modelling. According to the circuit, the photoconductive gap, illuminated by the femtosecond pulse, is considered as a source of photocurrent (see Fig. 1 (b), part I), for which we analytically calculate an internal effective resistance (i.e. a real part of an impedance ) and a photocurrent power in Fourier-domain (here, and stand for the time and the frequency). Then, the antenna impedance is estimated using numerical simulations, and the electromagnetic coupling between a photoconductor and antenna (i.e. impedance matching factor) is applied for estimating the emitted THz power spectrum (see Fig. 1 (b), part II). This modelling approach gives a non-self-consistent solution for the THz pulse generation problem: i.e. the photoconductive gap as a source of photocurrent and the log-spiral antenna arms (suppress certain frequency-domain modes and shapes the THz pulse spectrum) as an external resistive load, are considered separately.
I.1 Modelling the PCA Photocurrent
In order to calculate the internal impedance and the power spectrum of the current source, we introduce a model of the time-dependent photocurrent of the PCA in case of its irradiation with the ultra-short laser pulses.
Consider the PCA gap illuminated by the femtosecond laser pulse with the Gaussian profile of instantaneous intensityZaytsev et al. (2014)
| (1) |
where is an average laser power, is a fraction of laser power which is absorbed in photoconductor, is a pulse repetition rate, and define a duration of the Gaussian pulse either as a parameter of the Gaussian function or as a full-width at half-maximum (FWHM). Assuming the uniform character of the antenna gap irradiation, the carrier transport in photoconductor can be described in the framework of 1D-Drude-Lorentz model Lee (2009) with a cross-section area . Since the effective mass of electrons in LT-GaAs is much smaller than that of holes, the electrons are considered as dominant charge carriers. We use the following expression for the time-dependent non-equilibrium concentration of electrons in the PCA’s gap , i.e. a response on the excitation by the electromagnetic wave featuring the Dirac-function-like instantaneous intensity with energy Lee (2009)
| (2) |
where is a carrier lifetime (), is a length of the illuminated gap, Joulesec is the Planck constant, m/sec is the speed of light in free space, is a central wavelength of the femtosecond laser radiation, and are refractive index and absorption coefficient for LT-GaAs layer (of thickness ) respectively.
In our consideration, the electron density under illumination satisfies the condition , where stands for a plasma frequency, is an electron momentum relaxation time (), and are the dielectric constant of the medium and the electron effective mass, respectively. This condition allows to neglect the screening of the external bias electric field , which originates from separation of electron-hole pairs Uhd Jepsen et al. (1996). We assume the average electron velocity according to the following equation Lee (2009)
| (3) |
where is an electron mobility.
The photocurrent can be expressed as a convolution of the instantaneous intensity of laser pulse (Eq. 1) with the responses to the electron concentration (Eq. 2) and with the electron velocity (Eq. 3) Duvillaret et al. (2001):
| (4) |
where C is the elementary charge. Integration of (4) leads to the analytical expression for the photocurrent
| (5) |
where
| (6) |
and stands for the bias voltage
| (7) |
![[Uncaptioned image]](/html/1808.06592/assets/x2.png)
From Eq. (5), we observe that the gap resistance has a time-dependent character. However, for simplicity, we introduce an effective resistance of the photoconductive gap
| (8) |
and the Fourier-domain power of the photocurrent
| (9) |
where
| (10) |
stands for the Fourier spectrum of the photocurrent.
We computed the performance of the LT-GaAs PCA using the described model Eqs. (1)–(10). In these computations, we used the technical characteristics of the Toptica FemtoFErb780 laser, as a source of the THz pulses, and the parameters of the LT-GaAs according to the Refs. Lee (2009); Khiabani et al. (2013); Nĕmec et al. (2001) (see Tab. 1). The results of the PCA photocurrent modelling are shown in Figure 2 where one can see the normalized instantaneous intensity of the femtosecond laser pulse irradiating the antenna gap and the time-domain normalized photocurrent (a), the normalized power spectrum of the photocurrent (b). According to the Eq. (8), we determined the effective resistance of the photoconductor gap .
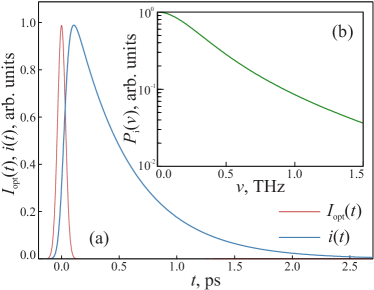
From the Fig. 2, one can see that the observed photocurrent has a form of the non-symmetric pulse, the peak of which is slightly delayed relative to the peak of the femtosecond excitation and the duration of which is predominantly determined by the longest time scale – i.e the lifetime of the LT-GaAs photocarriers ps. The photocurrent power spectrum decays with an increase of electromagnetic frequency , and possesses no remarkable spectral features. Thereby, the modelling of the photocurrent allows for determining main parameters of the current source in the equivalent circuit (see Fig. 1 (b)), which forms the basis for its further analysis.
I.2 Accounting the PCA Topology
An essential feature of the log-spiral PCA is a broadband spectrum of generated THz pulse appeared as a result of the absence of the cut-off frequency, which is usually defined by antenna arms. In such extended topology there is a non-uniform transient current distribution on arms’ surface. Thereby for each of the emitted THz wavelength the active area of the PCA is given by a number of the spiral turns, with length of the last turn close to this wavelength Preu et al. (2011); Balanis (2005): (where and are the electromagnetic wavelength in the free space and in LT-GaAs, respectively, and is the effective real part of the dielectric permittivity of LT-GaAs to account for the operation at the semiconductor-air interface).
The log-spiral arms are characterized by their own impedance (see Fig. 1) – a complex frequency-dependent function , comprised of a real (a radiation resistance ) and an imaginary (a reactance ) parts Berry and Jarrahi (2012); Khiabani et al. (2013). In order to provide an efficient conversion of the photocurrent power to the THz beam power, the antenna impedance should be matched with the impedance of the current source (see Fig. 1), which, in general case, is also represented by the complex frequency-dependent function . Mismatching of these impedances leads to weakening of electromagnetic coupling between photoconductor and antenna, i.e. reflection of the current oscillations’ power from antenna metallization, and a consequent reduction both a PCA’s photocurrent and optical-to-THz conversion efficiency. Ezdi et al. (2006):
| (11) |
where stands for the THz-wave power and is a parameter accounting the electromagnetic coupling efficiency.
The impedance of the photocurrent source involves the above mentioned internal ohmic resistance and reactance of a capacitor , which accounts for accumulation of the charge carrier in the illuminated antenna gap as well as the screening effects. The applied external electric field causes a separation of the photoexcited electrons and holes. Being separated, these charges produce their own counter-directed screening electric field Kim and Citrin (2006), that leads to screening and restricts the current oscillations Preu et al. (2011); Khiabani et al. (2013). However, due to the applied simplified Drude model (Eq. (2)), which excludes the dynamics of the holes, the screening and the reactive part of the photocurrent source impedance are neglected – i.e. and .
The impedance of the ideal infinite self-complementary log-spiral antenna on the semi-infinite LT-GaAs Preu et al. (2011) comprised of the valuable real and negligible imaginary parts: . This fact dissatisfies the condition of impedance matching and thus decreases the THz wave generation power. However, the frequency-dependent impedance of real log-spiral PCA can be varied near it’s theoretical value by altering the antenna topology, which results in opportunity for modulating an emitted THz spectrum (i.e. spectrum shaping) by altering the value. It should be noted that the proposed approach does not contradict with the well-known far-field dipole-generation formalism Lee (2009); Uhd Jepsen et al. (1996) but extends it to the case of PCA with extended arms which is possessing essentially a non-uniform surface photocurrent distribution. This is of particular importance when considering broadband PCAs.
We consider two PCAs with different topology with the edges formed by the four self-complementary log-spirals
| (12) |
where is an expansion rate and is an arm thickness parameter – see Tab. 2. In order to perform adequate comparison of the antennas, all the PCAs have the gap length of m.
![[Uncaptioned image]](/html/1808.06592/assets/x4.png)
In order to estimate the impedance of these antennas, we performed numerical simulations using the finite integration technique (FIT) – a convenient method of solving the Maxwell’s equations Weiland (1996). An important feature of FIT is a possibility of the local mesh refinement in the areas of either the strong field variations or the tiny topological elements of the antenna. The antenna excitation is simulated by applying the common Gaussian-shaped time-dependent signal close to the gap. For the PCAs featuring the described topology (see Tab. 2), the thickness of m, and the infinitely-high conductivity (perfect electric conductor), we examine the complex currents and voltages originating in the PCAs, as a result of this excitation.
We assume the antenna’s electrodes to be deposited on the surface of the semi-infinite LT-GaAs, which possesses the dielectric permittivity of (Tab. 1) and negligible dynamic conductivity. The dimensions of the simulations volume are mm3 – they include only the interface of the semiconductor with the antenna electrodes. In order to prevent a non-physical backscattering of the electromagnetic waves from the boundaries of the simulations space, the latter is surrounded by perfectly matched layers. In simulations we use the 3D tetrahedral mesh with grid sizes in the range of to m.
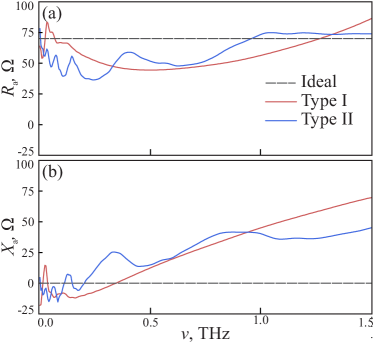
Results of the numerical simulations for the two antenna topologies (see Tab. 2) are demonstrated in Fig. 3: (a) and (b) show the radiation resistances and reactances , respectively. At high frequencies, we limit the spectral range of numerical simulations by THz, since, for the equal physical size of the simulation volume, the numerical modelling at higher frequencies requires lower spatial grid size and larger size of the mesh, which significantly increases the length of calculations. From the Fig. 3, we could notice that the radiation resistance varies near (primarily, below) the radiation resistance of the ideal log-spiral antenna , shown by the dashed line, while the reactance features non-zero value (predominantly, positive) and increases with frequency . It is important to note that the simulated PCAs demonstrate quite different behavior in their frequency-dependent impedances.
II Experimental Characterization of PCAs
In order to test the results of theoretical modelling, as well as to justify the impact of the frequency-dependent impedance modulation on the THz pulse spectrum, we fabricated the LT-GaAs log-spiral PCAs (both Type I and II) and experimentally characterized the THz pulse generation using LT-GaAs log-spiral PCAs as emitters in a THz pulse spectrometer.
II.1 Fabrication of PCAs
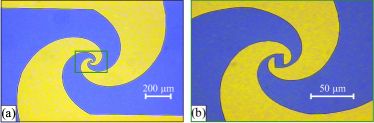
First, the -m-thick photoconductive LT-GaAs layer was grown by the molecular-beam epitaxy at the temperature of C, which was followed by the in situ annealing at the temperature of C during min Ponomarev et al. (2017a). Second, the log-spiral antennas were formed on the surface of the LT-GaAs using the contact UV-photolithography with the LOR5A-S1813 resist, which is prepared in the tetramethylammonium hydroxide solution in the absence of metal ions. An oxygen plasma was used to remove residual resist, and GaAs oxides are removed in the aqueous solution of the hydrochloric acid. Finally, the antennas topology is formed by the Ti-Pt-Au (–– nm) metallization lift-off. All the technological aspects of the LT-GaAs PCA manufacturing are described in details in Ref. Ponomarev et al. (2017b), while the microscopic images of the PCA Type I are shown in Fig. 4.
II.2 Experimental Setup
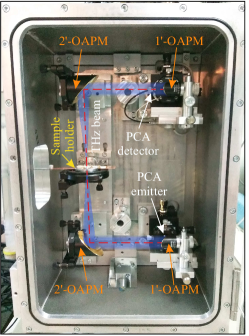
For the experimental measurements, we use an original THz pulsed spectrometer developed in A.M. Prokhorov GPI RAS (see Fig. 5). As a source and a detector of the THz pulses, one of the fabricated LT-GaAs PCAs (see Tab. 2), and the commercially-available LT-GaAs PCAs from Fraunhofer IPM were used. The antenna-emitter is biased by the oscillating voltage featuring the rectangular time-domain profile, the amplitude of V, and the modulation frequency of kHz. The current of the antenna-detector is demodulated at the same frequency in order to improve the signal-to-noise ratio. To pump the antenna-emitter and probe the antenna-detector, we utilized femtosecond laser pulses of the compact all-fiber-based Toptica FemtoFErb780 laser (see Tab. 1 for the the duration and the repetition rate of the femtosecond pulses).
The intensities of the pump and probe beams radiating the PCAs were around mW, and the delay between the pumped and probed beams was varied using the mechanical linear motorized delay stage (Physics Instruments LMS) featuring the maximal scanning range of 65 mm and the positioning accuracy of 0.015 m. In a standard configuration with the commercially available LT-GaAs antennas, this THz pulsed spectrometer yields measurements in the spectral range of to THz with the best spectral resolution of 0.005 THz, and the time-domain dynamic range of 75 dB. This setup yields measurements in vacuum and at cryogenic temperatures. However, for examining the LT-GaAs PCA performance, we limited ourselves to the THz measurements in non-dried room air and at room temperature.
During the experimental measurements of the fabricated LT-GaAs PCAs, all parts of the experimental setup besides the antenna-emitter are rigidly fixed (the plano-convex lens, employed for collimation of the THz beam from the antenna-emitter and mounted separately from the LT-GaAs). Each of the original antenna-emitters were inserted into the experimental setup, equally biased by the electric voltage, and aligned in order to achieve the maximal amplitude of the THz waveform.
II.3 Experimental Results and Their Comparison with Theory
Results of the modelling and THz measurements of the PCAs are illustrated in Fig. 6: (a) and (c) demonstrate the THz power spectra , (where is the amplitude Fourier spectra of the waveforms); while (b) shows the THz waveforms , generated by the fabricated PCAs and detected by the commercial one. The observed numerous vertical lines are associated with the resonant THz absorption by water vapor along the beam path; however, these lines do not prevent analysis and comparison of the THz power spectra of the PCAs. During waveform detection we use the time-domain step of fs, the window size of ps (provides the frequency domain resolution of about THz), and the integration time of s for the both measured PCAs.
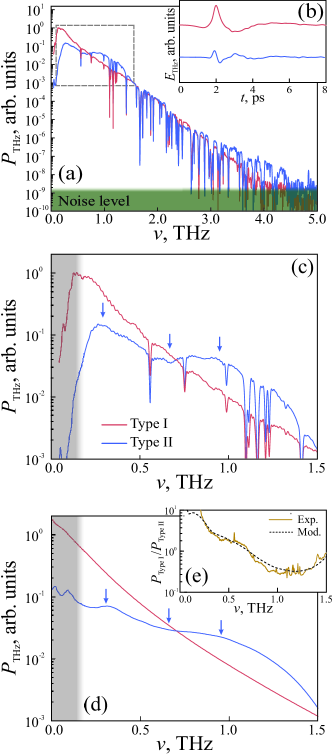
From Fig. 6 (b) and (c), we could observe a complex behaviour of the THz waveform and spectrum generated by the PCA Type II. Particularly, the THz pulse emitted by this antenna is dispersed stronger and features two maxima around – ps, while for the PCA Type I we do not observe any waveform features. Furthermore, the PCA Type II demonstrates a modulated spectral character with two local peaks, centered at around and 0.95 THz, and a dip, centered at around THz (these are indicated by arrows in Fig. 6 (c) and (d)). In contrast, the PCA Type I shows monotonically decreasing power spectrum, which crosses the curve of the PCA Type II at around THz.
The simulated power spectra of the PCAs are presented in Fig 6 (d). One can see that PCA Type II demonstrates two local maxima and one minimum (indicated by arrows) quite similar to the experimental curve, and PCA Type I shows decreasing power spectra analogous to the experimental one. We note that the experimental low-frequency region (shadowed in (c), (d)) includes diffraction losses which are not considered in the numerical calculations, hence it is excluded from the comparison.
We should also point out that only a physical process of the THz wave-emission in PCA is considered in the numerical model, while the experimental data account for the spectral power of emitter and the spectral sensitivity of detector. Nevertheless, we can compare the numerical and experimental results qualitatively. For this purpose, we estimated ratios between the THz power spectra of the PCA Type I and Type II for both the numerical and experimental data. The corresponding curves are shown in Fig. 6 (e) and demonstrate excellent agreement between the experiment and the theory. Since the power spectra of the photocurrent in Fig. 2 (b) has a monotonically-decreasing character and do not possesses any resonant spectral features, we conclude that the modulation of the THz power spectra in Fig. 6 (c) and (d) , is caused by the frequency-dependent character of the antenna impedance observed in Fig. 3, and by changing the coupling efficiency parameter (Eq.(11)).
The observed impact of the antenna impedance modulation on the THz pulse generation in PCA opens an alternative way for optimizing the THz PCA performance, in particular, for shaping the spectrum of THz pulse generation by managing the parameters and geometry of the electrodes and of the photoconductor. Modern semiconductor technologies together with technologically reliable semiconductors, such as GaAs, InGaAs and others, form a promising fabrication and material platform for solving the problems of the PCA optimization and the impedance matching. In this paper, we showcase an impact of the impedance modulation on the THz pulse generation in the particular log-spiral configurations of PCA. The in-depth analysis and optimization of the THz pulse generation in PCAs of different type is the subject of additional comprehensive studies. Such studies are beyond the scope of this paper and would be considered in our future research work.
III Conclusions
In this paper we predicted theoretically and justified experimentally an approach for shaping the spectra of the THz pulsed generation in PCA by the frequency-dependent modulation of antenna impedance. The results of our study demonstrated excellent correlation between the calculated and measured THz power spectra of PCAs. Despite considering log-spiral PCAs based on the LT-GaAs to showcase a potential of the proposed approach, it could also be applied to other types of photoconductors (i.e. exploiting different materials and laser pump Verghese et al. (1997); Kostakis et al. (2012); Khusyainov et al. (2017); Johnson et al. (1989); Tani et al. (1997); Ropagnol et al. (2014); Arlauskas et al. (2012); Auston (1975); Klatt et al. (2010); Hwang et al. (2007)) and other antenna topology Balanis (2005), as well as for modelling of the continuous-wave THz generation in PCA Gregory et al. (2005). The proposed approach for shaping the THz pulse spectrum can be used for a broad range of THz technology applications in condensed matter physics Ulbricht et al. (2011) and material science Stoik et al. (2008), gas sensing Jacobsen et al. (1996) and chemistry Zeitler et al. (2007), biology and medicine Yang et al. (2016). Finally, we would like to stress that the considered impedance modulation approach might be useful for optimizing the performance of the PCA-detector, in particular, for broadening and managing the frequency-dependent sensitivity of PCA-detector Preu et al. (2011).
Acknowledgements
Numerical modelling and fabrication of THz PCAs were supported by the Russian Scientific Foundation (RSF), Project # 18-79-10195. Experimental characterization of the THz PCAs was supported by RIEC ICRP (grant H30/A04). The authors are also grateful to S.S. Pushkarev for fabrication of the UV-lithography masks.
References
- Rubens and Nichols (1897) H. Rubens and E. Nichols, Physical Review (Series I) 4, 314 (1897), URL https://link.aps.org/doi/10.1103/PhysRevSeriesI.4.314.
- Lee (2009) Y.-S. Lee, Principles of Terahertz Science and Technology (Springer, New York, NY, USA, 2009), URL http://www.springer.com/engineering/electronics/book/978-0-387-09539-4.
- Ulbricht et al. (2011) R. Ulbricht, E. Hendry, J. Shan, T. Heinz, and M. Bonn, Reviews of Modern Physics 83, 543 (2011), URL https://link.aps.org/doi/10.1103/RevModPhys.83.543.
- Stoik et al. (2008) C. Stoik, M. Bohn, and J. Blackshire, Optics Express 16, 17039 (2008), URL http://www.opticsexpress.org/abstract.cfm?URI=oe-16-21-17039.
- Jacobsen et al. (1996) R. Jacobsen, D. Mittleman, and M. Nuss, Optics Letters 21, 2011 (1996), URL https://www.osapublishing.org/ol/abstract.cfm?uri=ol-21-24-2011.
- Zeitler et al. (2007) J. Zeitler, P. Taday, D. Newnham, M. Pepper, K. Gordon, and T. Rades, Journal of Pharmacy and Pharmacology 59, 209 (2007), URL http://dx.doi.org/10.1211/jpp.59.2.0008.
- Yang et al. (2016) X. Yang, X. Zhao, K. Yang, Y. Liu, Y. Liu, W. Fu, and Y. Luo, Trends in Biotechnology 34, 810 (2016), URL http://www.sciencedirect.com/science/article/pii/S0167779916300270.
- Popovic and Grossman (2011) Z. Popovic and E. N. Grossman, IEEE Transactions on Terahertz Science and Technology 1, 133 (2011), URL http://ieeexplore.ieee.org/abstract/document/6005340/.
- Otsuji et al. (2012) T. Otsuji, S. A. B. Tombet, A. Satou, H. Fukidome, M. Suemitsu, E. Sano, V. Popov, M. Ryzhii, and V. Ryzhii, Journal of Physics D: Applied Physics 45, 303001 (2012), URL https://doi.org/10.1088/0022-3727/45/30/303001.
- Girard and Skorobogatiy (2014) M. Girard and M. Skorobogatiy, Journal of Optics 16, 094007 (2014), URL https://doi.org/10.1088/2040-8978/16/9/094007.
- Zaytsev et al. (2016) K. Zaytsev, G. Katyba, V. Kurlov, I. Shikunova, V. Karasik, and S. Yurchenko, IEEE Transactions on Terahertz Science and Technology 6, 576 (2016), URL http://ieeexplore.ieee.org/document/7471527/.
- Chernomyrdin et al. (2017) N. Chernomyrdin, A. Schadko, S. Lebedev, V. Tolstoguzov, V. Kurlov, I. Reshetov, I. Spektor, M. Skorobogatiy, S. Yurchenko, and K. I. Zaytsev, Applied Physics Letters 110, 221109 (2017), URL http://dx.doi.org/10.1063/1.4984952.
- Pham et al. (2017) H. Pham, S. Hisatake, O. Minin, T. Nagatsuma, and I. Minin, APL Photonics 2, 056106 (2017), URL http://dx.doi.org/10.1063/1.4983114.
- Komandin et al. (2013) G. A. Komandin, S. V. Chuchupal, S. P. Lebedev, Y. G. Goncharov, A. F. Korolev, O. E. Porodinkov, I. E. Spektor, and A. A. Volkov, IEEE Transactions on Terahertz Science and Technology 3, 440 (2013), ISSN 2156-342X, URL https://doi.org/10.1109/TTHZ.2013.2255914.
- Ponomarev et al. (2018) D. S. Ponomarev, D. V. Lavrukhin, A. E. Yachmenev, R. A. Khabibullin, I. E. Semenikhin, V. V. Vyurkov, M. Ryzhii, T. Otsuji, and V. Ryzhii, Journal of Physics D: Applied Physics 51, 135101 (2018), URL http://stacks.iop.org/0022-3727/51/i=13/a=135101.
- Auston (1975) D. Auston, Applied Physics Letters 26, 101 (1975), URL http://dx.doi.org/10.1063/1.88079.
- Auston and Smith (1983) D. Auston and P. Smith, Applied Physics Letters 43, 631 (1983), URL http://dx.doi.org/10.1063/1.94468.
- van Exter et al. (1989) M. van Exter, C. Fattinger, and D. Grischkowsky, Applied Physics Letters 55, 337 (1989), URL http://dx.doi.org/10.1063/1.101901.
- Hu and Nuss (1995) B. Hu and M. Nuss, Optics Letters 20, 1716 (1995), URL http://ol.osa.org/abstract.cfm?URI=ol-20-16-1716.
- Verghese et al. (1997) S. Verghese, K. McIntosh, and E. Brown, Applied Physics Letters 71, 2743 (1997), URL http://dx.doi.org/10.1063/1.120445.
- Kostakis et al. (2012) I. Kostakis, D. Saeedkia, and M. Missous, IEEE Transactions on Terahertz Science and Technology 2, 617 (2012), URL http://ieeexplore.ieee.org/abstract/document/6324408/.
- Khusyainov et al. (2017) D. Khusyainov, A. Buryakov, V. Bilyk, E. Mishina, D. Ponomarev, R. Khabibullin, and A. Yachmenev, Technical Physics Letters 43, 1020 (2017), URL https://doi.org/10.1134/S1063785017110220.
- Johnson et al. (1989) M. Johnson, T. McGill, and N. Paulter, Applied Physics Letters 54, 2424 (1989), URL http://dx.doi.org/10.1063/1.101096.
- Tani et al. (1997) M. Tani, S. Matsuura, K. Sakai, and S. ichi Nakashima, Applied Optics 36, 7853 (1997), URL http://ao.osa.org/abstract.cfm?URI=ao-36-30-7853.
- Ropagnol et al. (2014) X. Ropagnol, M. Bouvier, M. Reid, and T. Ozaki, Journal of Applied Physics 116, 043107 (2014), URL http://adsabs.harvard.edu/abs/2014JAP...116d3107R.
- Arlauskas et al. (2012) A. Arlauskas, P. Svidovsky, K. Bertulis, R. Adomavicus, and A. Krotkus, Applied Physics Express 5, 022601 (2012), URL http://stacks.iop.org/1882-0786/5/i=2/a=022601.
- Klatt et al. (2010) G. Klatt, F. Hilser, W. Qiao, M. Beck, R. Gebs, A. Bartels, K. Huska, U. Lemmer, G. Bastian, M. Johnston, et al., Optics Express 18, 4939 (2010), URL http://www.opticsexpress.org/abstract.cfm?URI=oe-18-5-4939.
- Hwang et al. (2007) J.-S. Hwang, H.-C. Lin, C.-K. Chang, T.-S. Wang, L.-S. Chang, J.-I. Chyi, W.-S. Liu, S.-H. Chen, H.-H. Lin, and P.-W. Liu, Optics Express 15, 5120 (2007), URL http://www.opticsexpress.org/abstract.cfm?URI=oe-15-8-5120.
- Nagai et al. (2004) M. Nagai, K. Tanaka, H. Ohtake, T. Bessho, T. Sugiura, T. Hirosumi, and M. Yoshida, Applied Physics Letters 85, 3974 (2004), URL http://dx.doi.org/10.1063/1.1813645.
- Ilyakov et al. (2017) I. Ilyakov, G. Kitaeva, B. Shishkin, and R. Akhmedzhanov, Optics Letters 42, 1704 (2017), URL http://ol.osa.org/abstract.cfm?URI=ol-42-9-1704.
- Hu et al. (1990) B. Hu, X.-C. Zhang, D. Auston, and P. Smith, Applied Physics Letters 56, 506 (1990), URL http://dx.doi.org/10.1063/1.103299.
- Zhang et al. (1992) X.-C. Zhang, X. Ma, Y. Jin, T.-M. Lu, E. Boden, P. Phelps, K. Stewart, and C. Yakymyshyn, Applied Physics Letters 61, 3080 (1992), URL http://dx.doi.org/10.1063/1.107968.
- Esaulkov et al. (2015) M. Esaulkov, P. Solyankin, A. Sidorov, L. Parshina, A. Makarevich, Q. Jin, Q. Luo, O. Novodvorsky, A. Kaul, E. Cherepetskaya, et al., Optica 2, 790 (2015), URL http://www.osapublishing.org/optica/abstract.cfm?URI=optica-2-9-790.
- Auston et al. (1972) D. Auston, A. Glass, and A. Ballman, Physical Review Letters 28, 897 (1972), URL https://link.aps.org/doi/10.1103/PhysRevLett.28.897.
- Leitenstorfer et al. (1999) A. Leitenstorfer, S. Hunsche, J. Shah, M. Nuss, and W. Knox, Applied Physics Letters 74, 1516 (1999), URL http://dx.doi.org/10.1063/1.123601.
- Hamster et al. (1993) H. Hamster, A. Sullivan, S. Gordon, W. White, and R. Falcone, Physical Review Letters 71, 2725 (1993), URL https://link.aps.org/doi/10.1103/PhysRevLett.71.2725.
- Xie et al. (2006) X. Xie, J. Dai, and X.-C. Zhang, Physical Review Letters 96, 075005 (2006), URL https://link.aps.org/doi/10.1103/PhysRevLett.96.075005.
- Borodin et al. (2013) A. Borodin, N. Panov, O. Kosareva, V. Andreeva, M. Esaulkov, V. Makarov, A. Shkurinov, S. Chin, and X.-C. Zhang, Optics Letters 38, 1906 (2013), URL http://ol.osa.org/abstract.cfm?URI=ol-38-11-1906.
- Castro-Camus and Alfaro (2016) E. Castro-Camus and M. Alfaro, Photonics Research 4, A36 (2016), URL http://www.osapublishing.org/prj/abstract.cfm?URI=prj-4-3-A36.
- Gregory et al. (2005) I. Gregory, C. Baker, W. Tribe, I. Bradley, M. Evans, E. Linfield, A. Davies, and M. Missous, IEEE Journal of Quantum Electronics 41, 717 (2005), URL http://ieeexplore.ieee.org/document/1424257/.
- Yang et al. (2014) S. Yang, M. Hashemi, C. Berry, and M. Jarrahi, IEEE Transactions on Terahertz Science and Technology 4, 575 (2014), URL http://ieeexplore.ieee.org/document/6872601/.
- Brahm et al. (2014) A. Brahm, A. Wilms, R. Dietz, T. Gobel, M. Schell, G. Notni, and A. Tunnermann, Optics Express 22, 12982 (2014), URL http://www.opticsexpress.org/abstract.cfm?URI=oe-22-11-12982.
- Busch et al. (2014) S. Busch, T. Probst, M. Schwerdtfeger, R. Dietz, J. Palaci, and M. Koch, Optics Express 22, 16841 (2014), URL http://www.opticsexpress.org/abstract.cfm?URI=oe-22-14-16841.
- Khiabani et al. (2013) N. Khiabani, Y. Huang, Y. Shen, and S. Boyes, IEEE Transactions on Antennas and Propagation 61, 1538 (2013), URL http://ieeexplore.ieee.org/document/6409989/.
- Berry and Jarrahi (2012) C. Berry and M. Jarrahi, Journal of Infrared, Millimeter, and Terahertz Waves 33, 1182 (2012), URL https://doi.org/10.1007/s10762-012-9937-3.
- Zaytsev et al. (2014) K. Zaytsev, A. Gavdush, V. Karasik, V. Alekhnovich, P. Nosov, V. Lazarev, I. Reshetov, and S. Yurchenko, Journal of Applied Physics 115, 193105 (2014), URL https://doi.org/10.1063/1.4876324.
- Uhd Jepsen et al. (1996) P. Uhd Jepsen, R. Jacobsen, and S. Keiding, Journal of the Optical Society of America B 13, 2424 (1996), URL http://josab.osa.org/abstract.cfm?URI=josab-13-11-2424.
- Duvillaret et al. (2001) L. Duvillaret, F. Garet, J. Roux, and J. Coutaz, IEEE Journal of Selected Topics in Quantum Electronics 7, 615 (2001), URL http://ieeexplore.ieee.org/document/974233/.
- Nĕmec et al. (2001) H. Nĕmec, A. Pashkin, P. Kužel, M. Khazan, S. Schnüll, and I. Wilke, Journal of Applied Physics 90, 1303 (2001), URL https://doi.org/10.1063/1.1380414.
- Preu et al. (2011) S. Preu, G. Dohler, S. Malzer, L. Wang, and A. Gossard, Journal of Applied Physics 109, 061301 (2011), URL http://dx.doi.org/10.1063/1.3552291.
- Balanis (2005) C. A. Balanis, Antenna Theory: Analysis and Design, 3rd edition (Wiley-Blackwell, 2005), ISBN 9788126524228.
- Ezdi et al. (2006) K. Ezdi, M. Islam, Y. Reddy, C. Jordens, A. Enders, and M. Koch, Proceedings of SPIE 6194, 61940G (2006), URL https://dx.doi.org/10.1117/12.662010.
- Kim and Citrin (2006) D. Kim and D. Citrin, Applied Physics Letters 88, 161117 (2006), URL http://dx.doi.org/10.1063/1.2196480.
- Weiland (1996) T. Weiland, International Journal of Numerical Modelling: Electronic Networks, Devices and Fields 9, 295 (1996), ISSN 1099-1204, URL http://dx.doi.org/10.1002/(SICI)1099-1204(199607)9:4<295::AID-JNM240>3.0.CO;2-8.
- Ponomarev et al. (2017a) D. Ponomarev, R. Khabibullin, A. Yachmenev, P. Maltsev, M. Grekhov, I. Ilyakov, B. Shishkin, and R. Akhmedzhanov, Semiconductors 51, 509 (2017a), URL https://doi.org/10.1134/S1063782617040170.
- Ponomarev et al. (2017b) D. S. Ponomarev, R. A. Khabibullin, A. E. Yachmenev, A. Y. Pavlov, D. N. Slapovskiy, I. A. Glinskiy, D. V. Lavrukhin, O. A. Ruban, and P. P. Maltsev, Semiconductors 51, 1218 (2017b), ISSN 1090-6479, URL https://doi.org/10.1134/S1063782617090160.