SmartEAR: Smartwatch-based Unsupervised Learning for Multi-modal Signal Analysis in Opportunistic Sensing Framework
Abstract
Wrist-bands such as smartwatches have become an unobtrusive interface for collecting physiological and contextual data from users. Smartwatches are being used for smart healthcare, telecare, and wellness monitoring. In this paper, we used data collected from the framework leveraging smartwatches to gather and store physiological data from patients in naturalistic settings. This data included temperature, galvanic skin response (GSR), acceleration, and heart rate (HR). In particular, we focused on HR and acceleration, as these two modalities are often correlated. Since the data was unlabeled we relied on unsupervised learning for multi-modal signal analysis. We propose using k-means clustering, GMM clustering, and Self-Organizing maps based on Neural Networks for group the multi-modal data into homogeneous clusters. This strategy helped in discovering latent structures in our data.
I INTRODUCTION
Smartwatches are multi-purpose computerized wristwatches. They can collect information from internal and external sensors which include heart rate, blood pressure, oxygen saturation, acceleration, galvanic skin response, and more, depending on the model. Because they support wireless technologies like Bluetooth, Wi-Fi and GPS and can connect to smartphones to exchange sensor data, they can be used effectively for many functions [1, 2]. They are useful in tracking health and physical activity, and getting notifications extended from connected smartphones. As such, smartwatches play an important role in many healthcare situations. Årsand and colleagues discuss the use of smartwatches as a diabetes patient self-management tool [3]. Systems involving two-way communication between smartwatches and the mobile phones have promising possibilities for monitoring blood glucose and physical activity [4]. Other exciting and promising smartwatch applications include EchoWear, as presented in [5, 6, 7, 8]. EchoWear is a smartwatch system used for voice and speech treatments for patients with Parkinson’s disease. This article aims at the analysis of Multi-modal smartwatch signals that can be used for neurological assessment of the subject wearing the smartwatch. Opportunistic Sensing (OS) is a paradigm for signal and information processing in which a network of sensing systems automatically discover and select sensor platforms based on an operational scenario by determining an appropriate set of features and optimal means for data collection based on these features [9]. is a use case of opportunistic sensing using smartwatches assisted with gateway devices such as smartphones/tablet and the secured cloud backend.
In this paper we are using a smartwatch-based data collection framework called [10]. It gathers physiological information from patients and stores it. This data can later be retrieved for unsupervised analysis, the main theme of this paper. Physiological signals collected from have been analyzed applying unsupervised grouping techniques, including k-means, Gaussian Mixture Models and self-organizing maps.
II Related work
II-A
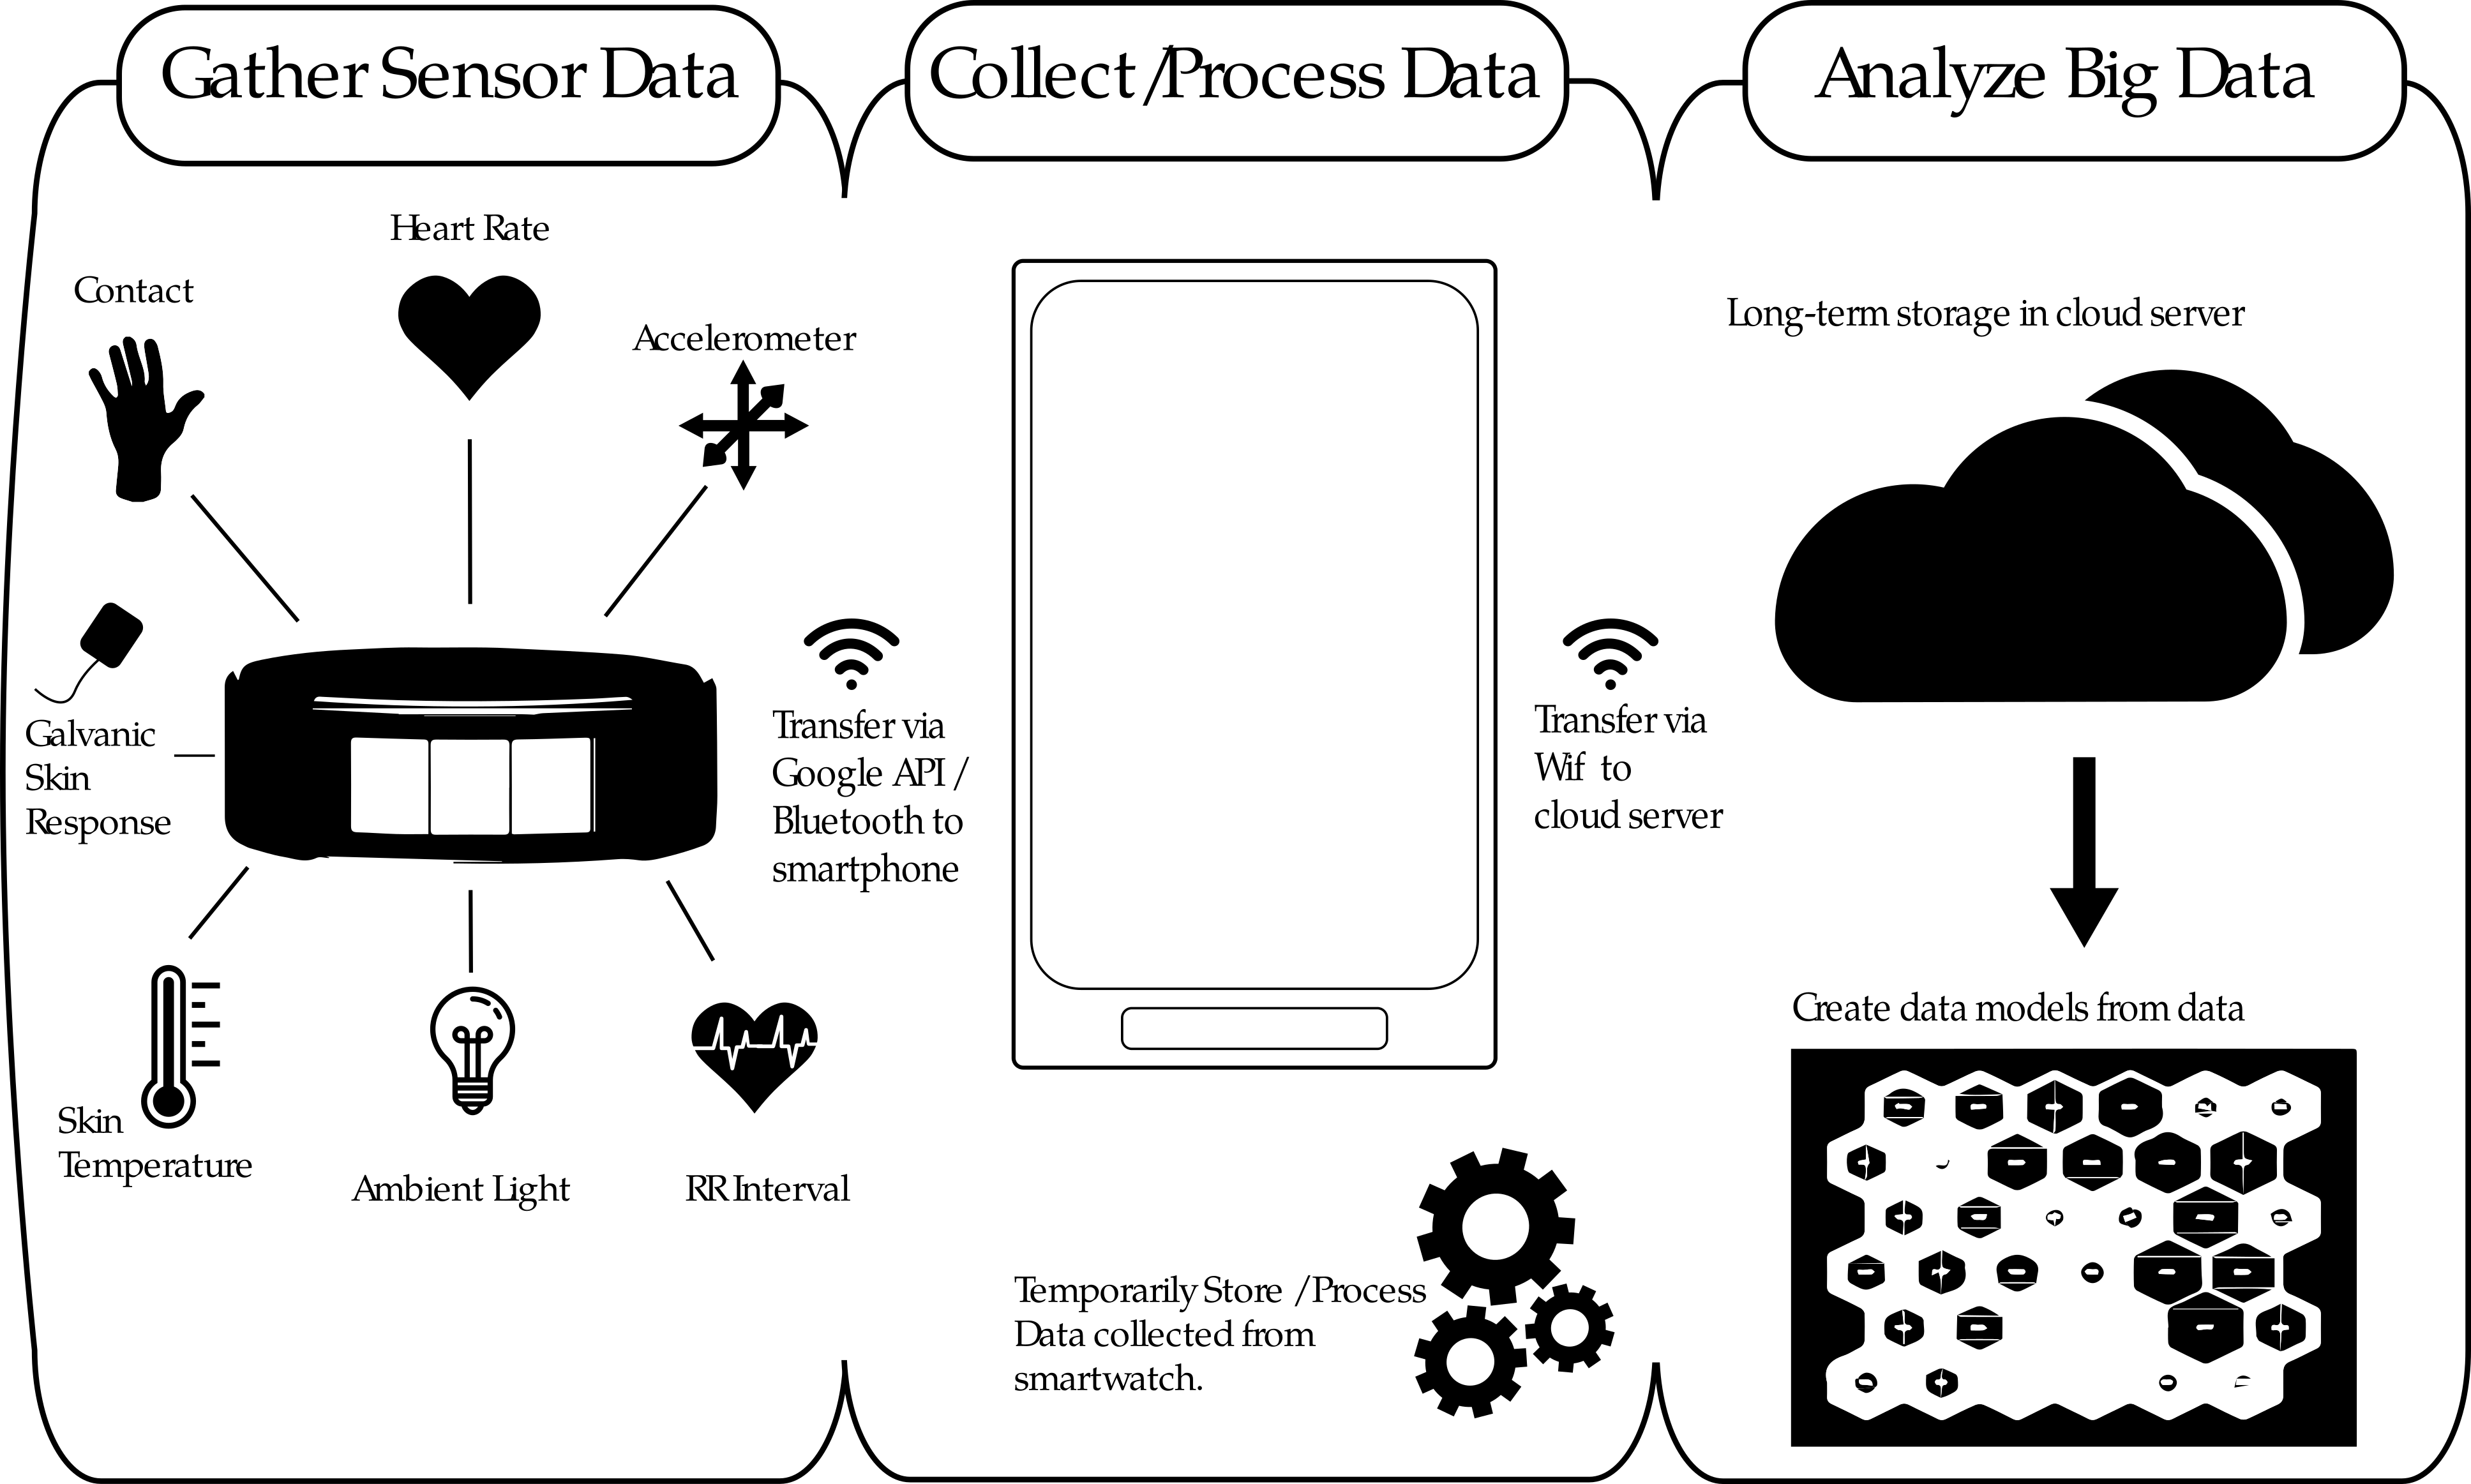
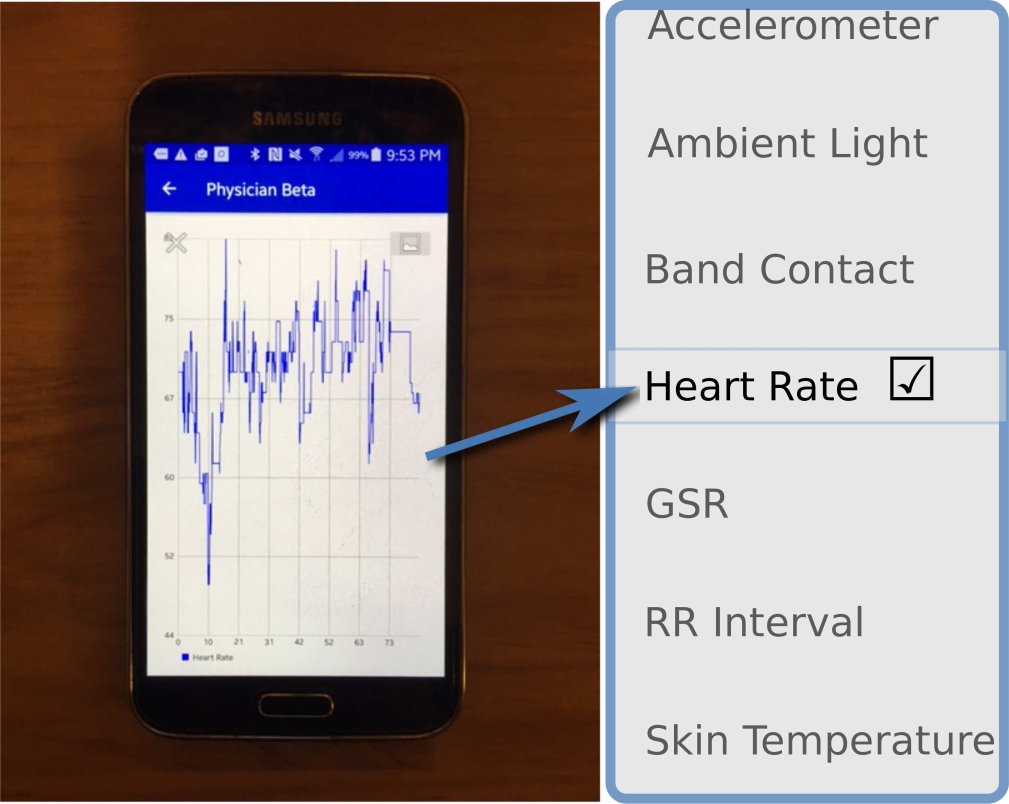
(Android Electronically Activated Recorder) is a smartwatch-based data collection framework used to gather and store data from patients in their home environment. The framework consists of an Android smartphone, a smartwatch, and a server where the data is stored and analyzed using the analysis framework presented in this paper. Along with collecting physical data, uses its smartphone’s audio recorder to record the patient’s surrounding audio when activated by a heart rate based trigger. In our current studies, patients use the Microsoft Band as the smartwatch component, as the Microsoft Band collects more accurate and plentiful than other smartwatches. Smartwatch’s sensors collect data including HR, GSR, acceleration, skin temperature, and ambient light levels. At present, the clustering analysis uses only HR and accelerometer data.
is currently being used in studies to analyze data from patients with PTSD and other anxiety disorders. Currently, attempts to identify panic attacks by triggering audio recordings when the patient’s heart rate exceeds a predetermined threshold. However, every patient is different, each having different resting heart rates, exercise habits, and triggers, creating individual variability in the data. For this reason, the framework must be able to determine when each specific user is experiencing a spike in heart rate that is not attributed to exercise or movement using Machine learning and Deep learning. This has proven to be a challenge. Because patients are not in observable environments while participating in this study, it is impossible to tell what the patient is doing during data collection, and the data is therefore unlabeled. Due to the impracticality of gathering labeled data, unsupervised algorithms are the only reasonable option for meaningful data analysis. For this reason, improvements to the framework’s anxiety-detecting capabilities rely on unsupervised clustering analysis in order to identify any possible patterns that we can use to develop an effective Shallow Machine and Deep learning algorithm.
II-B Wearables and IoT
Wearable technology and IoT device is an interconnection of sensors and fog-nodes that make them capable of transmitting and collecting the data [11, 12, 13]. The big data from IoT devices can be used effectively for health monitoring. The effectiveness of telehealth monitoring is seen in devices like EchoWear [5]. Parkinson patients can use smartwatch in their speech exercises for monitoring purpose. Various authors proposed several architecture for IoT and Fog. Kapur and colleagues describe the use of wearable sensor technology in real-time musical signal processing. The system modifies resulting sounds based upon the movements of the performing artist [14] . Emotion recognition through the use of physiological signals from the autonomic nervous system collected using wearables is another application [15]. Features were mapped to emotions such as sadness and anger. WIoT architectures may also be presented in terms of design, function, and application [16], such as in the FIT architecture [17, 18, 19]. It should, however, be noted that IoT applications require low latency and may encounter network bandwidth issues.
In our work, we leveraged the IoT based framework and proposed a model for predictive analysis using multi-modal smartwatch data. The smartwatch component of is used to gather data, which it sends to the smartphone component via a Bluetooth Low-Energy connection. After the data is collected and processed, the smartphone sends its data to a cloud server for storage and further analysis. This analysis includes our Deep learning and Shallow Machine learning algorithms. In the future this will allow us to create patient-specific models to identify panic attacks and other neurological events. This model can be sent back to the smartphone over a secure network, which can be used to locally identify panic attacks. The biggest concern with the IoT structure as it relates to this or any other health study is data security, especially during data transfer. Because patient data is sensitive by nature, securing that data is of utmost importance. If the network that the patient’s medical records are being transferred through is compromised, the records are at risk of being stolen. Currently, to comply with HIPAA standards, we are manually transferring patient data via a secure thumb drive from the location of the study to our area of work in order to analyze the data.
II-C Multi-modal Smartwatch data
AnEar uses Microsoft Band to collect data from the subjects. The Microsoft SDK exposes data from the sensors as streams, and applications can subscribe to this sensor streams. The table below shows some of the available sensor streams their sampling rates.
| Modality | Sampling Rate |
|---|---|
| Heart rate (HR) | 1 Hz |
| Accelerometer | 8 Hz |
| Galvanic skin response (GSR) | 5 Hz |
| Ambient Light | 2 Hz |
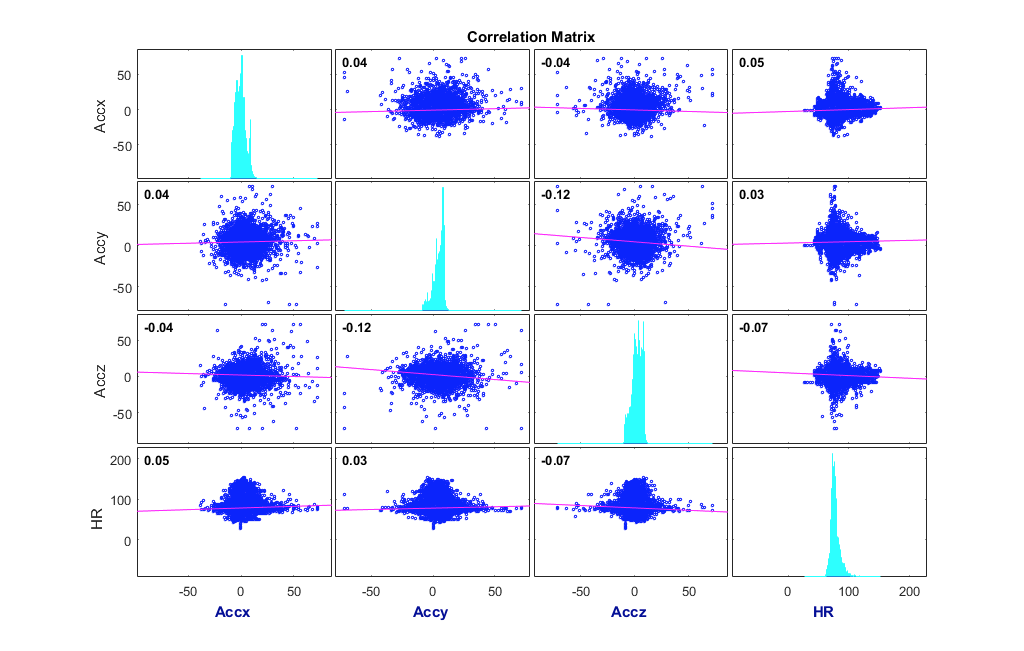
Heart rate frequently correlates with acceleration data. For example, running and otherwise exercising subjects experience increases in both HR and acceleration. The figure below shows a correlation plot between 3 dimensional acceleration and heart rate data collected from ’’. A higher Positive correlation is seen with Pearson’s rank correlation coefficient with the subject Heart rate and acceleration in X and Y direction although the value is small as we are not aware of the activities or tasks which makes this a completely unsupervised problem. This information can be vital in accessing the health status of the individuals.
II-D Data Collection
Data was collected from each subject over a two week period. During the two week study period, participants wore a Microsoft Band. Data was recorded in three minute blocks, with three minutes without recording between each block. This data was sent to a paired Android device periodically throughout the day. Data from 10 participants is analyzed in this paper.
III Proposed Approach
III-A Unsupervised Learning
Hastie, Tibshirani, and Friedman explain unsupervised learning as ‘learning without a teacher’ [20]. Unsupervised machine learning is defined as the machine learning task of inferring a function to describe hidden structure from unlabeled data. As the data is unlabeled, the accuracy of structures the algorithm reveals is not evaluated.
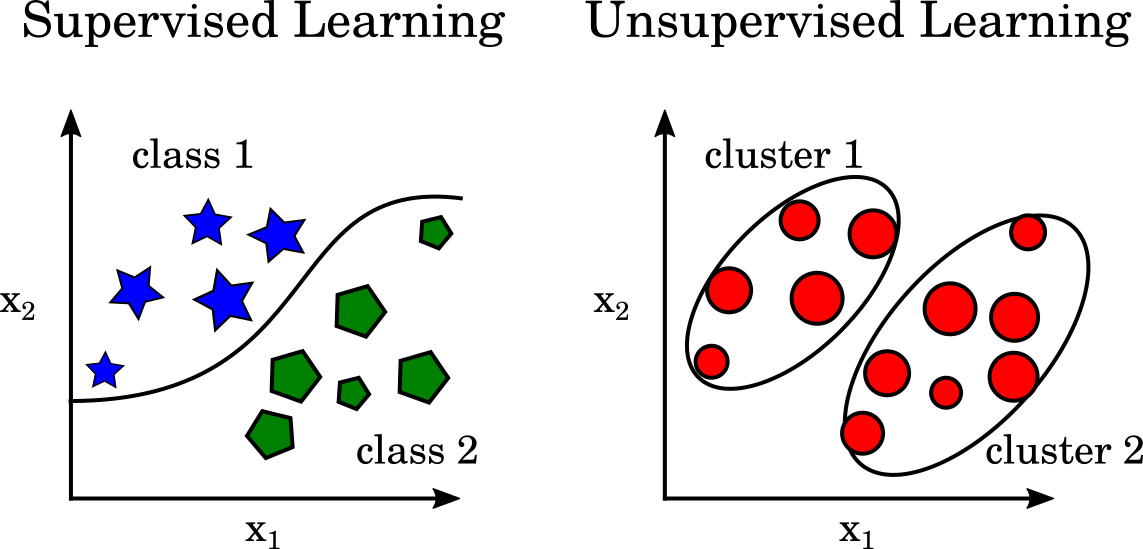
Unsupervised learning tries to draw inferences from the dataset. Cluster analysis is the most common form of unsupervised learning. It is often used for exploratory data analysis to find hidden patterns. Clusters are usually modeled using a measure of similarity, such as the Euclidean or probabilistic distance. Clustering algorithms include:
-
•
Hierarchical clustering
-
•
K-means clustering
-
•
Gaussian Mixture Models
-
•
Self-organizing maps
-
•
Hidden Markov models
We have used to collect and store unlabeled data and applied K-means, Gaussian Mixture Models and Self-organizing maps for unsupervised clustering of the data.
III-B K-means clustering
K-means clustering is an unsupervised learning that is used for exploratory data analysis of unlabeled data. It is a method of vector quantization which is quite extensively used in data mining. The algorithm finds groups in the data. In this method, observations are placed in the cluster with the nearest mean. This mean typically serves as a prototype for the cluster. The k-means++ algorithm uses an heuristic to find centroid seeds for k-means clustering. The data space is thus partitioned into Voronoi cells. As mentioned in [22] this algorithm aims to minimize the squared error function J given by:
The Euclidean distance, squared Euclidean distance, Mahalanobis distance, or Cosine distance between data points and cluster centers can be used as the distance measure, which is then minimized. Matlab functions are used to generate k-means plots of the data sourced from the AnEar framework.
III-C Gaussian Mixture Model clustering
Other approaches for clustering involve the use of certain models for clusters and attempt to optimize the fit between the data and the model. A mathematical distribution, such as a Gaussian or Poisson distribution, can represent each cluster. The entire data set is then modeled by a mixture of these distributions. GMM clustering is a fuzzy or soft clustering method, and is therefore inherently flexible. This model is often useful when analyzing subpopulations within a given population. It breaks down a general data observation of a cluster into multiple, more specific observations. This is incredibly useful when identifying the nuances of an anxiety disorder. With lots of training data, we can potentially design the SmartEAR analysis to pick up subtle changes in mood that indicate a potential panic attack in a user by applying this mixture model to our analysis.
III-D Self Organizing maps
Self Organizing Maps (SOMs) are a form of a neural network that maps inputted values on a two-dimensional plane to create similar clusters of data. Priento and colleagues proposed a new method for the detection and recognition of traffic signs using a SOM [23]. Their method first detects potential road signs by analysing the distribution of red pixels within images, and then it identifies the actual road signs from the distribution of dark pixels. The SOM map is trained to sort and organize inputs into clusters. All values in the same cluster will then be processed and handled in the same way through cluster analysis. In order to successfully organize the data in this manner, SOMs require a large amount of data to process. This allows its learning algorithm to be trained to identify and organize similar inputs, much like how the human brain processes sensory information by organizing different parts of the human brain to process different senses. According to the European Journal of Operational Research [24], SOM networks make fewer observations than other analysis algorithms, including k-means, when processing non-overlapping data sets, and outliers in the processed data don’t seem to disturb our algorithms as much. Unfortunately, the rate of correct classification drops significantly for SOMs as the number of clusters increases.
IV Results and Discussions
We collected data from the framework, including GSR, Heart Rate, Accelerometer data, and Temperature. This work presents the use of for clinical analysis. Multi-modal unlabeled smartwatch data can’t be used to directly predict the user’s activity or the neurological state. However, there may be correlations between physiological signals acquired via which, will also aid understanding of possible relationships between different vital signals. We performed unsupervised clustering analysis in this study to show a use case for the smartwatch system. Three different techniques of unsupervised clustering were performed on the data collected from the system. We have chosen to focus on two variables, HR and acceleration, due to their greater likelihood of correlation.
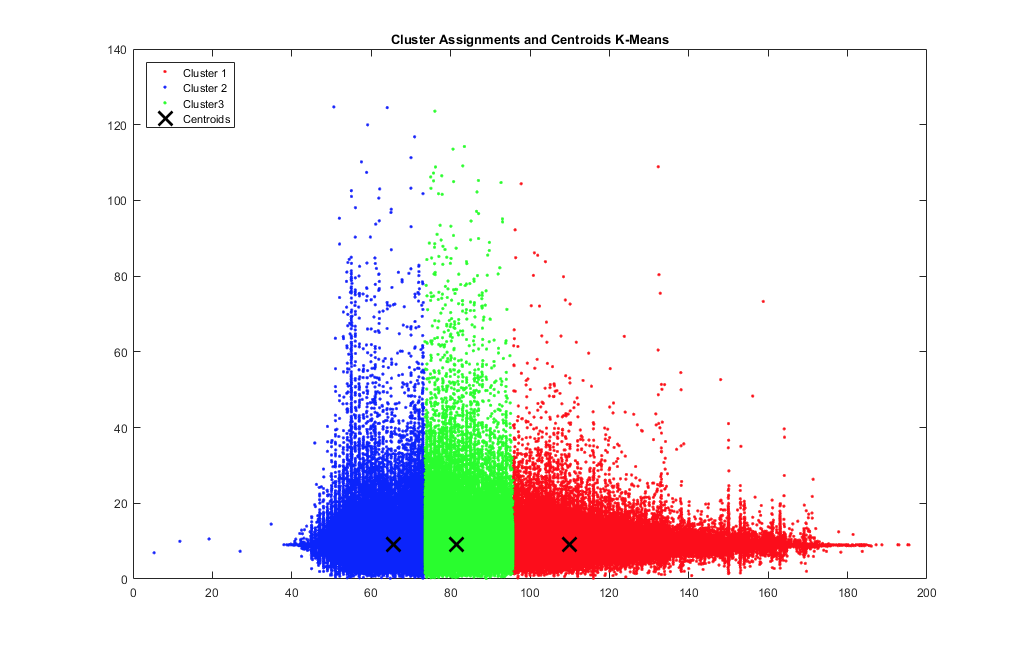
Figure 5 shows our implementation of k-means clustering using the k-means++ algorithm for centroid initialization and squared Euclidean distance. A cross marks centroid locations. The data have been partitioned into three clusters using the best arrangement out of several initializations. Matlab k-means by default initializes the replicates separately using k-means++. It reduces the probability of a bad initialization leading to a bad clustering result. Initial cluster centroid positions were chosen to perform a preliminary clustering phase on a random 10 percent subsample of the input data using the Matlab command ’cluster.’ Here the value of K is three, so we see three clusters with different colors along with their centroids. We have used the same data and analyzed it using Gaussian Mixture Model clustering.
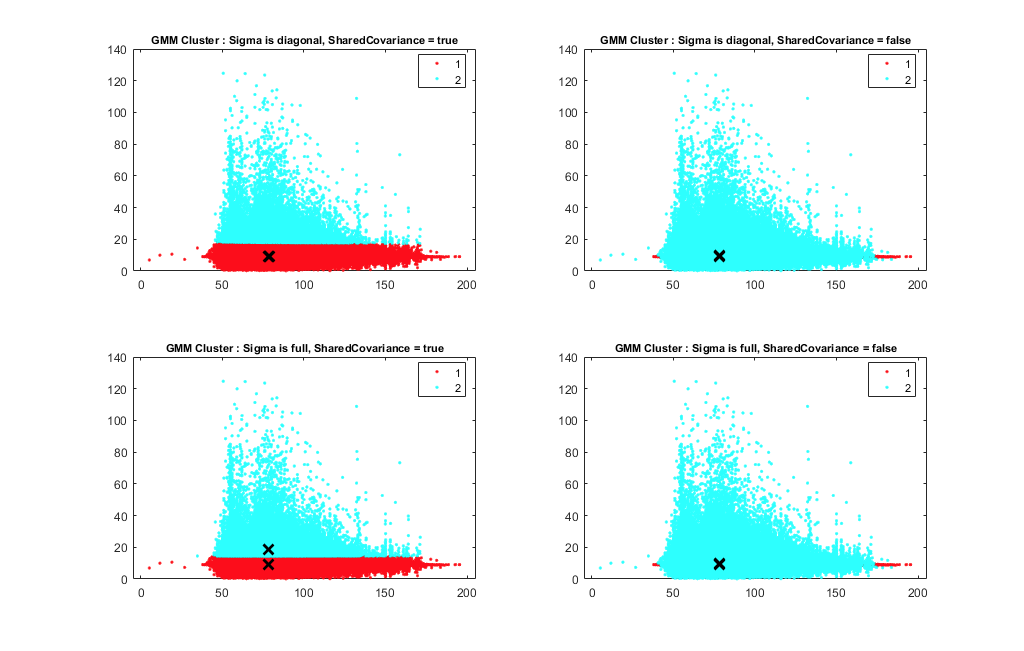
GMM clustering works by maximizing the component posterior probability given the data. Figure 6 shows the four plots generated by GMM clustering.
-
•
Diagonal covariance matrices indicate that the predictors are uncorrelated.
-
•
Full covariance matrices allow for correlated predictors.
-
•
Shared covariance matrices mean that all components have the same covariance matrix.
-
•
Unshared covariance matrices mean that all parts have their own covariance matrix.
Unlike the k-means, 2 Clusters are shown for GMM conducted on the data, as designated by two different colors. The clusters are more or less similar and informative as shown in k-means in Figure 5. The only difference is the number of clusters used in the unsupervised learning. Another exploratory analysis we have used in the self-organizing maps using Neural Network.
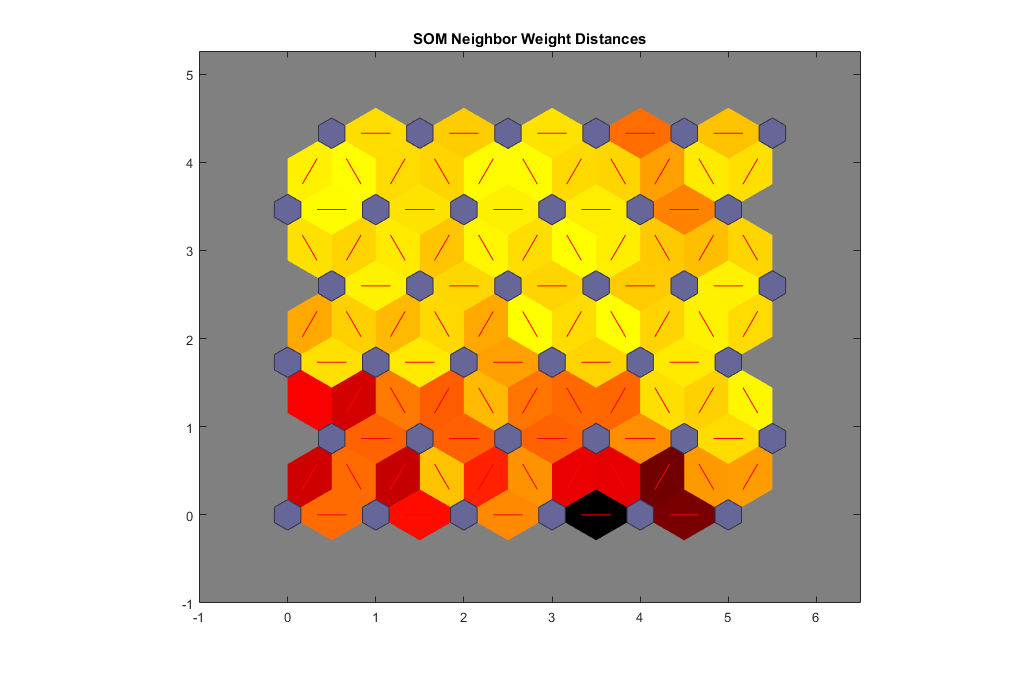
SOM or self-organizing map is a neural network method with a set of neurons connected to form a topological grid. We got a topographical map of input patterns of the data with Acceleration and Heart rate as feature space as shown in Figure 7. SOM was trained with a Neural Network of 36 Neurons. Each Neuron has several data-points in it, and thus acts as its own cluster. The SOM pattern is shown as a hexagonal grid. The blue hexagons in the figure represent the neurons, and the red lines connect neighboring neurons in the figures. The colors in the regions containing the red lines indicate the distances between neurons. Darker colors represent larger distances, and lighter colors represent smaller distances. A group of Dark segments appears in the upper-right region, bounded by some lighter segments of yellow color. From the figure, this grouping might indicate that the network has clustered the data into three groups. The color difference indicates that data points in a particular region are farther apart.
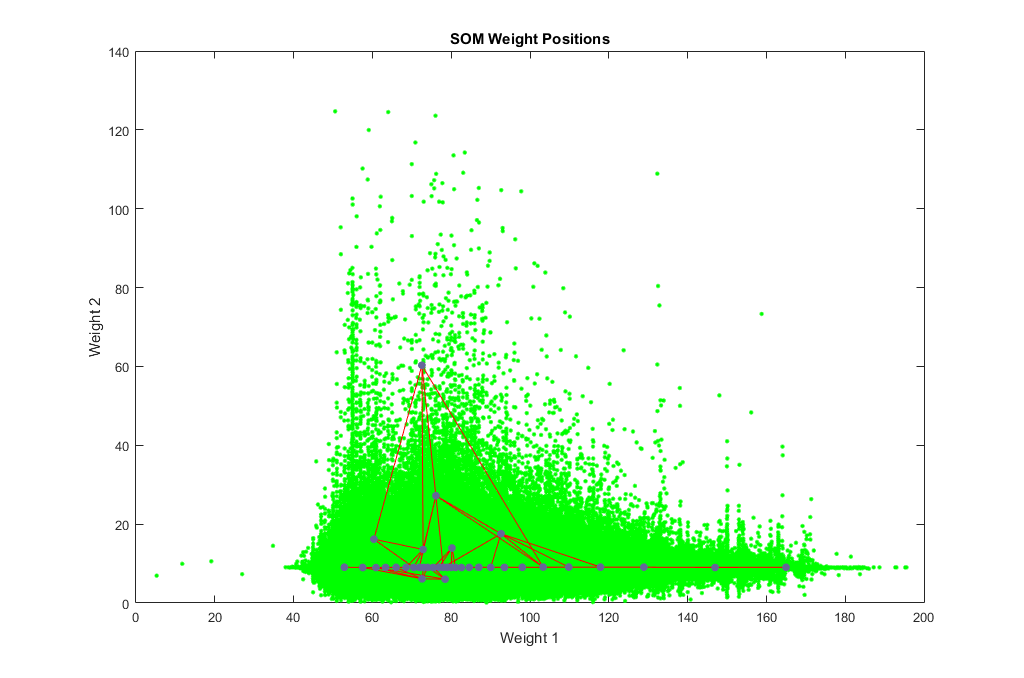
We had two parameters so we have seen two weights. The dataset consist of two features from ten subjects. Those features were Heart Rate and average Acceleration. It is hard to see distinguishable clusters from the plot of SOM weight positions, but we can clearly see the distribution of the data set and the neurons used to learn to classify input vectors according to their grouping in the input space. The blue dots or circles represent the neurons and green ones represent the data points.
Clustering analysis can reveal hidden patterns in the underlying data. We have shown three different types of clustering in this paper: k-means, Gaussian Mixture Model clustering and Neural Network based SOMs. K-means used 3 Clusters to group the data and GMM used 2 Clusters. While SOM did not use a distinct number of clusters, instead using 36 neurons, figure 7 suggests the presence of 3 clusters in the data. The smartwatch dataset is rich and can provide vital information about the person wearing the device.
V Conclusion
In this study, we leveraged multi-modal unlabeled smartwatch data from the framework. We have shown the possibility of the correlation between different modalities could be helpful in predicting the user’s activity or neurological state. We discussed results obtained through various clustering approaches such as K-means clustering, GMM clustering and SOMs for discovering the latent structures in multi-modal smartwatch data. As a future work, it would be interesting to study the analysis of such a system on data obtained through patients.
Acknowledgement
We appreciate Alyssa Zisk who helped with proofreading of this manuscript. This research was supported by the National Institutes of Health (NIH) grant (no: R01MH108641).
References
- [1] H. Dubey, M. R. Mehl, and K. Mankodiya, “Bigear: Inferring the ambient and emotional correlates from smartphone-based acoustic big data,” in Connected Health: Applications, Systems and Engineering Technologies (CHASE), 2016 IEEE First International Conference on. IEEE, 2016, pp. 78–83.
- [2] R. K. Barik, H. Dubey, K. Mankodiya, S. A. Sasane, and C. Misra, “Geofog4health: a fog-based sdi framework for geospatial health big data analysis,” Journal of Ambient Intelligence and Humanized Computing, pp. 1–17, 2018.
- [3] E. Årsand, M. Muzny, M. Bradway, J. Muzik, and G. Hartvigsen, “Performance of the first combined smartwatch and smartphone diabetes diary application study,” Journal of diabetes science and technology, vol. 9, no. 3, pp. 556–563, 2015.
- [4] R. Priyadarshini, R. K. Barik, C. Panigrahi, H. Dubey, and B. K. Mishra, “An investigation into the efficacy of deep learning tools for big data analysis in health care,” International Journal of Grid and High Performance Computing (IJGHPC), vol. 10, no. 3, pp. 1–13, 2018.
- [5] H. Dubey, J. C. Goldberg, M. Abtahi, L. Mahler, and K. Mankodiya, “Echowear: smartwatch technology for voice and speech treatments of patients with parkinson’s disease,” in Proceedings of the conference on Wireless Health. ACM, 2015, p. 15.
- [6] H. Dubey, J. C. Goldberg, K. Mankodiya, and L. Mahler, “A multi-smartwatch system for assessing speech characteristics of people with dysarthria in group settings,” in E-health Networking, Application & Services (HealthCom), 2015 17th International Conference on. IEEE, 2015, pp. 528–533.
- [7] L. Mahler, H. Dubey, J. C. Goldberg, and K. Mankodiya, “Use of smartwatch technology for people with dysarthria,” in Motor Speech Conference, Madonna Rehabilitation Hospital, 2016.
- [8] H. Dubey, A. Monteiro, N. Constant, M. Abtahi, D. Borthakur, L. Mahler, Y. Sun, Q. Yang, U. Akbar, and K. Mankodiya, “Fog computing in medical internet-of-things: architecture, implementation, and applications,” in Handbook of Large-Scale Distributed Computing in Smart Healthcare. Springer, 2017, pp. 281–321.
- [9] Q. Liang, X. Cheng, S. C. Huang, and D. Chen, “Opportunistic sensing in wireless sensor networks: theory and application,” IEEE Transactions on Computers, vol. 63, no. 8, pp. 2002–2010, 2014.
- [10] M. C. et al., “Smartwatch-driven multisensory recorder: Design and testing of a smartwatch-based framework to support psychiatric disorders,” in 2016 MIT Conference on Health Informatics, 2016.
- [11] K. Samson, “Wearing the detectives: Wristbands, smartwatches, and other wearable devices allow for more real-time monitoring of seizures and other neurologic symptoms—and, possibly, more precise treatment.” Neurology Now, vol. 11, no. 4, pp. 34–36, 2015.
- [12] N. Constant, D. Borthakur, M. Abtahi, H. Dubey, and K. Mankodiya, “Fog-assisted wiot: A smart fog gateway for end-to-end analytics in wearable internet of things,” arXiv preprint arXiv:1701.08680, 2017.
- [13] R. Barik, H. Dubey, S. Sasane, C. Misra, N. Constant, and K. Mankodiya, “Fog2fog: augmenting scalability in fog computing for health gis systems,” in Proceedings of the Second IEEE/ACM International Conference on Connected Health: Applications, Systems and Engineering Technologies. IEEE Press, 2017, pp. 241–242.
- [14] A. Kapur, E. L. Yang, A. R. Tindale, and P. F. Driessen, “Wearable sensors for real-time musical signal processing,” in Communications, Computers and signal Processing, 2005. PACRIM. 2005 IEEE Pacific Rim Conference on. IEEE, 2005, pp. 424–427.
- [15] C. L. Lisetti and F. Nasoz, “Using noninvasive wearable computers to recognize human emotions from physiological signals,” EURASIP Journal on Advances in Signal Processing, vol. 2004, no. 11, p. 929414, 2004.
- [16] S. Hiremath, G. Yang, and K. Mankodiya, “Wearable internet of things: Concept, architectural components and promises for person-centered healthcare,” in Mobihealth Conference. IEEE, 2014.
- [17] A. Monteiro, H. Dubey, L. Mahler, Q. Yang, and K. Mankodiya, “Fit: A fog computing device for speech tele-treatments,” in IEEE Smart Computing (SMARTCOMP), 2016.
- [18] R. K. Barik, H. Dubey, and K. Mankodiya, “Soa-fog: Secure service-oriented edge computing architecture for smart health big data analytics,” in Signal and Information Processing (GlobalSIP), 2017 IEEE Global Conference on. IEEE, 2017, pp. 477–481.
- [19] R. K. Barik, H. Dubey, C. Misra, D. Borthakur, N. Constant, S. A. Sasane, R. K. Lenka, B. S. P. Mishra, H. Das, and K. Mankodiya, “Fog assisted cloud computing in era of big data and internet-of-things: Systems, architectures, and applications,” in Cloud Computing for Optimization: Foundations, Applications, and Challenges. Springer, 2018, pp. 367–394.
- [20] T. Hastie, R. Tibshirani, and J. Friedman, “Unsupervised learning,” in The elements of statistical learning. Springer, 2009, pp. 485–585.
- [21] “Deep Learning for Image Recognition: why it’s challenging, where we’ve been, and what’s next,” https://towardsdatascience.com/deep-learning-for-image-classification-why-its-challenging-where-we-ve-been-and-what-s-next-93b56948fcef.
- [22] D. Borthakur, H. Dubey, N. Constant, L. Mahler, and K. Mankodiya, “Smart fog: Fog computing framework for unsupervised clustering analytics in wearable internet of things,” in Signal and Information Processing (GlobalSIP), 2017 IEEE Global Conference on. IEEE, 2017, pp. 472–476.
- [23] M. S. Prieto and A. R. Allen, “Using self-organising maps in the detection and recognition of road signs,” Image and Vision Computing, vol. 27, no. 6, pp. 673–683, 2009.
- [24] S. A. Mingoti and J. O. Lima, “Comparing som neural network with fuzzy c-means, k-means and traditional hierarchical clustering algorithms,” European journal of operational research, vol. 174, no. 3, pp. 1742–1759, 2006.