Lattice study of static quark-antiquark interactions in dense quark matter
Abstract
In this paper we study the interactions among a static quark-antiquark pair in the presence of dense two-color quark matter with lattice simulation. To this end we compute Polyakov line correlation functions and determine the renormalized color averaged, color singlet and color triplet grand potentials. The color singlet grand potential allows us to elucidate the number of quarks induced by a static quark antiquark source, as well as the internal energy of such a pair in dense quark matter. We furthermore determine the screening length, which in the confinement phase is synonymous with the string breaking distance. The screening length is a decreasing function of baryon density, due to the possibility to break the interquark string via a scalar diquark condensate at high density. We also study the large distance properties of the color singlet grand potential in a dense medium and find that it is well described by a simple Debye screening formula, parameterized by a Debye mass and an effective coupling constant. The latter is of order of unity, i.e. even at large density two-color quark matter is a strongly correlated system.
pacs:
12.38.Gc, 12.38.AwI Introduction
Knowledge of the properties of QCD at large baryon density is needed to interpret the results of heavy ion collisions experiments. In particular, this is the case at the future experiments of NICA (JINR, Dubna) and FAIR (Darmstadt, Germany), which are designed to study the region of high baryon density. Input from the theory side is hence urgently needed. An understanding of the properties of matter in the corresponding region of the QCD phase diagram is also extremely important in astrophysics, for example, for a correct description of the fusion of neutron stars.
In general, lattice QCD is a powerful tool to study the nonperturbative properties of strongly interacting matter from first principles. By virtue of lattice simulations vital insight into QCD at finite temperature Borsanyi:2016bzg , nonzero magnetic field DElia:2013xrj , isospin chemical potential Brandt:2017oyy ; Scior:2017cne and chiral chemical potential Braguta:2015zta ; Braguta:2015owi ; Braguta:2016aov has been obtained.
An interesting area of finite temperature lattice simulations is the study of the interaction between a quark-antiquark pair and the interaction of the pair with the QCD medium (see e.g. Kaczmarek:2002mc ; Kaczmarek:2004gv ; Kaczmarek:2005ui ; Kaczmarek:2005gi ; Maezawa:2010vj ; Maezawa:2011aa ).
The in-medium properties of QCD are prominently encoded in the correlation function of Polyakov loops (i.e. Polyakov lines with maximum temporal extent). As the Polyakov loop constitutes a quasi order parameter of the strong interactions, its correlator is greatly affected by the phase transitions which take place in QCD. One pertinent example is the confinement/deconfinement phase transition which considerably modifies the value of the correlator.
Furthermore the Polyakov loop correlator is directly related to the free energy of the in-medium quark-antiquark pair.In the confinement phase the free energy extracted is known to be a linear increasing function at intermediate distances. At zero temperature and distances fm the free energy asymptotes to a plateau due to the string breaking phenomenon. On the other hand in the deconfinement phase at large distances the free energy also flattens off, the reason being a screening of the interactions between the quark and antiquark due to liberated colored medium degrees of freedom. The question of whether or how the screening properties of QCD may be captured by an analogous and equally simple Debye screening formula in analogy with the Abelian theory is a ongoing field of research. The properties of the correlation function of Polyakov loops at finite temperature in QCD have been thoroughly studied in lattice simulations Kaczmarek:2002mc ; Kaczmarek:2004gv ; Kaczmarek:2005ui ; Kaczmarek:2005gi ; Maezawa:2010vj ; Maezawa:2011aa . More recently the Polyakov loop correlator on the lattice has been compared to effective field theory predictions, both in a perturbative setting in pNRQCD, as well as perturbatively matched EQCD Bazavov:2018wmo . For analytic studies of the Polyakov loop see e.g. Fischer:2013eca ; Agasian:2017tag .
While it is an interesting proposition to carry out similar studies of the Polyakov loop at finite Baryon density in QCD, the usual methods of lattice QCD unfortunately break down because of the so-called sign problem. Instead approaches, such as the Taylor expansion or analytical continuation (both in quark chemical potential) allow one to obtain useful results at small values of the chemical potential (see e.g. Bazavov:2017dus ; Gunther:2016vcp ; DElia:2016jqh ). There are a lot of analytical attempts to study properties of dense matter (see e.g. Buballa:2003qv ; Alford:2007xm ; Andreichikov:2017ncy . However, most of them are not based on first principles and it is not clear how to reliably estimate the systematic uncertainty of different models.
Instead of pursuing the question of finite density physics in QCD directly, we here turn to the study of theories, which are similar to QCD but are not plagued by the sign problem. We believe that in particular the study of dense two-color QCD Kogut:1999iv ; Kogut:2000ek allows us to learn about the properties of regular QCD at nonzero chemical potential. Other candidate theories not further pursued here are e.g. QCD at nonzero isospin chemical potential Son:2000xc ; Janssen:2015lda . Of course we cannot expect to obtain quantitative predictions from such a strategy, while vital qualitative insight may be gained.
Two-color QCD at finite chemical potential has been studied with lattice simulations quite intensively before, see, e.g. Hands:1999md ; Muroya:2002ry ; Kogut:2002cm ; Cotter:2012mb ; Braguta:2016cpw ; Holicki:2017psk and references therein. Mostly these papers are aiming at the study of the phase diagram of two-color QCD in the region of small and moderate baryon densities.
The phase structure of two-color QCD at large baryon densities was studied in our previous paper Bornyakov:2017txe , where lattice simulations were carried out at a relatively small lattice spacing fm. Compared to previous works, it allows us to extent the range of accessible values of the baryon density, up to quark chemical potential MeV, avoiding strong lattice artifacts. The main result of the paper Bornyakov:2017txe is the observation of the confinement/deconfinement transition at finite density and low temperature. In view of this finding we are interested in studying the properties of the Polyakov loop correlation function in cold dense quark matter and to shed light on how they are affected by the confinement/deconfinement transition, which takes place at finite density. This is the central question addressed in this paper.
The manuscript is organized as follows. In the next section II we describe our lattice set-up. In section III we give an overview of the present status of the cold dense two-color QCD phase diagram. Section IV is devoted to the calculation of the renormalized Polyakov loop correlation functions, as well as of the color averaged, color singlet and color triplet grand potentials. In addition, in the same section we determine the renormalized Polyakov loop and the grand potential of a single quark/antiquark. Using the color singlet grand potential, the quark number and internal energy induced by a static quark-antiquark pair are obtained in section V. We consider the string breaking phenomenon in dense quark matter in section VI and Debye screening in section VII. In the last section VIII we discuss our results and conclude.
II Simulation details
In our lattice study we used the tree level improved Symanzik gauge action Weisz:1982zw ; Curci:1983an . For the fermionic degrees of freedom we used staggered fermions with an action of the form
| (1) |
with
| (2) |
where , are staggered fermion fields, is the lattice spacing, is the bare quark mass, and are the standard staggered phase factors: . The chemical potential is introduced into the Dirac operator (2) through the multiplication of the links along and opposite to the temporal direction by factors respectively. This way of introducing the chemical potential makes it possible to avoid additional divergences and to reproduce well known continuum results Hasenfratz:1983ba .
In addition to the standard staggered fermion action we add a diquark source term Hands:1999md to equation (1). The diquark source term explicitly violates and allows to observe diquark condensation even on finite lattices, because this term effectively chooses one vacuum from the family of -symmetric vacua. Typically one carries out numerical simulations at a few nonzero values of the parameter and then extrapolates to zero . Notice, however, that this paper is aimed at studying the region of large baryon density where lattice simulations are numerically very expensive. For this reason, in this paper we have chosen a different strategy. Most of our lattice simulations are conducted at a single fixed value . In order to check the -dependence of our results for chemical potentials we carry out additional lattice simulations for values of .
Integrating out the fermion fields, the partition function for the theory with the action can be written in the form
| (3) |
which corresponds to dynamical fermions in the continuum limit. Note that the pfaffian is strictly positive, such that one can use Hybrid Monte-Carlo methods to study this system. First lattice studies of the theory with partition function (3) have been carried out in the following papers Kogut:2001na ; Kogut:2001if ; Kogut:2002cm . In the present study we are going to investigate instead a theory with the partition function
| (4) |
which corresponds to dynamical fermions in the continuum limit.
It is known that the symmetries of the staggered fermion action are different from those of two-color QCD with fundamental quarks Hands:1999md . In particular, the symmetry breaking pattern of QC2D with fundamental quarks is SU(2) Sp(2), whereas for staggered quarks it is SU(2) O(2). Notice, however, that in the naive continuum limit for the staggered action with the diquark source term, the action factorizes into two copies of fundamental fermionsBraguta:2016cpw . In addition, for sufficiently small lattice spacing the -function of the theory (4) measured in Braguta:2016cpw corresponds to the -function of QC2D with two fundamental flavors. For these reasons we believe, that the partition function (4) after the rooting procedure corresponds to QC2D with fundamental fermions with a correct continuum chiral symmetry breaking pattern.
The results presented in this paper have been obtained in lattice simulations performed on a lattice for a set of the chemical potentials in the region . At zero density we performed scale setting using the QCD Sommer scale Bazavov:2011nk . In this case the string tension associated to amounts to at .
Numerical simulations in the region of large baryon density require considerable computer resources. For this reason, for the present paper we performed our study at a pion mass of , where the cost is manageable. We will preferentially choose a smaller pion mass in future simulations.
To calculate Wilson loops we have employed the following smearing scheme: one step of HYP smearing Hasenfratz:2001hp for temporal links with the smearing parameters according to the HYP2 parameter set DellaMorte:2005nwx followed by 100 steps of APE smearing Albanese:1987ds (for spatial links only) with a smearing parameter . We found that the HYP2 parameter set provides a better signal-to-noise ratio for Wilson loops and correlators of the Polyakov loops than the HYP1 set. As for the calculations of Polyakov loop, color-averaged (5), color-singlet (6) and color-triplet (7) correlators one step of HYP2 smearing for temporal links was performed, but in the case of singlet and triplet correlators the Coulomb gauge without residual gauge fixing was fixed at first. The formulas used in the calculation are
| (5) | |||||
| (6) | |||||
| (7) |
The reason why we performed smearing is that, due to the large time extension () correlators of the Polyakov loops by default are very noisy. Thus one has to introduce some smoothing technique to extract the signal. An analogous smearing scheme was applied in the papers Bonati:2017uvz ; Bonati:2014ksa .
III The phase diagram of dense two-color QCD at low temperatures
Let us explore the tentative phase structure of two-color QCD as basis for our study of interquark interactions. Based on symmetry arguments it is possible to build a chiral perturbation theory (ChPT) for sufficiently small chemical potential Kogut:1999iv ; Son:2000xc ; Kogut:2000ek . This ChPT can be used to predict the phase transitions at sufficiently small values of the chemical potential. In particular, it was predicted that for small values of chemical potential () the system is in the hadronic phase. In this phase the system exhibits confinement and chiral symmetry is broken.
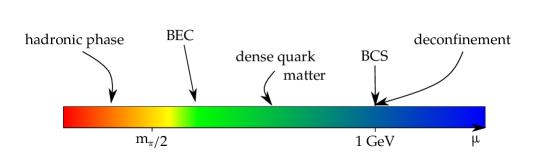
At MeV ( in lattice units) there is a second order phase transition to a phase where scalar diquarks form a Bose-Einstein condensate (BEC phase). The order parameter of this transition is the diquark condensate , where is the matrix which acts on Dirac indices and are Pauli matrices which act on flavor and color indices of the quark field . In the massless limit there is no chiral symmetry breaking, if the diquarks are condensed. However, for massive quarks the chiral condensate is not zero. Instead it is proportional to the quark mass and decreases with increasing chemical potential. Let us note that dense QC2D in the hadronic phase and the BEC phase was intensively studied within lattice simulations in a series of papers Hands:1999md ; Kogut:2001na ; Kogut:2001if ; Boz:2015ppa ; Braguta:2016cpw ; Holicki:2017psk where reasonable agreement with ChPT was observed.
In the ChPT the interactions between different degrees of freedom are accounted for by perturbation theory, so they are assumed to be weak and in addition the baryon density in the region of application is small. Together with the fact that in two-color QCD the diquarks are baryons this implies that the system is similar to a dilute baryon gas at above but below the values corresponding to large density.
Enhancing the baryon density further, we proceed to dense matter, where the interactions between baryons cannot be accounted for within perturbation theory. This transition can be seen through the deviation of different observables from the predictions of ChPT. In our paper Braguta:2016cpw this deviation was observed in the diquark condensate, the chiral condensate and the baryon density.
At sufficiently large baryon density () some observables of the system under study can be described using Bardeen-Cooper-Schrieffer theory (BCS phase)111The properties of the BCS phase will be considered in a forthcoming study of ours.. In particular, the baryon density is well described by the density of noninteracting fermions which occupy a Fermi sphere of radius . In addition, the diquark condensate, which plays the role of a condensate of Cooper pairs, is proportional to the Fermi surface. In lattice simulation the BCS phase was observed in the following papers Hands:2006ve ; Hands:2010gd ; Cotter:2012mb ; Braguta:2016cpw and we found that the transition from the BEC to the BCS phase is smooth Braguta:2016cpw .
In addition to the transition to the BCS phase at MeV () there is the confinement/deconfinement transition in dense two-color QCD Bornyakov:2017txe . This transition manifests itself in a rise of the Polyakov loop and vanishing of the string tension. It was also found that after deconfinement is achieved, we observe a monotonous decrease of the spatial string tension which ends up vanishing at MeV (). It should be noted that the results of this study suggest that the confinement/deconfinement transition is rather smooth. The Polyakov loop results do not allow us to locate the transition region from the confinement to the deconfinement phase. For this reason we consider here the transition region to be around MeV . This value was found in our previous study Bornyakov:2017txe , where it was determined by the condition that the string tension, extracted from the Wilson loops, becomes zero within the uncertainty of the calculation. Thus throughout the paper we use the term "the confinement/deconfinement transition region" in the sense of vanishing of the string tension extracted from the Wilson loops.
IV The grand potential of a static quark-antiquark pair in dense quark matter
In this section we are going to study the grand potential of a static quark-antiquark pair placed within a distance of into the dense medium. It can be represented in terms of the correlator of Polyakov loops
| (8) |
where and the Polyakov loop is given as the trace of a product of gauge links in temporal direction The quantity denotes a divergent renormalization constant, which is related to the self-energy of a quark or antiquark source. In the limit , the correlation between the Polyakov lines becomes negligible and the grand potential is given by the squared expectation value of the volume-averaged Polyakov loop, :
| (9) |
To find the grand potentials from formulae (8) and (9) one has to determine the renormalization constant .
In pure gauge theory the expectation value of the Polyakov line which is defined as
| (10) |
is the order parameter of the confinement/deconfinement transition. In particular, vanishes in the confined phase, whereas it is non-zero in the deconfined phase. After inclusion of dynamical quarks in the simulations, the expectation value of the Polyakov line is no longer an order parameter. However, one can interpret the as the grand potential of one quark or one antiquark in dense quark matter. Thus one may expect that in the confined phase is much larger than that in the deconfined phase.
Below we will also need the color-singlet grand potential , which is defined as
| (11) |
Notice that contrary to the color averaged grand potential , the singlet one is not gauge invariant. So, in order to calculate we have to fix the gauge and we choose here conventionally the Coulomb gauge.
Both the color averaged and the color singlet grand potentials are calculated up to renormalization constants. Now let us define the relative normalization of these observables. It is clear that at sufficiently large spatial separation between quarks the relative orientation of charges in color space is not important due to screening. For this reason the authors of Kaczmarek:2002mc ; Kaczmarek:2004gv ; Kaczmarek:2005ui chose a relative normalization of the color averaged and color singlet free energies, such that they are identical at large distances. In our paper we are going to use the same relative normalization between the and .
For two-colors, the color averaged grand potential can be represented Nadkarni:1986cz through the color singlet and the color triplet grand potential as
| (12) |
Let us consider short distances (), i.e. distances where the Debye screening can be neglected. In this limit the running of the coupling constant is determined by the scale , and the influence of the chemical potential on the running coupling can be neglected. The perturbative one-gluon exchange expression for the color singlet and the triplet grand potentials at short distances () can be written as
| (13) |
We have already discussed relative normalization between the grand potentials and . Thus to renormalize the grand potentials it is sufficient to renormalize one of them. Let us consider . To do this we use the procedure proposed in Kaczmarek:2002mc ; Kaczmarek:2004gv ; Kaczmarek:2005ui , adopted here for the calculation at finite density. The grand potential at finite temperature and chemical potential is defined as
| (14) |
where function is the internal energy, the function is the entropy and the function is the quark number density of a static color singlet quark-antiquark pair. From the above discussion it is clear that at short distances the grand potential does not depend neither on the chemical potential nor on the temperature . This implies that at short distances the entropy and the quark number density are zero. It is also clear that at short distances the internal energy equals to the interaction potential in a quark-antiquark pair at zero temperature and density. So, at short distances the grand potential coincides with the zero temperature and density potential which is calculated in Appendix A. Similarly to papers Kaczmarek:2002mc ; Kaczmarek:2004gv ; Kaczmarek:2005ui we fix the renormalization constant through the matching condition for at short distances to the short distance behavior of the interaction potential . The renormalization for the grand potential can be fixed using matching at large distances, where the color averaged and the color singlet grand potentials are expected to be identical. Evidently, this procedure allows us to get rid of the divergent self-energy contributions and uniquely fixes the renormalization constants and .

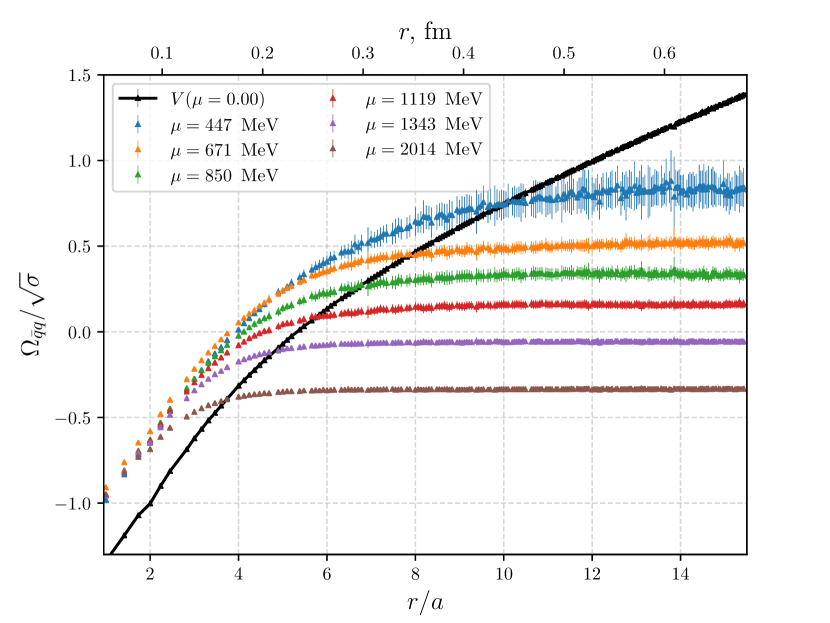
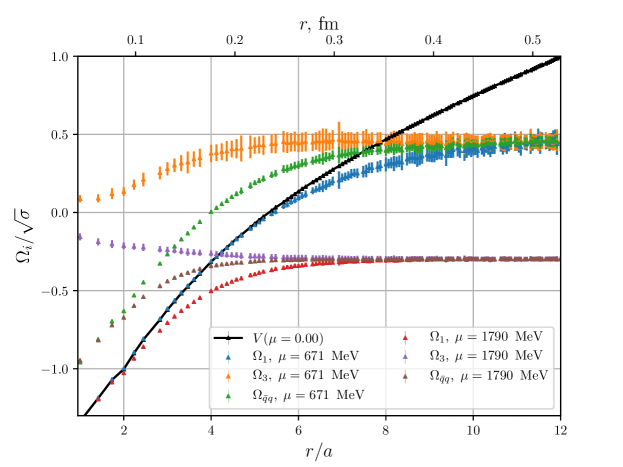
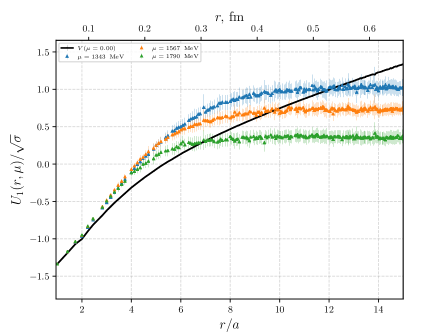
Having gone through the renormalization procedure we are ready to present the results of the calculation of the renormalized grand potentials , , . In figure 3 we plot the renormalized as a function of distance for different values of the chemical potential. In figure 3 we plot the grand potential . To get an idea how the , , look in one figure we plot figure 4 where these potentials are shown for the values MeV and MeV.
The grand potential of a single quark/antiquark in quark matter and the Polyakov loop are important quantities in two-color QCD. After the renormalization these observables can be extracted from the Polyakov loop correlator at large distances. In the calculation we take and calculate the renormalized Polyakov loop applying formula (10). Notice that for the calculation it is important that the grand potential extracted from the Polyakov loop correlator goes to a plateau value. In the confined, phase the plateau in the grand potential is due to string breaking, which takes place at large distance. Due to the relatively small spatial lattice size we can observe the string breaking only for sufficiently large chemical potential ( MeV). For this reason the calculation of the and based on the renormalized correlator of the Polyakov loops can be carried out for MeV. The results for and are shown in figure 6 and in figure 6 by red triangles.
The renormalization of the and the Polyakov line can be carried out through the measurement of the latter on the lattice. In this case it is possible to find both observables for all values of the chemical potential under study. To calculate the Polyakov loop we conduct one step of the HYP smearing. The Polyakov loop is renormalized according to
| (15) |
where is the Polyakov loop measured in the previuos approach222The point MeV was chosen since here we have large statistics and, therefore, rather good accuracy in the calculation of the ., and is the bare Polyakov loop measured on the lattice. Similarly to the renormalization of the correlators of the Polyakov loops, the approach based on (15) gets rid of infinite ultraviolet divergence and uniquely fixes the renormalization.
Having calculated the renormalized Polyakov line, we can find the using formula (10). The results for and are shown in figure 6 and in figure 6 by blue circles. From these figures one sees that both approaches to the calculation of the and are in agreement with each other.
Here a few comments are in order: the measurement of the Polyakov loop correlation functions in this section was carried out at . As was discussed above, in order to check the -dependence of our results we carried out a similar study at and . We found that with the exception of the chemical potential the results obtained with different values of the parameter are in agreement with each other within the uncertainty of the calculation. For the chemical potential the results obtained at different deviate from each other by around . From this fact we conclude that the -dependence of our results is weak.
The confinement/deconfinement transition at finite temperature manifests itself in an increasing value of the Polyakov loop and its rise may become quite rapid in the transition region Kaczmarek:2005ui . A similar behaviour can be seen from figure 6, where the confinement/deconfinement transition is observed through the rise of the Polyakov line. At the same time from this figure we don’t see any specific region in the chemical potential where the rise of the Polyakov line is dramatically different as compared to other regions. This observation corroborates our previous finding that the finite density confinement/deconfinement transition in two-color QCD is rather smooth. 333Our data do not allow us to confirm or exclude existence of an inflection point at some value of the chemical potential similar to the inflection point in the temperature dependence of the Polyakov loop. The search of possible inflection point in dense matter requires better accuracy and more data points as compared to the data available in this study.
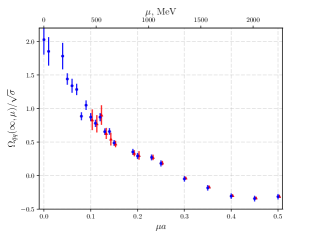
Let us now pay attention to the region MeV. In this region the Polyakov loop/grand potential reaches a maximum/minimum and then drops/rises. Below it will be shown that the region MeV differs from the region MeV not only for the Polyakov loop but also the grand potential. In turn also derived observables, such as the screening length , the Debye mass and effective coupling constant show a distinctive behavior.
At the moment we do not fully understand the physics, which is responsible for this behavior. One possibility is that the value of the chemical potential MeV is exceptional since there is nonzero spatial string tension in the region MeV whereas the spatial string tension is zero for MeV. This might imply that the point MeV separates systems with and without magnetic screening. However a definite answer to this hypothesis requires further study.
From figure 6 one sees that the potential changes its sign at MeV, which at first sight may be unexpected. However, let us recall that is not a grand potential of the whole system. On the contrary, it is the difference of the grand potential of dense quark matter with a static quark-antiquark pair and dense quark matter without a static quark-antiquark pair. So, in our context is the additional grand potential due to the introduction of the quark-antiquark pair to quark matter. Now figure 6 can be interpreted as follows: introducing a static quark-antiquark pair increases the grand potential of the system for MeV and decreases the grand potential of the system for MeV. An explanation of this fact will be presented in the next section.
The authors of Cotter:2012mb studied QC2D with quarks within lattice simulation with dynamical Wilson fermions. In particular, they measured the Polyakov loop as a function of the chemical potential and observed the following behavior: It remains zero up to and then quickly rises. In the region , due to the saturation the quark degrees of freedom, quarks are no longer dynamical and the theory becomes quenched QCD and exhibits confinement, i.e. the Polyakov loop goes to zero for .
Further measurement of the string tension carried out in Boz:2013rca did not confirm the presence of a confinement/deconfinement transition and the decrease of the string tension with chemical potential. Although the behavior of the Polyakov line in figure 6 seems similar to that obtained in Cotter:2012mb , we believe that this behavior can be explained as a lattice artifact of Wilson fermions. In order to explain the results of Cotter:2012mb , let us recall that in Wilson fermions one has one light quark and 15 heavy quark species with masses . If the chemical potential is the heavy quarks are not suppressed any longer and additional color degrees of freedom are released to the system under study. We believe that this mechanism is responsible for the rise of the Polyakov line observed in Cotter:2012mb . Notice that this mechanism does not work for staggered quarks as used in our paper, since there are no heavy species. In addition we observe a considerable rise of the Polyakov loop already at . The decrease of the Polyakov line in figure 6 hence cannot be attributed to the saturation since it starts at , which is rather far away from the saturation in staggered fermions Braguta:2016cpw .
V The quark number and internal energy induced by a static quark-antiquark pair
The authors of Kaczmarek:2005gi calculated the free energy of a static quark-antiquark pair in QCD at finite temperature. In addition they calculated the entropy of the QCD medium in the presence of a static-quark antiquark pair. In dense quark matter there is in addition a contribution of the entropy to the grand potential (14). However, this contribution is not important at low temperature. What becomes important in dense quark matter is the quark number induced by the static quark antiquark pair . This quantity can be calculated as follows
| (16) |
Notice that the is the quark number which arise in the system due to the introduction of the quark-antiquark pair to the dense matter. So, it is the difference of the quark number with and without static quark-antiquark pair.
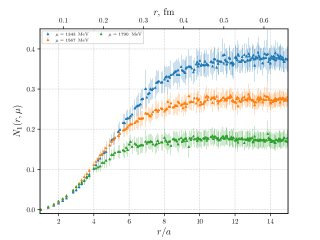
In this paper we calculate the for the color singlet grand potential. Similar observables can be calculated for the color averaged and color triplet grand potentials. To find the we determine the derivative of the grand potential over chemical potential through the finite difference approximation. The results of the calculation of the for a few values of the chemical potential are shown in figure 8. We found that the smaller the chemical potential, the larger uncertainty of the calculation in the . For this reason we show only for for sufficiently large chemical potentials.
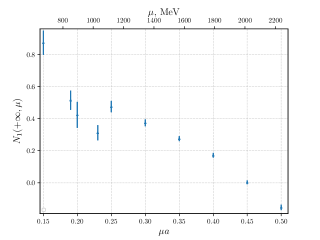
From figure 8 one sees that is rising from zero at short distances to some plateau value , which is an important observable, since it is proportional to the derivative of the Polyakov loop of a single quark/antiquark in a dense medium over the chemical potential. One might expect that at the critical chemical potential where the confinement/deconfinement phase transition takes place there is an inflection point of the Polyakov loop. For this reason the confinement/deconfinement phase transition might manifest itself in the maximum of . For the same reason the authors of Kaczmarek:2005gi observed a maximum of the entropy at the critical temperature. Our results for are shown in figure 8. Unfortunately due to large uncertainties of the calculation we are unable to locate this maximum.
If we ignore the entropy contribution to the grand potential, which is small in cold dense matter, one can calculate also the internal energy using the formula
| (17) |
In this paper we calculate the for the color singlet grand potential, the result of which is shown in figure 9.
VI String breaking in dense quark matter
Let us consider again figure 3 and figure 3. We have already mentioned that in dense QC2D the confinement/deconfinement transition takes place at MeV. Despite this fact from figure 3 we see that reaches the plateau already at MeV. This happens because of the string breaking phenomenon, which for MeV takes place at fm. Of course string breaking occurs also for smaller chemical potentials, but we do not observe it, as it takes place beyond our spatial lattice size. From figure 3 one also sees that the larger the chemical potential, the smaller the distance at which the string breaking takes place. Let us consider this phenomenon more quantitatively 444At sufficiently large values of the chemical potential the screening properties of the dense medium are described by the Debye screening phenomenon rather than by the string breaking. In this section we consider the chemical potential values corresponding to nonzero string tension extracted from the Wilson loops Bornyakov:2017txe ..
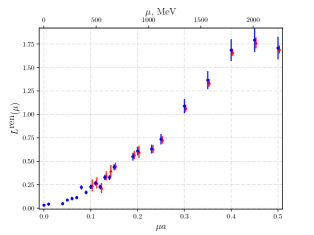
To study the string breaking phenomenon we introduce the screening length which can be calculated from the solution of the equation Kaczmarek:2002mc
| (18) |
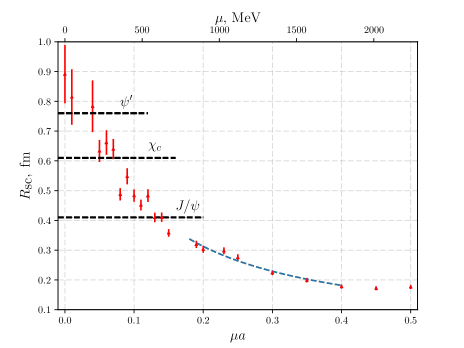
where is the static potential at zero density. For we take the grand potential calculated from the renormalized Polyakov loop measured on the lattice(see figure 6). The results of this calculation are shown in figure 10. This plot tells us that the larger the chemical potential the smaller the string breaking distance.
In order to understand this behaviour, let us recall that in three-color QCD the string breaking phenomenon can be explained by the possibility to break the string between static quarks by a quark-antiquark pair created from vacuum. If the length of the string is larger than the critical one it becomes energetically favorable to break the string and form two heavy-light meson instead of increasing the length of the string.
In dense two-color QCD in addition to the possibility to break the string by quark-antiquark pairs it becomes possible to break the string by two quarks. As the result of this phenomenon, after the string has been broken, one ends up with a heavy-light meson and one heavy-light diquark. Due to confinement, the two quarks have to be extracted from some hadron. The two-color baryon – the scalar diquark is a good candidate for such a hadron. Indeed at nonzero the scalar diquark is a lightest state in the system. At there is condesation of the scalar diquarks, so the two quarks can be extracted from the diquark condensate, which does not require any energy. This picture is supported at large in the BCS phase, where one has a Fermi sphere with radius . Evidently one cannot break the string by taking two quarks deep inside the Fermi sphere, since in that case, the quarks which break the string due to the interactions have to move from one point of the Fermi sphere to some other point inside the Fermi sphere. However, all points inside the Fermi sphere are occupied. So, the only possibility to break the string is to take two quarks close to the Fermi surface. In the confined phase, quarks on the Fermi surface are condensed as diquarks. Thus we again confirm the picture that two quarks, which break the string between a quark-antiquark pair, can be taken from the available diquarks.
Further, let us consider the following model: if one diquark penetrates inside the string, it breaks the string with some probability . For the density of diquarks , the string length and the transverse area the number of diquarks inside the string is . If the string breaking events are independent, the total probability to break the string . The condition for the string breaking is . From last statement we conclude that . Finally the larger the chemical potential, the larger the condensate and the density of diquarks, which explains why is decreasing with the .
If one increases the chemical potential then at some density becomes so small that the string cannot be created. I.e. at the instant of creation it will be immediately broken by the two-color baryons – diquarks. This is our hypothesis of the deconfinement mechanism in two-color dense quark matter. It is not clear how to find unambiguously the distance at which the string ceases to be stable. From the interaction potential at zero density (see figure 3) it is found that this happens in the region fm. Using figure 10 one can infer that the interactions in this interval are screened, as the chemical potential lie within and which agrees with the position of the confinement/deconfinement transition. We believe that this fact confirms our hypothesis.
For a chemical potential larger than the MeV() the is smaller than fm. At such small distances the entropy , the quark number density are small and the grand potential is mainly determined by the interaction potential at zero temperature and density. At the same time the renormalized interaction potential (see figure 3) is negative at distances fm. For this reason the grand potential of one quark in dense quark matter becomes negative, which was observed in the previous section.
In addition to the in figure 10 we plot the average heavy quarkonia radii which where estimated in Appendix B within a simple potential model. It is clear that if the screening length is close to the heavy quarkonium radius this state is considerably modified by dense quark matter. From figure 10 one sees that the heaviest state the due to its rather large radius should be considerably modified at nonzero density before the transition to BEC phase. The meson will instead be modified in the BEC phase. Finally we predict that the meson will be modified in dense quark matter but below the deconfiment transition. Notice, however, that if the radius of a charmonium equals to the at some density , the dissociation of this charmonium takes place at densities larger than .
A more detailed study of quarkonium dissociation in two-color dense quark matter will be presented in a future study. In particular the question of the presence of an imaginary part in the interquark potential at finite density, which may further destabilize the bound states will be carefully investigated.
VII Debye screening in dense quark matter
In the region MeV the system under study transitions from the confined to the deconfined phase. In the deconfined phase the contribution of the string is markedly reduced and one may attempt to describe in a dense quark-gluon plasma via an analogy with the Abelian theory, i.e. purely Coulombic Debye screening.
The scale of the Debye screening in perturbtion theory is denoted by the Debye mass, which to one-loop order (for the ) reads
| (19) |
To describe or results for the it is reasonable to assume that the screening length is inversely proportional to . For this reason we fit our data by the formula
| (20) |
where the is some factor. We fit our data in the region MeV and use a two-loop approximation for the running of the coupling constant (see formula (25) with ). The fit describes our data well () and the best fit parameters are , MeV. In the region MeV the data cannot be described by formula (20).
Now let us study how the Debye screening phenomenon manifests itself in the large distance behavior () of the grand potential. In this case the dominant scale is the chemical potential, i.e. the running coupling constant depends only on : . For sufficiently large density one can apply perturbation theory to calculate grand potentials. Perturbatively the grand potential is determined by two-gluon exchange and it is rapidly decreasing with distance function. Contrary to the color singlet grand potential is determined by one-gluon exchange. In this paper we consider only , whose leading order contribution has the form
| (21) |
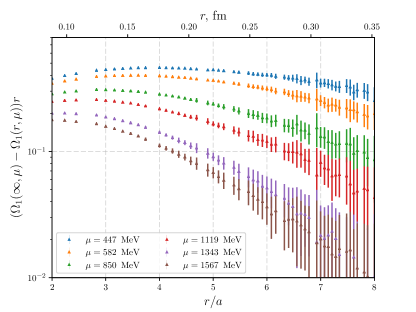
where is the Debye mass given by the expression (19). It tells us that due to Debye screening at sufficiently large distance the expression is an exponentially decreasing function of the distance. We plot in logarithmic scale in figure 11. From this figure the exponential decrease at large distance is seen starting from the MeV what confirms Debye screening phenomenon in deconfined dense quark matter. The deviation from a purely Coulombic Debye-like behavior at intermediate distances may be related to the remnants of the string, which is not perfectly screened.
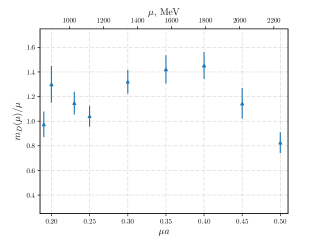
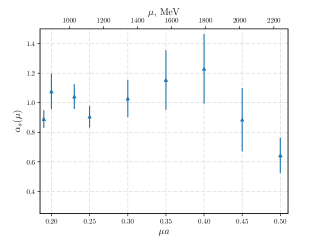
Further we fit our data in the deconfinement phase for at sufficiently large by the formula (21). The results for and as a function of the chemical potential are shown in figure 13 and figure 13. From figure 13 it is seen that the dependence of the Debye mass on the chemical potential is . Due to large uncertainties of the calculation, we are not able to resolve the running of the coupling constant with . For the same reason we are not able to observe the running of the , as shown in figure 13. The running coupling is constant within the uncertainty of the calculation up to the MeV and it starts to drop in the region MeV.
From figure 13 one sees that the coupling constant is of order of unity . It means that for all densities the system under study is strongly correlated. In addition one can expect that the one-loop formula for the Debye mass (19) is considerably modified by higher order radiative corrections. In the deconfined phase at finite temperature and zero density one also obtains a large coupling constant (see e.g. Kaczmarek:2004gv ; Kaczmarek:2005ui ).
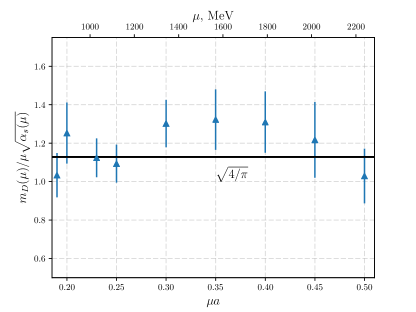
Despite the large coupling constant, it turns out that the one-loop formula (19) works quite well. To show this, we compute the ratio . At the leading order approximation this ratio is . In figure 14 we plot this ratio and find that within the uncertainties of the calculation formula (19) works quite well for and extracted from the color singlet grand potential.
VIII Conclusion and discussion
In this paper we continued our study of two-color QCD at finite density and low temperature based on lattice simulations. Our simulations were performed on 324 lattices with rooted staggered fermions at a relatively small lattice spacing a=0.044 fm, which allowed us to study two-color QCD very large baryon densities (up to quark chemical potential MeV) while avoiding strong lattice artifacts.
The aim of the present paper was the study of the interaction between a static quark-antiquark pair in two-color dense quark matter. To this end we performed computations of the Polyakov loop correlation functions and calculated the color averaged, color singlet and color triplet grand potentials. To handle appropriately the divergent self-energy contribution to the Polyakov loop correlation functions, we conduct renormalization through a matching of the color singlet grand potential to the static interaction potential of quark-antiquark pair at short distances. Having determined the renormalized grand potentials, we calculated the renormalized grand potential of a single quark/antiquark and average Polyakov loop. In addition we calculated the quark number induced by a static quark antiquark pair and its internal energy.
The confinement/deconfinement transition at finite density manifests itself in an increasing value of the Polyakov loop. The finite density transition does not show a region of rapid rise of the Polyakov loop contrary to the finite temperature case. For this reason we conclude that the transition from confinement to deconfinement at finite density is smooth.
In addition we calculated the screening length which is defined as
| (22) |
where is the static potential at zero density and the is the grand potential of a static quark-antiquark pair at infinite distance. In the confined phase, the screening length is determined by the string breaking length, whereas in the deconfined phase is determined by the Debye screening phenomenon.
The result of the calculation of the screening length shows that consistent with intuition, the larger the chemical potential the smaller , the string breaking distance. We believe that the decrease of the string breaking distance with density can be attributed to a further string breaking mechanism in dense matter. In dense two-color QCD, in addition to the possibility to break the string by a quark-antiquark pair, it becomes possible to break the string by two quarks which can be extracted from a two-color baryon – the scalar diquark. Notice also that it does not cost any energy to remove the scalar diquark from the condensate and break the string. As the result of this phenomenon, after the string breaking one end up with one heavy-light meson and one heavy-light diquark. Lattice studies show Braguta:2016cpw that in the region the scalar diquark condensate increases with the chemical potential, i.e. it becomes easier to find two quarks and to break the string.
If one increases the chemical potential then at some density becomes so small that the string cannot be created at all. Once created it will be immediately broken by the two-color baryons – the scalar diquarks. This is our hypothesis of the deconfinement mechanism in two-color dense quark matter.
The behavior of the string breaking distance in dense matter and the deconfinement mechanism are not specific only for two-color QCD. We believe that a similar process can be realized in SU(3) QCD with the difference that one has to replace two-quark baryon in SU(2) by three-quark baryon in SU(3). In particular, one can expect that the screening length which has the same definition as in two-color QCD is decreasing function of the chemical potential. in turn, the larger the density the smaller the string breaking distance. For three colors this behavior can be explained as follows: at nonzero chemical potential one has a nonzero baryon density in the system. Baryons which form this density can break the string, splitting it into one quark and one diquark. Notice that one does not need additional energy to create the baryon since the baryons are already present, due to the nonzero chemical potential. After the string breaking one has one heavy-light meson and heavy-light baryon. Finally the larger the the chemical potential, the larger the number of baryons which can break the string, i.e. the string breaking distance is a decreasing function of the chemical potential.
Notice that in three-color QCD one might also have a similar mechanism of deconfinement at finite density, as we proposed above for two-color. In particular, deconfinement takes place at the density at which the is so small that the string cannot be created.
In the previous section we considered the large distance behavior of the color singlet grand potential in the deconfined phase. In analogy with Debye screening in the Abelian theory and using leading order perturbation theory, we attempt to quantitatively describe the observed behavior and find good agreement with the lattice data.
We calculated the Debye mass and the coupling constant for various chemical potentials. The coupling constant extracted in this way takes on values , which tells us that despite the large baryon density, the system remains strongly coupled. It was also found that despite the large coupling constant the one-loop formula for the Debye mass works well at large distances within the uncertainty of the calculation.
In this paper we found that the region MeV physically differs from the region MeV. This manifests itself in different behavior of the following observables: the Polyakov line, the grand potential, the screening length , the Debye mass and effective coupling constant.
While we do not yet fully understand the physics, which is responsible for this behavior, one possibility is that the value of the chemical potential MeV is exceptional since it divides the region MeV with a spatial string tension from that at MeV where it vanishes. This may imply that the point MeV separates systems with and without magnetic screening. Further study in this direction is required.
Finally we are going to discuss lattice artifacts which result from the saturation effect. It is known that at large values of the chemical potential a saturation effect starts to be seen. The essence of this effect is that all lattice sites are filled with fermionic degrees of freedom, and it is not possible to put more fermions on the lattice (“Pauli blocking”). It is known that the saturation effect is accompanied by the decoupling of the gluons from fermions. Thus, effectively due to saturation, the system becomes simply gluodynamics, which is confined at low temperatures. From this consideration it is clear that in order to study the properties of quark matter at large baryon density one should have sufficiently small lattice spacing such that the properties are not spoiled by this kind of artificial confinement at large values of the chemical potential. We believe that because of the saturation effect the deconfinement in dense SU(2) matter has not been seen before.
The results of the study presented in this paper are obtained for the chemical potentials MeV (. We believe that our results are not spoiled by saturation for the following reasons. First, for the MeV (up to MeV Bornyakov:2017txe ) the spatial string tension is vanishing. Second, we do not see a respective rise of the timelike string tension. Moreover, the static potential for MeV (up to MeV Bornyakov:2017txe ) is well described by Debye screening potential. So, the properties of the system in the range MeV are very different from those of plain gluodynamics at small temperatures.
Notice also that in our previous study of dense two-color QCD Braguta:2016cpw we found that the onset of the saturation effects are seen at . This was deduced through the decrease of the diquark condensate for (while it is rising with for the ). The rise of the diquark condensate in the continuum is related to the rise of the Fermi surface. The decrease of the diquark condensate on the lattice is evidently related to the onset of the saturation effect what can be seen as follows. Due to finite number of the fermion states in the lattice Brillouin zone there is a chemical potential from which the rise of the chemical potential does not lead to the rise of the Fermi surface on the lattice. Notice that at this value of the chemical potential not all fermion states on the lattice are filled and the saturation takes place at larger values of the chemical potential.
Finally the deviation of the lattice measured baryon density from the baryon density calculated for free fermions is 10 % for ( 2000 MeV) and 20% for ( 2250 MeV). We argue that such a deviation even if it could be attributed to saturation cannot lead to considerable modification of physics. Notice also that such a deviation may also be explained by other mechanism than saturation, e.g. the finite lattice spacing which is present for any .
Taking into account all what is written above we believe that in the region under consideration in this paper, () our results are not spoiled by eventual saturation effects. Notice that the strict proof of last statement requires additional lattice simulations at smaller lattice spacing, which are planned in the future.
Appendix A The interaction potential of static quark-antiquark pair at zero density
In Appendix A we are going to calculate the interaction potential of static quark-antiquark pair at zero density through lattice measurement of Wilson loops. In this paper we use the in order to renormalize the correlation functions of the Polyakov lines.
For the calculation of Wilson loops we have employed one step of HYP smearing Hasenfratz:2001hp for temporal links with the smearing parameters according to the HYP2 parameter set DellaMorte:2005nwx , followed by 100 steps of APE smearing Albanese:1987ds for spatial links only with the smearing parameter . The similar smearing scheme was applied in the paper Bonati:2014ksa for the extraction of from the Wilson loops. In the case of spatial Wilson loops (see below) the smearing scheme was adopted respectively to consider one of the spatial directions as a “temporal direction” 555 The calculation of the other gluon observables, like the correlation function of Polyakov loops, color singlet/triplet free energy and etc., one step of HYP smearing with the same parameters was employed. .
Having measured Wilson loops for all distances between static charges one can calculate the interaction potential . Notice, however, that the interaction potential is determined up to a renormalization constant. We find this renormalization constant for the interaction potential at using the following procedure. It is known that for the distances Sommer:1993ce the interaction potential is well described by the linear confinement potential corrected by the so-called Lüscher term which describes string fluctuations
| (23) |
In order to calculate the interaction potential unambiguously we fit our lattice data by the potential . The fit is good and the constant is equal to . The renormalization constant determines the energy shift of the lattice potential as compared to (23). The renormalized lattice potential can be obtained through the shifting of the lattice potential down by and it reproduces the potential (23) for .
At the end of this section we would like to mention that the potential calculated as it was described above contains lattice artifacts at small distances . These artifacts result from the HYP smearing which modifies the potential at small distances and the violation of the rotation invariance by our lattice at short distances. However, the measurements of the correlators of the Polyakov lines and the Wilson loops are carried out with the same HYP smearing and on the same lattice. For this reason, the interaction potential determined in this section is appropriate for the renormalization of the Polyakov lines correlators.
Appendix B Quarkonia properties in two-color QCD
In Appendix B we are going to estimate the two-color quarkonia masses and their sizes using potential model. The background of all potential models is the interaction potential. In this paper we are going to use the Cornell potential PhysRevD.17.3090 of the form
| (24) |
Notice that the coefficient is front of the Coulomb term is due to colors in our system. In the calculation we use the string tension which was calculated in this paper. The effective coupling constant is extracted from the Cornell potential fit of our lattice data in the region . Thus we obtained the following value . Notice that this value a larger that that in SU(3) theory Kaczmarek:2005ui . We believe that the difference between two- and three-color QCD can be attributed to different RG running of the coupling constants. In particular, the two loops running of the coupling constant is given by the formula
| (25) |
with , The running is controlled by the coefficients which are different for and . More quantitatively if one takes , , for the and one has , whereas for the .
We use the non-relativistic Schrödinger equation with the potential 24 in order to estimate the quarkonia masses and sizes. In the calculation we take the charm quark mass from the paper PhysRevD.17.3090 . Having solved the equation numerically, one obtains the following values of the states energies and mean squared distance between quarks :
| E, MeV | 551.56 | 925.60 | 1132.60 |
| , fm | 0.41 | 0.61 | 0.76 |
Acknowledgements.
V. V. B. acknowledges the support from the BASIS foundation. N. Yu. A. acknowledges the support from the BASIS foundation and FAIR-Russia Research Center. The work of A. Yu. K. was supported by FAIR-Russia Research Center and RFBR grant 18-32-00071. The work of A. A. N. was supported by RFBR grant 18-32-00104. V. G. B. acknowledges the support by RFBR grant 16-02-01146. A. R. acknowledges partial support by the DFG funded collaborative research center SFB1225 “ISOQUANT”. This work has been carried out using computing resources of the federal collective usage center Complex for Simulation and Data Processing for Mega-science Facilities at NRC “Kurchatov Institute”, http://ckp.nrcki.ru/. In addition, the authors used the equipment of the shared research facilities of HPC computing resources at Lomonosov Moscow State University, the cluster of the Institute for Theoretical and Experimental Physics and the supercomputer of Joint Institute for Nuclear Research “Govorun”.References
- (1) S. Borsanyi, Frontiers of finite temperature lattice QCD, EPJ Web Conf. 137 (2017) 01006 [1612.06755].
- (2) M. D’Elia, Lattice QCD in background fields, J. Phys. Conf. Ser. 432 (2013) 012004.
- (3) B. B. Brandt, G. Endrodi and S. Schmalzbauer, QCD phase diagram for nonzero isospin-asymmetry, Phys. Rev. D97 (2018) 054514 [1712.08190].
- (4) P. Scior, L. von Smekal and D. Smith, Spectrum of QCD at Finite Isospin Density, EPJ Web Conf. 175 (2018) 07042 [1710.06314].
- (5) V. V. Braguta, V. A. Goy, E. M. Ilgenfritz, A. Yu. Kotov, A. V. Molochkov, M. Muller-Preussker et al., Two-Color QCD with Non-zero Chiral Chemical Potential, JHEP 06 (2015) 094 [1503.06670].
- (6) V. V. Braguta, E. M. Ilgenfritz, A. Yu. Kotov, B. Petersson and S. A. Skinderev, Study of QCD Phase Diagram with Non-Zero Chiral Chemical Potential, Phys. Rev. D93 (2016) 034509 [1512.05873].
- (7) V. V. Braguta and A. Yu. Kotov, Catalysis of Dynamical Chiral Symmetry Breaking by Chiral Chemical Potential, Phys. Rev. D93 (2016) 105025 [1601.04957].
- (8) O. Kaczmarek, F. Karsch, P. Petreczky and F. Zantow, Heavy quark anti-quark free energy and the renormalized Polyakov loop, Phys. Lett. B543 (2002) 41 [hep-lat/0207002].
- (9) O. Kaczmarek, F. Karsch, F. Zantow and P. Petreczky, Static quark anti-quark free energy and the running coupling at finite temperature, Phys. Rev. D70 (2004) 074505 [hep-lat/0406036].
- (10) O. Kaczmarek and F. Zantow, Static quark anti-quark interactions in zero and finite temperature QCD. I. Heavy quark free energies, running coupling and quarkonium binding, Phys. Rev. D71 (2005) 114510 [hep-lat/0503017].
- (11) O. Kaczmarek and F. Zantow, Static quark anti-quark interactions at zero and finite temperature QCD. II. Quark anti-quark internal energy and entropy, hep-lat/0506019.
- (12) WHOT-QCD collaboration, Y. Maezawa, S. Aoki, S. Ejiri, T. Hatsuda, N. Ishii, K. Kanaya et al., Electric and Magnetic Screening Masses at Finite Temperature from Generalized Polyakov-Line Correlations in Two-flavor Lattice QCD, Phys. Rev. D81 (2010) 091501 [1003.1361].
- (13) Y. Maezawa, T. Umeda, S. Aoki, S. Ejiri, T. Hatsuda, K. Kanaya et al., Application of fixed scale approach to static quark free energies in quenched and 2+1 flavor lattice QCD with improved Wilson quark action, Prog. Theor. Phys. 128 (2012) 955 [1112.2756].
- (14) TUMQCD collaboration, A. Bazavov, N. Brambilla, P. Petreczky, A. Vairo and J. H. Weber, Color screening in (2+1)-flavor QCD, Phys. Rev. D98 (2018) 054511 [1804.10600].
- (15) C. S. Fischer, L. Fister, J. Luecker and J. M. Pawlowski, Polyakov loop potential at finite density, Phys. Lett. B732 (2014) 273 [1306.6022].
- (16) N. O. Agasian, M. S. Lukashov and Yu. A. Simonov, Nonperturbative SU(3) thermodynamics and the phase transition, Eur. Phys. J. A53 (2017) 138 [1701.07959].
- (17) A. Bazavov et al., The QCD Equation of State to from Lattice QCD, Phys. Rev. D95 (2017) 054504 [1701.04325].
- (18) J. N. Guenther, R. Bellwied, S. Borsanyi, Z. Fodor, S. D. Katz, A. Pasztor et al., The QCD equation of state at finite density from analytical continuation, Nucl. Phys. A967 (2017) 720 [1607.02493].
- (19) M. D’Elia, G. Gagliardi and F. Sanfilippo, Higher order quark number fluctuations via imaginary chemical potentials in QCD, Phys. Rev. D95 (2017) 094503 [1611.08285].
- (20) M. Buballa, NJL model analysis of quark matter at large density, Phys. Rept. 407 (2005) 205 [hep-ph/0402234].
- (21) M. G. Alford, A. Schmitt, K. Rajagopal and T. Schäfer, Color superconductivity in dense quark matter, Rev. Mod. Phys. 80 (2008) 1455 [0709.4635].
- (22) M. A. Andreichikov, M. S. Lukashov and Yu. A. Simonov, Nonperturbative quark–gluon thermodynamics at finite density, Int. J. Mod. Phys. A33 (2018) 1850043 [1707.04631].
- (23) J. B. Kogut, M. A. Stephanov and D. Toublan, On two color QCD with baryon chemical potential, Phys. Lett. B464 (1999) 183 [hep-ph/9906346].
- (24) J. B. Kogut, M. A. Stephanov, D. Toublan, J. J. M. Verbaarschot and A. Zhitnitsky, QCD - like theories at finite baryon density, Nucl. Phys. B582 (2000) 477 [hep-ph/0001171].
- (25) D. T. Son and M. A. Stephanov, QCD at finite isospin density, Phys. Rev. Lett. 86 (2001) 592 [hep-ph/0005225].
- (26) O. Janssen, M. Kieburg, K. Splittorff, J. J. M. Verbaarschot and S. Zafeiropoulos, Phase Diagram of Dynamical Twisted Mass Wilson Fermions at Finite Isospin Chemical Potential, Phys. Rev. D93 (2016) 094502 [1509.02760].
- (27) S. Hands, J. B. Kogut, M.-P. Lombardo and S. E. Morrison, Symmetries and spectrum of SU(2) lattice gauge theory at finite chemical potential, Nucl. Phys. B558 (1999) 327 [hep-lat/9902034].
- (28) S. Muroya, A. Nakamura and C. Nonaka, Behavior of hadrons at finite density: Lattice study of color SU(2) QCD, Phys. Lett. B551 (2003) 305 [hep-lat/0211010].
- (29) J. B. Kogut, D. Toublan and D. K. Sinclair, The Phase diagram of four flavor SU(2) lattice gauge theory at nonzero chemical potential and temperature, Nucl. Phys. B642 (2002) 181 [hep-lat/0205019].
- (30) S. Cotter, P. Giudice, S. Hands and J.-I. Skullerud, Towards the phase diagram of dense two-color matter, Phys. Rev. D87 (2013) 034507 [1210.4496].
- (31) V. V. Braguta, E. M. Ilgenfritz, A. Yu. Kotov, A. V. Molochkov and A. A. Nikolaev, Study of the phase diagram of dense two-color QCD within lattice simulation, Phys. Rev. D94 (2016) 114510 [1605.04090].
- (32) L. Holicki, J. Wilhelm, D. Smith, B. Wellegehausen and L. von Smekal, Two-colour QCD at finite density with two flavours of staggered quarks, PoS LATTICE2016 (2017) 052 [1701.04664].
- (33) V. G. Bornyakov, V. V. Braguta, E. M. Ilgenfritz, A. Yu. Kotov, A. V. Molochkov and A. A. Nikolaev, Observation of deconfinement in a cold dense quark medium, JHEP 03 (2018) 161 [1711.01869].
- (34) P. Weisz, Continuum Limit Improved Lattice Action for Pure Yang-Mills Theory. 1., Nucl. Phys. B212 (1983) 1.
- (35) G. Curci, P. Menotti and G. Paffuti, Symanzik’s Improved Lagrangian for Lattice Gauge Theory, Phys. Lett. 130B (1983) 205.
- (36) P. Hasenfratz and F. Karsch, Chemical Potential on the Lattice, Phys. Lett. 125B (1983) 308.
- (37) J. B. Kogut, D. K. Sinclair, S. J. Hands and S. E. Morrison, Two color QCD at nonzero quark number density, Phys. Rev. D64 (2001) 094505 [hep-lat/0105026].
- (38) J. B. Kogut, D. Toublan and D. K. Sinclair, Diquark condensation at nonzero chemical potential and temperature, Phys. Lett. B514 (2001) 77 [hep-lat/0104010].
- (39) A. Bazavov et al., The chiral and deconfinement aspects of the QCD transition, Phys. Rev. D85 (2012) 054503 [1111.1710].
- (40) A. Hasenfratz and F. Knechtli, Flavor symmetry and the static potential with hypercubic blocking, Phys. Rev. D64 (2001) 034504 [hep-lat/0103029].
- (41) M. Della Morte, A. Shindler and R. Sommer, On lattice actions for static quarks, JHEP 08 (2005) 051 [hep-lat/0506008].
- (42) APE collaboration, M. Albanese et al., Glueball Masses and String Tension in Lattice QCD, Phys. Lett. B192 (1987) 163.
- (43) C. Bonati, M. D’Elia, M. Mariti, M. Mesiti, F. Negro, A. Rucci et al., Screening masses in strong external magnetic fields, Phys. Rev. D95 (2017) 074515 [1703.00842].
- (44) C. Bonati, M. D’Elia, M. Mariti, M. Mesiti, F. Negro and F. Sanfilippo, Anisotropy of the quark-antiquark potential in a magnetic field, Phys. Rev. D89 (2014) 114502 [1403.6094].
- (45) T. Boz, P. Giudice, S. Hands, J.-I. Skullerud and A. G. Williams, Two-color QCD at high density, AIP Conf. Proc. 1701 (2016) 060019 [1502.01219].
- (46) S. Hands, S. Kim and J.-I. Skullerud, Deconfinement in dense 2-color QCD, Eur. Phys. J. C48 (2006) 193 [hep-lat/0604004].
- (47) S. Hands, S. Kim and J.-I. Skullerud, A Quarkyonic Phase in Dense Two Color Matter?, Phys. Rev. D81 (2010) 091502 [1001.1682].
- (48) S. Nadkarni, Nonabelian Debye Screening. 1. The Color Averaged Potential, Phys. Rev. D33 (1986) 3738.
- (49) T. Boz, S. Cotter, L. Fister, D. Mehta and J.-I. Skullerud, Phase transitions and gluodynamics in 2-colour matter at high density, Eur. Phys. J. A49 (2013) 87 [1303.3223].
- (50) R. Sommer, A New way to set the energy scale in lattice gauge theories and its applications to the static force and alpha-s in SU(2) Yang-Mills theory, Nucl. Phys. B411 (1994) 839 [hep-lat/9310022].
- (51) E. Eichten, K. Gottfried, T. Kinoshita, K. D. Lane and T. M. Yan, Charmonium: The model, Phys. Rev. D 17 (1978) 3090.