-decay properties of neutron-rich Ca, Ti, and Cr isotopes
Abstract
-decay properties of neutron-rich Ca, Ti, and Cr isotopes are studied within a deformed proton-neutron quasiparticle random-phase approximation. The underlying mean field is described self-consistently from deformed Skyrme Hartree-Fock calculations with pairing correlations. Residual spin-isospin interactions in the particle-hole and particle-particle channels are also included in the formalism. The energy distributions of the Gamow-Teller strength, the -decay feedings, the -decay half-lives, and the -delayed neutron emission probabilities are discussed and compared with other theoretical results, as well as with the available experimental information. The evolution of these nuclear -decay properties is investigated in isotopic chains in a search for structural changes. A reliable estimate of the -decay properties in this mass region is a valuable information for evaluating decay rates in astrophysical scenarios.
pacs:
21.60.Jz, 23.40.Hc, 27.50.+eI Introduction
The study of neutron-rich nuclei in the mass region determined by and has attracted recently increasing interest from both theoretical and experimental sides for different reasons. From a purely nuclear structure point of view, one of the most intriguing peculiarities characterizing this region is the appearance of effects compatible with sub-shell closures. As a matter of fact, the existence of a sub-shell closure at seems to be well established experimentally in Ca, Ti, and Cr according to the systematics of the energies in the isotopic evolution and from recent mass measurements performed at ISOLDE/CERN wienholtz13 . -decay properties, the identification of the first excited states, and deduced transition probabilities support that conclusion as well, and in addition indicates the existence of an shell closure, see crawford10 ; steppenbeck13 ; mantica08 and references therein. In this context it is also of interest that the shell closure was recently challenged by the unexpectedly large charge radii measurements reported in garcia16 , but apart from the interpretation provided in garcia16 alternative explanations exist saperstein16 . It has also been argued from shell-model calculations that an eventual inversion of the and orbitals could create in this mass region a sub-shell closure at honma05 . Indeed, the spectroscopy of high spin states in Ti isotopes suggests that these orbitals are practically degenerate fornal2004 . With increasing neutron number in the vicinity of a new island of inversion is predicted and deformation sets in lenzi10 ; crawford13 ; aoi09 ; gade14 .
As we move away from stability, finding magicity evidence from spectroscopic studies becomes more and more difficult because of the present limitations regarding production rates and because of the short lifetimes inherent to the exotic nuclei. Thus, the study of other indirect indications based on the decay properties, such as -strength distributions, -decay half-lives , and -delayed neutron emission probabilities , might be worthwhile. The decay patterns of such exotic nuclei represent a unique possibility to learn about their nuclear structure. As an example, a sudden shortening of half-lives, associated with magicity, was observed in Ni isotopes beyond xu2014 , but not in neighbor chains.
Whereas the -strength distribution contains detailed information about the structure of nuclei involved in the decay, and are integral quantities that characterize globally the decay. The ideal test for a nuclear model would be to compare the calculated -strength distribution with measurements, but unfortunately, this is a difficult experimental task. -decay half-lives and probabilities are, on the other hand, easier to measure. In particular, are very interesting quantities in neutron-rich nuclei. As we move away from stability toward the neutron-rich side, the neutron separation energy decreases until eventually a zero value is reached at the drip lines. When becomes lower than the energy, neutron-unbound excited states above can be populated by -decay in the daughter nucleus that subsequently may decay by neutron or -ray emission. -delayed neutron emission appears as an additional decay mechanism characterized by the emission of neutrons after -decay. We should not forget that is sensitive to the -strength distribution and thus, to the nuclear structure itself.
The interest in neutron-rich nuclei in this mass region is not only due to their special nuclear structure characteristics. In nuclear reactor physics, -decay half-lives and delayed neutron emission of the sub-products of the fission processes valencia17 are also crucial quantities for controlling safety in reactors. -decays of nuclei in this mass region play also a key role in nuclear astrophysics because they take part in the URCA process gamow45 . This is a cooling mechanism acting on white dwarfs, type Ia supernovae, and neutron stars, which is caused by neutrino and anti-neutrino emission generated in cycles of electron captures and -decays, respectively. Nuclei in the mass region studied in this work are among those identified to have the highest cooling rates in the URCA process schatz14 . Proper understanding of this mechanism requires knowledge of the decay properties of neutron-rich nuclei and the underlying nuclear physics may play a role comparable to the astrophysical environment to account quantitatively for these processes.
Besides shell-model type calculations langanke03 ; zhi13 ; kumar16 , the quasiparticle random-phase approximation has proved over the years to be a well suited model to describe medium-mass open-shell nuclear properties and particularly -decay properties within the proton-neutron quasiparticle random-phase approximation (pnQRPA). pnQRPA calculations for neutron-rich nuclei have been carried out within different spherical formalisms based on Hartree-Fock-Bogoliubov method engel , on Fayans density functionals with continuum QRPA borzov3 , and on relativistic mean field approaches niksic05 ; marketin16 . Deformed pnQRPA formalisms based on phenomenological mean fields with separable residual forces moller1 ; moller3 ; homma ; hir2 and with more realistic CD-Bonn residual forces fang13 ; ni14 are also available. Various self-consistent deformed pnQRPA calculations to describe the -decay properties, either with Skyrme yoshida13 ; mustonen16 or Gogny peru14 interactions are also available in the literature.
In Refs. sarripere ; sarri14 ; sarri15 the decay properties of neutron-rich isotopes in the mass region and were studied within a deformed pnQRPA based on a self-consistent Hartree-Fock (HF) mean field formalism with Skyrme interactions and pairing correlations in the BCS approximation. Residual spin-isospin interactions were also included in the particle-hole (ph) and particle-particle (pp) channels sarri1 ; sarri2 . The study was extended in Ref. sarri_rare to cover the decay properties of neutron-rich rare-earth isotopes. The reliability of the method was also tested experimentally with the decay properties of deformed neutron-deficient medium-mass isotopes sarri_wp ; sarri_rp . The purpose of this work is the study of the unstable even-even 50-64Ca, 52-66Ti, and 56-70Cr isotopes within a similar theoretical formalism. The calculations will be tested with the available experimental information on half-lives. Then, predictions are made for the Gamow-Teller (GT) strength distributions and for the half-lives and neutron emission probabilities of more exotic nuclei not yet measured.
These calculations are timely because the mass region addressed is at the borderline of present experimental capabilities for measuring half-lives and -delayed neutrons. There is increasing experimental activity focused to extend our knowledge about the decay properties of neutron-rich nuclei in different mass regions crawford10 ; xu2014 ; sorlin99 ; hosmer05 ; pereira ; nishimura11 ; caballero16 ; madurga16 ; wu17 . See also Ref. dillmann18 for a recent review of the experimental status at RIKEN on this topic. GT strength distributions of stable -shell nuclei have been also measured with charge-exchange reactions fujita14 .
The paper is organized as follows. In Sec. II we present briefly the theoretical formalism needed for the calculation of the -decay properties. In Sec. III we report and discuss our results for the energy curves, GT strength distributions, half-lives, and -delayed neutron emission. Section IV summarizes the main conclusions.
II Theoretical Formalism
A brief summary of the theoretical formalism used in this paper to describe the -decay properties in neutron-rich isotopes is presented here. Further details can be found elsewhere sarri1 ; sarri2 .
We start from a self-consistent calculation of the mean field in terms of a deformed Hartree-Fock calculation with Skyrme interactions and pairing correlations in the BCS approximation. The Skyrme interaction SLy4 sly4 is selected for the calculations because of its ability to account successfully for a large variety of nuclear properties all along the nuclear chart bender08 ; stoitsov . Single-particle energies, wave functions, and occupation amplitudes are generated in this way. The solution of the HF equations is found by using the formalism developed in Ref. vautherin , assuming time reversal and axial symmetry. The single-particle wave functions are expanded into the eigenstates of a harmonic oscillator with axial symmetry in cylindrical coordinates, using twelve major shells. The pairing gap energies for protons and neutrons in the BCS approximation are determined phenomenologically from the experimental odd-even mass differences audi12 . We also perform constrained HF calculations to construct potential-energy curves (PECs), where the HF energy is minimized under the constraint of keeping fixed the nuclear quadrupole deformation.
In the next step, the -decay strengths are calculated for the equilibrium shapes of each nucleus, that is, for the minima obtained in the PECs. Since decays connecting different shapes are disfavored, similar shapes are assumed for the ground state of the parent nucleus and for all populated states in the daughter nucleus moller1 ; homma ; boillos .
To describe GT transitions, we add to the mean field separable spin-isospin residual interactions in the ph and pp channels, which are treated in a deformed pnQRPA moller1 ; moller3 ; homma ; hir2 ; sarri1 ; sarri2 . According to previous calculations within this formalism sarripere ; sarri14 ; sarri15 ; sarri_rare , we use the values MeV and MeV for the coupling strengths of the residual interaction in the ph and pp channels, respectively.
The GT transition amplitudes in the intrinsic frame connecting the ground state of an even-even nucleus to one phonon states in the daughter nucleus are found to be
| (1) |
with
| (2) |
in terms of the occupation amplitudes for neutrons and protons () and the matrix elements of the spin operator, , connecting proton and neutron single-particle states, as they come out from the HF+BCS calculation. and are the forward and backward amplitudes of the pnQRPA phonon operator, respectively.
Once the intrinsic amplitudes in Eq. (1) are calculated, the GT strength in the laboratory system for a transition can be evaluated. Using the Bohr-Mottelson factorization bm to express the initial and final states in the laboratory system in terms of intrinsic states, we arrive at
| (3) | |||||
in units. The strength distributions will be relative to the excitation energy in the daughter nucleus, and are given by
| (4) |
where and are the lowest quasiparticle energies for protons and neutrons, respectively.
The -decay half-life is obtained by summing all the allowed transition strengths to states in the daughter nucleus with excitation energies lying below the corresponding -energy,
| (5) | |||||
written in terms of the nuclear masses or nuclear binding energies and the neutron , proton , and electron mass . The half-lives could be calculated in a quasiparticle approximation that avoids a direct calculation of in terms of the parent and daughter masses engel . This is achieved by expressing the binding energy of the daughter nucleus in terms of the binding energy of the parent, the Fermi energies for protons and neutrons and the energy of the lowest two-quasiparticle excitation . In the present work we prefer to evaluate directly from the binding energies of parent and daughter nuclei. This formulation is convenient to compare half-lives calculated from different values that can be taken directly from experimental masses or from various existing mass formulas. Actually, the values obtained for from binding energies and from the approximation in terms of Fermi levels and quasiparticle energies are very close to each other.
The weighting coefficients are given by the phase space factors ,
| (6) |
with s and , where 0.77 is a standard quenching factor and . The same quenching factor is included in all the figures shown later for the GT strength distributions. The Fermi integral is computed numerically for each value of the energy including screening and finite size effects, as explained in Ref. gove .
In this work we consider only allowed GT transitions. It is well known that first-forbidden (FF) transitions gain relevance as increases because the corresponding phase-space factors involve a quadratic dependence on the -energy (), which is absent in allowed GT transitions. As a result, the phase factors for allowed transitions scale as , whereas for forbidden transitions they scale as . Consequently, one should take care of FF transitions as becomes larger in very neutron-rich nuclei. Nevertheless, the calculations available for the FF strength in this mass region, based on different QRPA approaches marketin16 ; mustonen16 , show that although the relative contribution of FF transitions to the total rates increases with as the number of neutrons increases, their contribution never exceeds an 8% effect in Ref. mustonen16 and a 13% effect in Ref. marketin16 for the heaviest isotopes of Ca, Ti, and Cr considered in this work. They are much smaller in lighter isotopes. Thus, according to those works, taking into account FF transitions will reduce the half-lives by 10% at most in the heaviest nuclei considered in each isotopic chain and by a negligible amount in lighter isotopes. This is not a relevant contribution for the purpose of this paper and can be safely neglected.
The -feedings (%) are given by
| (7) |
The probability of -delayed neutron emission is given by
| (8) |
where the sums extend to all the excitation energies in the daughter nuclei in the indicated ranges. is the one-neutron separation energy in the daughter nucleus. According to Eq. (8), is mostly sensitive to the strength located at energies around , thus providing a structural probe complementary to . Eq. (8) assumes that all the decays to excited states in the daughter nucleus with energies above always lead to delayed neutron emission and then, -decay from neutron unbound levels is neglected. Recent studies coupling the microscopic QRPA and the statistical Hauser-Feshbach model show that the competition between neutron and emission can modify the neutron emission probabilities in a way that depends on the system considered, but is enhanced when approaching the neutron drip-lines kawano08 ; mumpower16 .
III Results and discussion
We first show the results obtained for the PECs in the isotopes studied. The energy distribution of the GT strength corresponding to the local minima of the PECs is studied afterwards. Finally, half-lives and -delayed neutron emission probabilities are computed.
III.1 Potential Energy Curves
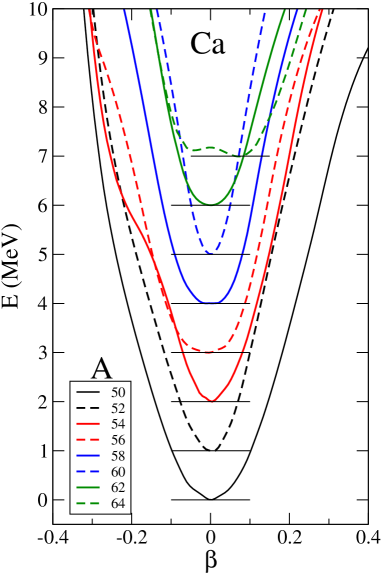
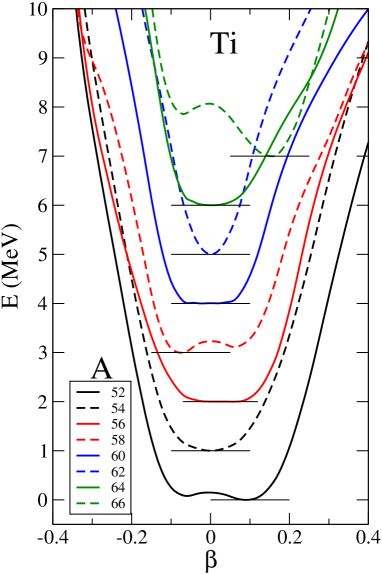
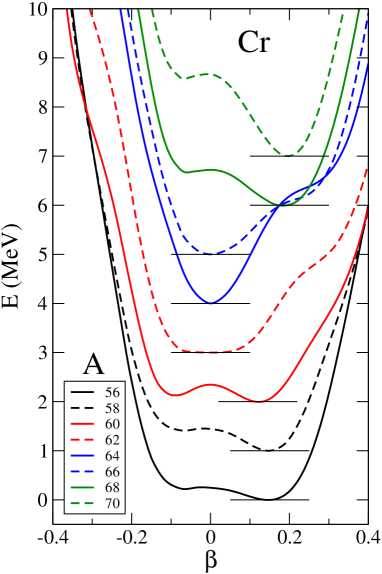
In Figs. (1 - 3), we show the PECs obtained from SLy4, relative to the ground state energy, as a function of the quadrupole deformation for neutron-rich Ca (), Ti (), and Cr (), respectively. Neutron numbers cover the range . For a better comparison, the plot corresponding to each isotope has been shifted by 1 MeV relative to the neighbor lighter isotope.
In Fig. 1 we observe spherical solutions in practically all semi-magic Ca isotopes. Only the heavier 64Ca with the last neutrons occupying partially the orbital exhibits deformed solutions. We also observe that 52Ca () and 60Ca () show relatively sharper profiles, as they correspond to the extra stability provided by the and sub-shell closures, respectively. Fig. 2 for Ti isotopes shows a more involved structure of the PECs. Similarly to the above case of Ca isotopes, we observe a tendency toward spherical shapes in 54Ti () and 62Ti (), related to the same sub-shell closures mentioned above, but in general the PECs are not so sharp as for Ca isotopes and deformed shapes, oblate and prolate, are developed between sub-shell closures. Fig. 3 for Cr isotopes shows in most cases prolate structures that become more pronounced as we move away from 64Cr where the sub-shell closure at is still manifest. In some cases a second minima in the oblate sector appears, although it is very shallow and not well separated from the prolate minimum by energy barriers.

III.2 Gamow-Teller strength distributions
The energy distribution of the GT strength is quite important to constrain the underlying nuclear structure. For a theoretical model, it represents a more demanding test than just reproducing half-lives that are integral quantities obtained from these strength distributions properly weighted with phase factors (see Eq. (6)). This is of especial importance in astrophysical scenarios of high densities and temperatures that cannot be reproduced in the laboratory. Given that the phase factors in the stellar medium are different from those in the laboratory, to describe properly the decay rates under extreme conditions of density and temperature, it is not sufficient to reproduce the half-lives in the laboratory. One needs, in addition, to have a reliable description of the GT strength distributions.
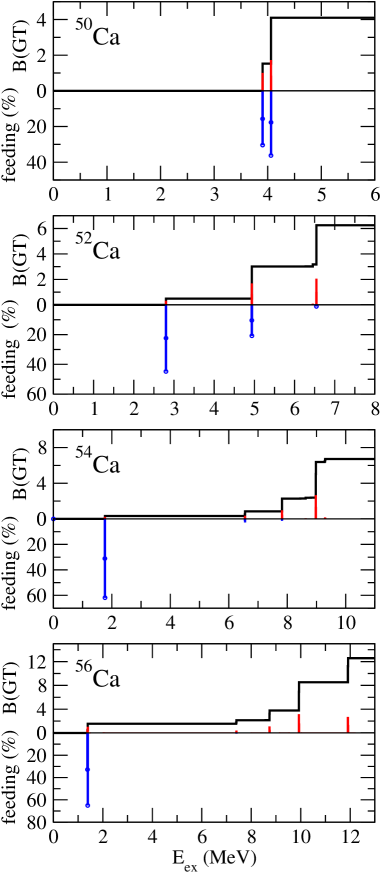
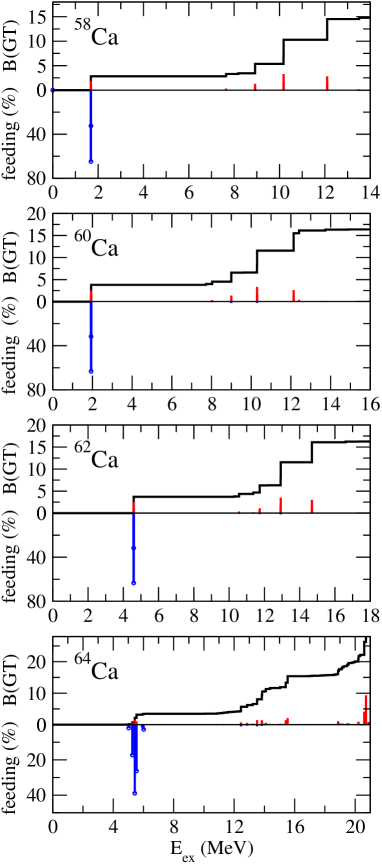
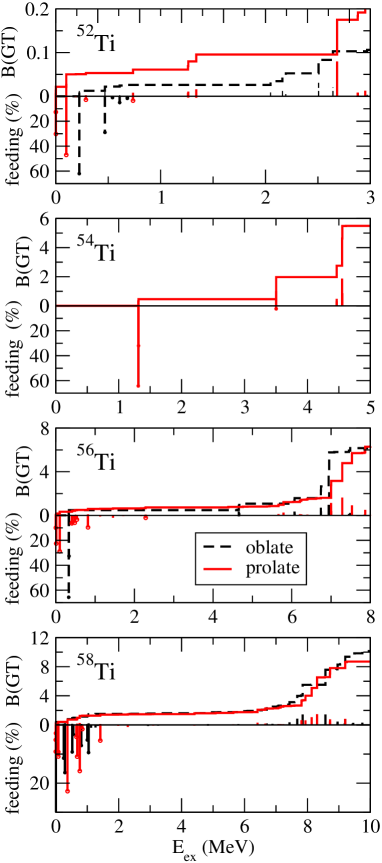
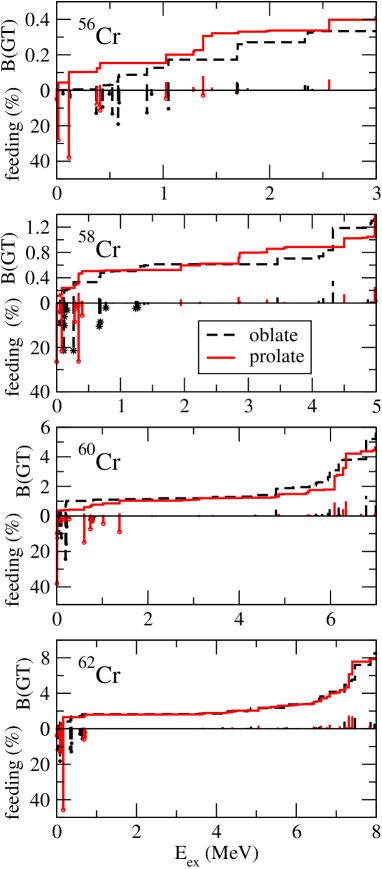
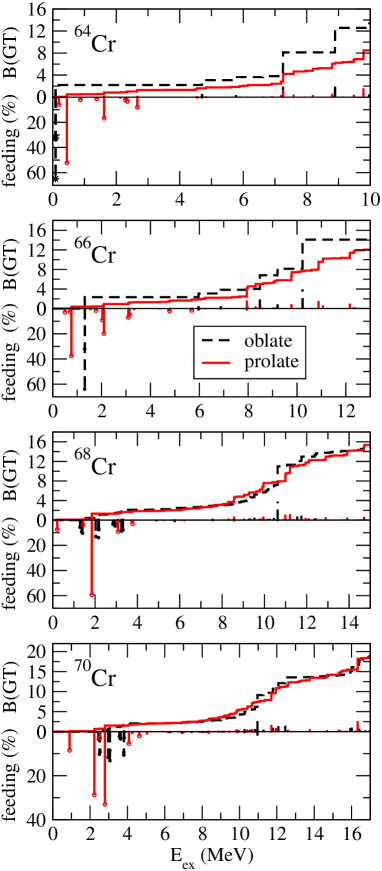
In Figs. (4-9), we show in the upper plots of each panel the results for the energy distributions of the quenched GT strength (BGT). We can see both the individual GT strengths and the cumulative sums that give the total strength accumulated up to a given energy. In the lower plots we show the -feedings from Eq. (7). They are plotted versus the excitation energy of the daughter nucleus. The results correspond to the (oblate-prolate-spherical) equilibrium shapes for which we obtained minima in the PECs. The interval of excitation energies for each isotope is limited by the energy, which is the relevant energy range for the calculation of the decay properties.
In Figs. 4 and 5 we show the results for Ca isotopes. In this case, according to the PECs in Fig. 1, calculations from one single shape (spherical) are performed. Although the GT strengths are calculated within pnQRPA, it is worth analyzing their distributions in terms of quasiparticle transitions that offer a simple and natural tool to interpret the underlying excitation mechanism. In the case of Ca isotopes this analysis can be made in terms of the spherical orbitals. In allowed transitions parity is conserved and therefore, only orbitals in the -shell are connected by the GT operator, except in the heavier isotopes where transitions within the shell start to contribute as well. Thus, the low-lying GT strength in all Ca isotopes studied correspond to the transition . The excitation energy of this transition is stabilized in the vicinity of 2 MeV, except for the lighter 50,52Ca and the heavier 62,64Ca isotopes, where the excitation occurs at somewhat higher energies. These transitions account for most of the feeding in the decay. After a relatively large energy gap without strength, we find next in energy transitions corresponding to , , and . These transitions are responsible for the structure of peaks observed in 54-58Ca, as we populate with neutrons the and orbitals. The GT strength patterns of these isotopes are very similar to each other.
Other competing transitions between negative parity partners also appear either at higher energies or having smaller strength. In the heavier isotopes 62,64Ca, transitions between positive parity states appear beyond 10 MeV. In the case of 64Ca, the GT strength appears more fragmented because of the effect of deformation that splits energetically the spherical orbitals. In this case the results correspond to the prolate minimum in the PEC of Fig. 1.
In the cases of Ti and Cr isotopes (Figs. 6 - 9), the analysis can be done similarly, but the interpretation is more involved because of the large fragmentation caused by deformation. The PECs of Ti isotopes in Fig. 2 show that 54Ti, 62Ti, and 64Ti are spherical and the corresponding GT strength distributions show profiles characterized by isolated peaks similar to those for Ca isotopes discussed above. Actually, the analysis of the structure of these transitions shows that the low-lying excitations correspond again to and similarly for the analysis of higher excitations. In the case of deformed shapes, the strength is clearly more fragmented and the analysis should be done in terms of Nilsson states. Cr isotopes, in figures 8 and 9, show clear deformed patterns, except in the case of 54Cr with related to the sub-shell closure.
The general structure observed in the profiles of the strength distributions in this mass region is then characterized by some strength at very low excitation energy that, although not very large, carries most of the feeding and is very significant to determine the half-lives. Then, there is a large energy region of several MeV with practically no strength, and a higher energy region where the strength concentrates.
The calculations the GT strength distributions for the various equilibrium shapes show us the sensitivity of these observables to the nuclear shape. It has been shown in the past that in particular cases, a strong sensitivity of the distribution profiles to the deformation is apparent. This feature was exploited to gain information about the nuclear shape of the decaying nucleus exppoirier ; expnacher ; expperez ; expestevez ; expbriz . In the present case, the effect of the nuclear shape on the GT strength distributions is of minor importance, as shown in Figs. 6 - 9.
III.3 Half-lives and -delayed neutron-emission probabilities
In this section we present the results for and . The calculation of the half-lives in Eq. (6) involves knowledge of the GT strength distribution as well as of the energies. The calculation of requires in addition knowledge of the one-neutron separation energies in the daughter nuclei . Experimental values of these quantities based on nuclear masses are available for some of the isotopes studied, but not for the most exotic. Then, in order to present a unified description of all the isotopes, we use in this work and energies evaluated from theoretical calculations of the masses, based on the SLy4 Skyrme force.
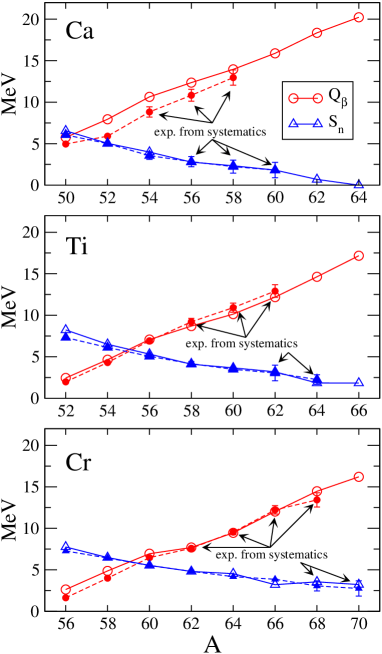
Fig. 10 shows a comparison between calculated and experimental and energies. Experimental data with error bars are taken from Ref. audi12 and plotted with solid symbols, circles for and triangles for . Arrows point to the energies that are not directly measured, but are taken from systematics. The calculated energies are plotted with similar open symbols. The agreement with experiment is quite satisfactory, except in the values of the lighter Ca isotopes, where the data are overestimated.
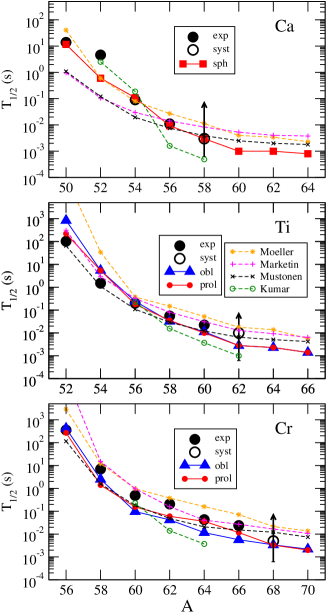
In Fig. 11 we show our results for the -decay half-lives in the Ca, Ti, and Cr isotopic chains. The results are compared with experiment audi12 (open circles are taken from systematics). We also compare our results with other theoretical calculations. The results labeled as ’Moeller’ moller3 include contributions from GT and first-forbidden transitions. While the former correspond to microscopic pnQRPA calculations using a Yukawa single-particle Hamiltonian and a separable residual interaction in the ph channel, the latter are obtained from a statistical gross theory. The and energies are evaluated from the masses calculated in the finite-range droplet model. The calculations are done without any quenching of the axial-vector coupling constant . The results labeled as ’Marketin’ marketin16 correspond to a relativistic formalism that includes FF transitions with masses calculated from the same model. Spherical symmetry is assumed in these calculations and quenched values are used in both GT and FF. The results labeled as ’Mustonen’ mustonen16 are based on Skyrme pnQRPA for axially deformed even-even nuclei. Masses are calculated consistently with the same interaction and quenching of is only included for GT transitions. Finally, the half-lives labeled as ’Kumar’ kumar16 correspond to shell-model results.
The agreement of our results with experiment is in general satisfactory. The general trends are well reproduced, although discrepancies are found in particular cases. This is the case of 52Ca, where we underestimate the half-life. In the case of Ti isotopes the agreement is fairly good, although the lighter isotopes 52,54Ti are overestimated. For Cr isotopes we underestimate the data, especially in 58,60,62Cr isotopes. Results from oblate and prolate shapes in Ti and Cr isotopes can be also observed in the figure. In most cases, prolate configurations seem to describe the data somewhat better and this sensitivity could be exploited experimentally to discriminate in favor of one of the shapes.
The agreement of our results with experiment is comparable to the agreement obtained with the other calculations from different theoretical formalisms. The results from Ref. moller3 show a general tendency to overestimate the half-lives, whereas those of Ref. kumar16 tend to underestimate the data. In Ca isotopes the calculations from both calculations marketin16 and mustonen16 clearly underestimate the data in the lighter isotopes. The agreement with Ti isotopes is remarkable in both calculations. In the case of Cr isotopes, results from Ref. marketin16 (mustonen16 ) tend to overestimate (underestimate) the experiment.
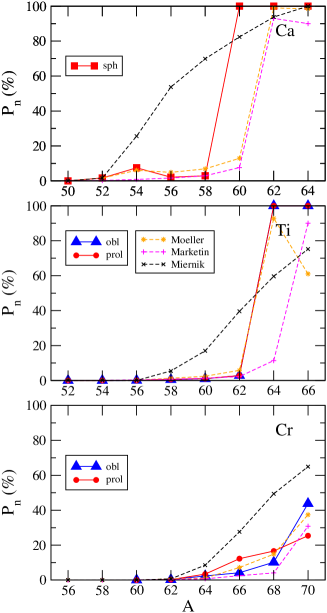
Fig. 12 depicts the results for . Our results for the various shapes are compared with results from Refs. moller3 ; marketin16 , as well as with the results from Miernik miernik13 that correspond to a phenomenological model based on a statistical level density function with masses obtained from the Skyrme interaction HFB-21. Unfortunately, there are no experimental data available yet for these isotopes, but measurements of values and half-lives are under consideration in this region within the BRIKEN Collaboration dillmann18 at RIKEN.
Our results, as well as the other microscopic calculations, show a sudden shift from almost zero values of to practically 100 % in Ca and Ti isotopes. This is related to fact that the lack of fragmentation in the GT strength distribution makes the energy very critical to determine whether or not all the strength is contained beyond . Thus, in 58Ca the energy MeV is above the energy 1.68 MeV that receives practically all the feeding, while not generating neutron emission. On the other hand, in 60Ca the energy MeV is already below the energy 1.92 MeV that receives the feeding. Then, almost all the feeding in the decay is received by unbound states. Similarly in the case of Ti isotopes, is almost zero in 62Ti because MeV is clearly above the excitation energy 0.34 MeV that takes all the feeding, whereas in 64Ti, MeV is below the excitation energy 2.53 MeV that receives the most of the feeding. This effect does not happen in deformed nuclei, where the fragmentation of the strength makes the exact position of not so critical, and consequently increases smoothly. This is the case of the Cr isotopes where the fragmented strength induced by deformation is translated into a more continuous increase of , causing a sensitivity to the nuclear shape that could be exploited experimentally.
IV Summary and Conclusions
-decay properties including energy distributions of the GT strength and feedings, half-lives, and delayed neutron emission are studied in neutron-rich even-even Ca, Ti, and Cr isotopic chains. This mass region is important for the isotopic evolution of nuclear structural effects. Nuclei in this mass region are also implicated in the astrophysical URCA process, a neutrino cooling mechanism at work in white dwarfs and neutron stars.
The theoretical approach is based on a pnQRPA on top of a deformed HF+BCS with Skyrme forces. Residual forces in the ph and pp channels are included as well. We first calculate the GT strength distributions that result from the underlying nuclear structure and from which other integral quantities are evaluated afterwards. Unfortunately, there are still no data on strength distributions to compare with, and these calculations are for the moment predictions. The results are compared with the experimental information available on half-lives. In general we get a fair agreement, which is comparable with the agreement achieved with other calculations using different theoretical approaches. -delayed neutron emission probabilities are also calculated and compared with the results from other models. These calculations are timely because of the increased capabilities of modern existing facilities (RIKEN,NCSL-MSU) and new setups to reach more exotic nuclei and measure these quantities. The results presented in this work will also allow further testing of different theoretical models for calculations of the decay properties of exotic nuclei of astrophysical interest.
Acknowledgements.
This work was supported by Ministerio de Economía y Competitividad (Spain) under Contracts FIS2014-51971-P, FPA2014-52823-C2-1-P, and the Severo Ochoa program (SEV-2014-0398).References
- (1) F. Wienholtz et al., Nature 498, 346 (2013).
- (2) H. L. Crawford et al., Phys. Rev. C 82, 014311 (2010).
- (3) D. Steppenbeck et al., Nature 502, 207 (2013).
- (4) P. F. Mantica et al., Phys. Rev. C 77, 014313 (2008).
- (5) R. F. Garcia Ruiz et al., Nature Physics 12, 594 (2016).
- (6) E. E. Saperstein, I. N. Borzov, and S. V. Tolokonnikov, JETP Letters 104, 218 (2016).
- (7) M. Honma, T. Otsuka, B. A. Brown, and T. Mizusaki, Eur. Phys. J. A 25, 499 (2005).
- (8) B. Fornal et al., Phys. Rev. C 70, 064304 (2004).
- (9) S. Lenzi et al., Phys. Rev. C 82, 054301 (2010). [
- (10) H. L. Crawford et al., Phys. Rev. Lett. 110, 242701 (2013).
- (11) N. Aoi et al., Phys. Rev. Lett. 102, 012502 (2009).
- (12) A. Gade et al., Phys. Rev. Lett. 112, 112503 (2014).
- (13) Z.Y. Xu et al., Phys. Rev. Lett. 113, 032505 (2014).
- (14) E. Valencia et al., Phys. Rev. C 95, 024320 (2017).
- (15) G. Gamow and M. Schoenberg, Phys. Rev. 59, 539 (1941).
- (16) H. Sachtz et al., Nature 505, 62 (2014).
- (17) K. Langanke and G. Martínez-Pinedo, Rev. Mod. Phys. 75, 819 (2003).
- (18) Q. Zhi et al., Phys. Rev. C 87, 025803 (2013).
- (19) V. Kumar, P. C. Srivastava, and H. Li, J. Phys. G: Nucl. Part. Phys. 43, 105104 (2016).
- (20) J. Engel, M. Bender, J. Dobaczewski, W. Nazarewicz, and R. Surman, Phys. Rev. C 60, 014302 (1999).
- (21) I. N. Borzov, J. J. Cuenca-García, K. Langanke, G. Martínez-Pinedo, and F. Montes, Nucl. Phys. A814, 159 (2008).
- (22) T. Niksic, T. Marketin, D. Vretenar, N. Paar, and P. Ring, Phys. Rev. C 71, 014308 (2005).
- (23) T. Marketin, L. Huther, and G. Martínez-Pinedo, Phys. Rev. C 93, 025805 (2016).
- (24) J. Krumlinde and P. Möller, Nucl. Phys. A417, 419 (1984).
- (25) P. Möller, B. Pfeiffer, and K.-L. Kratz, Phys. Rev. C 67, 055802 (2003).
- (26) H. Homma, E. Bender, M. Hirsch, K. Muto, H. V. Klapdor-Kleingrothaus, and T. Oda, Phys. Rev. C 54, 2972 (1996).
- (27) K. Muto, E. Bender, T. Oda, and H. V. Klapdor-Kleingrothaus, Z. Phys. A 341, 407 (1992).
- (28) D. L. Fang, B. A. Brown, and T. Suzuki, Phys. Rev. C 88, 024314 (2013).
- (29) D. Ni and Z. Ren, Phys. Rev. C 89, 064320 (2014).
- (30) K. Yoshida, Prog. Theor. Exp. Phys. 113D02 (2013).
- (31) M. T. Mustonen and J. Engel, Phys. Rev. C 93, 014304 (2016).
- (32) M. Martini, S. Péru, and S. Goriely, Phys. Rev. C 89, 044306 (2014).
- (33) P. Sarriguren and J. Pereira, Phys. Rev. C 81, 064314 (2010).
- (34) P. Sarriguren, A. Algora, and J. Pereira, Phys. Rev. C 89, 034311 (2014).
- (35) P. Sarriguren, Phys. Rev. C 91, 044304 (2015).
- (36) P. Sarriguren, E. Moya de Guerra, A. Escuderos, and A. C. Carrizo, Nucl. Phys. A635, 55 (1998).
- (37) P. Sarriguren, E. Moya de Guerra, and A. Escuderos, Nucl. Phys. A691, 631 (2001).
- (38) P. Sarriguren, Phys. Rev. C 95, 014304 (2017).
- (39) P. Sarriguren, R. Alvarez-Rodríguez, and E. Moya de Guerra, Eur. Phys. J. A 24, 193 (2005).
- (40) P. Sarriguren, Phys. Rev. C 79, 044315 (2009); Phys. Lett. B 680, 438 (2009); Phys. Rev. C 83, 025801 (2011).
- (41) O. Sorlin et al., Nucl. Phys. A 660, 3 (1999).
- (42) P. T. Hosmer et al., Phys. Rev. Lett. 94, 112501 (2005).
- (43) J. Pereira et al., Phys. Rev. C 79, 035806 (2009).
- (44) S. Nishimura et al., Phys. Rev. Lett. 106, 052502 (2011).
- (45) R. Caballero-Folch et al., Phys. Rev. Lett. 117, 012501 (2016).
- (46) M. Madurga et al., Phys. Rev. Lett. 117, 092502 (2016).
- (47) J. Wu et al., Phys. Rev. Lett. 118, 072701 (2017).
- (48) I. Dillmann and A. Tarifeño-Saldivia, Nuclear Physics News, 28, 28 (2018); A. Tarifeño-Saldivia et al., J. of Instrumentation 12, P04006 (2017).
- (49) Y. Fujita et al., Phys. Rev. Lett. 112, 112502 (2014).
- (50) E. Chabanat, P. Bonche, P. Haensel, J. Meyer, and R. Schaeffer, Nucl. Phys. A635, 231 (1998).
- (51) M. Bender, G. F. Bertsch, and P.-H. Heenen, Phys. Rev. C 78, 054312 (2008).
- (52) M. V. Stoitsov, J. Dobaczewski, W. Nazarewicz, S. Pittel, and D. J. Dean, Phys. Rev. C 68, 054312 (2003).
- (53) D. Vautherin and D. M. Brink, Phys. Rev. C 5, 626 (1972); D. Vautherin, Phys. Rev. C 7, 296 (1973).
- (54) G. Audi et al., Chinese Physics C 36, 1157 (2012); M. Wang et al., Chinese Physics C 36, 1603 (2012).
- (55) J. M. Boillos and P. Sarriguren, Phys. Rev. C 91, 034311 (2015).
- (56) A. Bohr and B. Mottelson, Nuclear Structure, Vols. I and II, (Benjamin, New York 1975).
- (57) N. B. Gove and M. J. Martin, Nucl. Data Tables 10, 205 (1971).
- (58) T. Kawano, P. Möller, and W. B. Wilson, Phys. Rev. C 78, 054601 (2008).
- (59) M. R. Mumpower, T. Kawano, and P. Möller, Phys. Rev. C 94, 064317 (2016).
- (60) E. Poirier et al., Phys. Rev. C 69, 034307 (2004).
- (61) E. Nácher et al., Phys. Rev. Lett. 92, 232501 (2004).
- (62) A.B. Pérez-Cerdán et al., Phys. Rev. C 88, 014324 (2013).
- (63) M. E. Estévez Aguado et al., Phys. Rev. C 92, 044321 (2015).
- (64) J. A. Briz et al., Phys. Rev. C 92, 054326 (2015).
- (65) K. Miernik, Phys. Rev. C 88, 041301(R) (2013).