Using path signatures to predict a diagnosis of Alzheimer’s disease.
Abstract
The path signature is a means of feature generation that can encode nonlinear interactions in the data as well as the usual linear features. It can distinguish the ordering of time-sequenced changes: for example whether or not the hippocampus shrinks fast, then slowly or the converse. It provides interpretable features and its output is a fixed length vector irrespective of the number of input points so it can encode longitudinal data of varying length and with missing data points. In this paper we demonstrate the path signature in providing features to distinguish a set of people with Alzheimer’s disease from a matched set of healthy individuals. The data used are volume measurements of the whole brain, ventricles and hippocampus from the Alzheimer’s Disease Neuroimaging Initiative (ADNI). The path signature method is shown to be a useful tool for the processing of sequential data which is becoming increasingly available as monitoring technologies are applied.
keywords:
Alzheimer’s disease; Mild cognitive impairment; Machine learning; Path signatures; ADNI; DPUK1 Introduction
Alzheimer’s disease (AD) is an irreversible brain disorder which progressively affects cognition and behaviour, and results in an impairment in the ability to perform daily activities. It is the most common form of dementia in older people, affecting about 6% of the population aged over 65, and it increases in incidence with age. The initial stage of AD is characterised by memory loss, and this is the usual presenting symptom. Memory loss is one constituent of mild cognitive impairment (MCI), which can be an early sign of Alzheimer’s disease. MCI is diagnosed by complaints of subjective memory loss (preferably corroborated by a close associate or partner of the individual), impairment of memory function, unimpaired general cognition and behaviour but with no evidence of dementia [1]. MCI does not always progress to dementia or to a diagnosis of Alzheimer’s disease, but those with amnestic mild MCI, the type of MCI characterised by memory impairment, are more likely to develop dementia than those without this diagnosis. In cases where an individual does develop Alzheimer’s disease, the phase of MCI ends with a marked decline in cognitive function, lasting two to five years, in which semantic memory (the recall of facts and general knowledge) and implicit memory (the long-term, nonconscious memory evidenced by priming effects) also becomes degraded.
2 Predicting Alzheimer’s disease
The disease pathology leads to a progressive, irreversible loss of brain function which suggests that prospective drug therapies should be tested for efficacy as early in the process as possible. So there has been a demand for predicting which individuals will develop AD as early as possible in order to test drug therapies which might inhibit or prevent tissue damage. Input variables for use with learning methods may be derived from imaging (in particular MRI), cognitive tests, physical biomarkers such as APOE status and demographic variables such as age and gender.
Data
There are a number of data repositories which are used for studies of Alzheimer’s disease. ADNI, the Alzheimer’s Disease Neuroimaging Initiative has been used in many studies[2]. ADNI is comprised of four phases: ADNI-1 (2004), ADNI-GO (2009), ADNI-2 (2011), and ADNI-3 (2016). ADNI is led by Principal Investigator Michael W. Weiner, MD. For up-to-date information see www.adni-info.org. Another large scale study is AIBL, The Australian Imaging Biomarkers and Lifestyle flagship study of ageing which started in 2016[3]. One European study is AddNeuroMed which is a public/private consortium developed for AD biomarker discovery [4], and it has been used for an number of comparative studies. Of these, ADNI is the longest running and most cited study, although there are many other data sets and initiatives integrating together different datasets.
Competitions
Competitions for accurate prediction of diagnosis and biomarker measures have allowed comparisons between learning methods and feature choice. The CADDementia challenge [5] compares algorithms for multi-class classification of AD, MCI and controls based on structural MRI data. The Kaggle Neuroimaging challenge https://www.kaggle.com/c/mci-prediction [6] was hosted on the Kaggle machine learning platform and used ADNI data. The challenge involved a four-fold classification into AD, MCI, MCI converters to AD, and controls. The 2017 TADPOLE grand challenge https://tadpole.grand-challenge.org/ is currently taking place with evaluation to be completed by January 2019. The TADPOLE challenge has the aim of predicting the onset of Alzheimer’s disease using different modes of measurement, including demographic, physical and cognitive data. The challenge is a three-fold diagnosis classification into AD, MCI and control groups, and the prediction of ADAS-13 score and normalised brain volume. A preprocessed form of the ADNI data from the TADPOLE grand challenge https://tadpole.grand-challenge.org/ was used in the preparation of this report[7].
Imaging features
Brain imaging methods can be used to derive features for predicting diagnosis either by analysis of the whole brain (voxel-based morphometry) or by deriving features from specific brain regions that are known to change during the course of Alzheimer’s disease. Using ADNI data, Schmitter et al.[8] found that volume-based morphometry achieved at least as good an accuracy as voxel-based morphometry for typical classification tasks. Sørensen et al. examined the differential diagnosis of AD and MCI using features derived from MRI and found that the most important MRI biomarkers were; hippocampal volume, ventricular volume, hippocampal texture, and parietal lobe thickness[9]. Using training data from ADNI and AIBL, they were ranked as first place on the CADDementia challenge with a multi-class classification accuracy of 63%. Westman et al.[10] used the ADNI and AddNeuroMed data sets to examine 34 regional cortical thickness measures and 23 volume measures and found in both cohorts the most important features to be the entorhinal cortex, hippocampus and amygdala volumes.
It should be noted that there is heterogeneity among patients diagnosed with Alzheimer’s disease: Poulakis et al.[11] identified five groups of patients by clustering AddNeuroMed and ADNI data on cortical and subcortical volume measures. The groups were labelled as minimal atrophy, limbic-predominant, hippocampal-sparing, and two diffuse atrophy subtypes, and have different demographic, clinical and cognitive characteristics and different rates of cognitive decline.
3 Experiment
In this paper, we aim to demonstrate the application of the path signature by distinguishing Alzheimer’s and healthy groups using MRI data as input to a classifier. In doing so we investigate some of the nonlinear interactions between features, that is the relative changes between brain regions that occur with aging. The novel aspect is the use of the path signature for generating features for classification. The path signature was originally introduced by Chen [12] who applied it to piecewise smooth paths, and it was further developed by Lyons and others [13][14][15][16][17]. It is a systematic way of providing feature sets for multimodal data that can probe the nonlinear interactions in the data as an extension of linear features. Since all time-dependent interactions between variables are encoded, it likely to be useful for detecting unforeseen relationships between variables. Combined with Lasso regularisation, it can detect situations where the observed data has nonlinear information that significantly improves the inference. Second order information has proved useful in some applications, for example in [18] where the method was applied to modelling bipolar disorder and borderline personality disorder.
Data
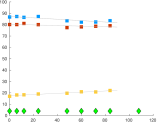
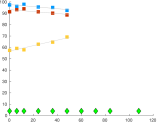
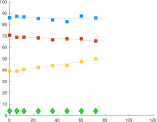
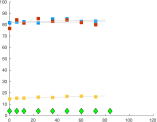
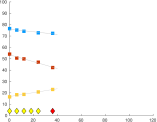
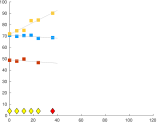
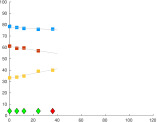
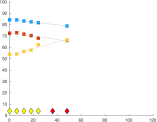
We select two sets from the TADPOLE competition data for the first classification task. A total of 1737 participants are first split into those who have a diagnosis of Alzheimer’s disease (AD) at some point (n=688), and the remainder who remain healthy (NL) (n=341). The AD set is further selected to have the first diagnosis of AD at 36 months from baseline and with at least four measurements of all the variables WholeBrain, Hippocampus and Ventricles in the 24 months since baseline, with one measurement at the 24 months time point. The participant must also have a match in the NL set. To qualify to be a match to an AD participant, an individual must match their age to within 6 years and have healthy diagnoses for 72 months since the baseline measurement. The matching time series must also have at least four measurement points up to month 24 including a measurement at month 24 itself. Characteristics of the selected sets are shown in Table 1, and sample plots of the time series are shown in Figure 1.
| Healthy | Alzheimer’s | |
|---|---|---|
| n: | 21 | 21 |
| Age: min(mean)max | 65.1 (74.8) 89.6 | 64.6 (75.4) 85.9 |
| Gender M/F: | 10/11 | 10/11 |
| Wholebrain: | 1.05 (0.11) | 1.00 (0.12) |
| Hippocampus: | 7.67 (0.84) | 6.14 (1.41) |
| Ventricles: | 25.43 (19.91) | 34.34 (21.17) |
| median(iqr) | ||
| APOE 0: | 81% | 29% |
| 1: | 19% | 52% |
| 2: | 0% | 19% |
| MMSE 25 | 3 | |
| 26 | 2 | |
| 27 | 1 | 4 |
| 28 | 4 | 5 |
| 29 | 8 | 4 |
| 30 | 8 | 3 |
Method
We take each time series from the AD set up to the last time point before diagnosis and extract a similar length time series from the counterpart in the NL set. The experiment is to identify time series as belonging to either the AD or NL set by using changes in relative brain volumes and time. For classification we use binary logistic regression which models the log probabilities of the outputs as linear functions of the inputs. The inputs to the classifier are found using Lasso regularisation which subtracts an penalty from the negative log-likelihood when fitting the model. The input to Lasso is
a vector formed from the three ROI variables: WholeBrain, Hippocampus and Ventricles, and the path signature which is itself derived from these variables and their time points. The path signature maps the path of the input variables to a series of real numbers which uniquely characterise that path, . The superscripts are multi-indexes or words whose total length is in practice limited to degree . In this application we use , resulting in a signature length of 21 where the first term, which is always 1, is unused in the feature vector. The next four terms represent the increment of each variable, so in the experiment is the time period. The next term is equal to . The cross terms and both represent the area between the actual path and a stepped path which increments one coordinate to its final value, then the next coordinate to its final value. The log signature is an alternative representation that results from taking the logarithm in the formal power series and it is a more compact representation of the path than the signature. An introduction to the path signature which gives a geometric explanation of terms up to second degree can be found in [19].
Training is performed on the entire set of 42 time series using 10-fold cross-validation to find the graph of deviance against the Lasso coefficient which determines the strength of regularisation. As the Lasso coefficient increases, most of the variable coefficients shrink to zero, leaving a set of variables which act as predictors.
4 Results
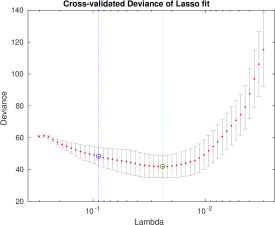
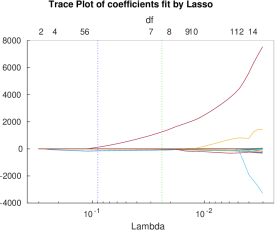
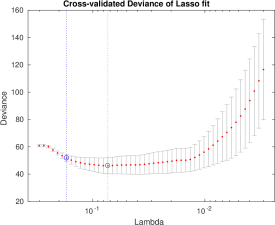
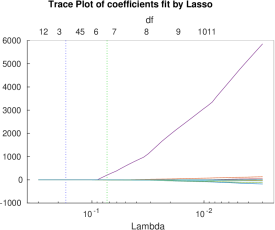
Training curves for the signature and log signature features are shown in Figures 2 and 3. As lambda is increased (from right to left in the figures), the variable coefficients shrink and the deviance changes. Table 2 shows those features that are selected at the point of minimum deviance plus one standard deviation. Using the log signature, Lasso selects the baseline (initial) volume of the ventricles and the change in volume of the hippocampus and ventricles. Table 1 shows different ventricles sizes for the two sets, so it is not surprising that this variable was selected. The selection of hippocampus and volume increments might also be expected from inspection of the sample graphs in 1. Using the signature, Lasso selects some interaction terms. The feature (t,t) represents the square of half the time increment: although the time series are all nominally of 24 months duration there are minor differences in the precise date when the MRI image was taken. The remaining three features are interactions between variables (w,h), (w,v) and (h,t).
| Signature | Log signature |
|---|---|
| Ventricles baseline | Ventricles baseline |
| (t,t) | Hippocampus increment |
| (t,v) | Ventricles increment |
| (w,h) | |
| (w,v) | |
| (h,t) |
5 Conclusion
The path signature has been used to encode the changes in time of brain ROI volumes for both healthy individuals and those with Alzheimer’s disease. We cannot at this stage draw strong conclusions from the selected set of variables beyond noting that they correspond to known Alzheimer’s disease pathology, such as the changes in hippocampus and ventricles volume. These processes also occur in normal aging, though to a lesser extent. The identification of interaction terms formed of pairs of ROI variables is interesting and deserves further exploration. The signature method generates interpretable nonlinear features and handles missing and irregular sequential data. While nonlinear classifiers (neural nets, random forests) can be accurate, their function can be difficult to interpret. By encoding nonlinearity into the features, we can use classifiers that give more interpretable results. Sequential data is becoming increasingly available as monitoring technology is applied, and the path signature method is a useful tool in the processing of this data.
6 Acknowledgements
Data collection and sharing for this project was funded by the Alzheimer’s Disease Neuroimaging Initiative (ADNI) (National Institutes of Health Grant U01 AG024904) and
DOD ADNI (Department of Defense award number W81XWH-12-2-0012). A full list of funding sources for ADNI is provided in the document ‘Alzheimer’s Disease Neuroimaging Initiative (ADNI) Data Sharing and Publication Policy’ available through adni.loni.usc.edu/.
This work uses the TADPOLE data sets https://tadpole.grand-challenge.org constructed by the EuroPOND consortium http://europond.eu funded by the European Union’s Horizon 2020 research and innovation programme under grant agreement No 666992.
The MRC Dementias Platform UK (DPUK) https://www.dementiasplatform.uk/ provided support in the preparation of this paper. DPUK is a multi-million pound public-private partnership, developed and led by the MRC, to accelerate progress in and open up dementias research. The aims of DPUK are early detection, improved treatment and ultimately the prevention of dementias.
References
- [1] P. J. Nestor, P. Scheltens, J. R. Hodges, Advances in the early detection of Alzheimer’s disease, Nature medicine 10 (7) (2004) S34.
- [2] M. W. Weiner, D. P. Veitch, P. S. Aisen, L. A. Beckett, N. J. Cairns, R. C. Green, D. Harvey, C. R. Jack, W. Jagust, J. C. Morris, et al., Recent publications from the Alzheimer’s Disease Neuroimaging Initiative: Reviewing progress toward improved AD clinical trials, Alzheimer’s & Dementia.
- [3] K. A. Ellis, A. I. Bush, D. Darby, D. De Fazio, J. Foster, P. Hudson, N. T. Lautenschlager, N. Lenzo, R. N. Martins, P. Maruff, et al., The Australian Imaging, Biomarkers and Lifestyle (AIBL) study of aging: methodology and baseline characteristics of 1112 individuals recruited for a longitudinal study of Alzheimer’s disease, International Psychogeriatrics 21 (4) (2009) 672–687.
- [4] S. Lovestone, P. Francis, I. Kloszewska, P. Mecocci, A. Simmons, H. Soininen, C. Spenger, M. Tsolaki, B. Vellas, L.-O. Wahlund, et al., AddNeuroMed—the European collaboration for the discovery of novel biomarkers for Alzheimer’s disease, Annals of the New York Academy of Sciences 1180 (1) (2009) 36–46.
- [5] E. E. Bron, M. Smits, W. M. Van Der Flier, H. Vrenken, F. Barkhof, P. Scheltens, J. M. Papma, R. M. Steketee, C. M. Orellana, R. Meijboom, et al., Standardized evaluation of algorithms for computer-aided diagnosis of dementia based on structural MRI: the CADDementia challenge, NeuroImage 111 (2015) 562–579.
- [6] A. Sarica, A. Cerasa, A. Quattrone, V. Calhoun, Editorial on Special Issue: Machine learning on MCI (2018).
- [7] R. V. Marinescu, N. P. Oxtoby, A. L. Young, E. E. Bron, A. W. Toga, M. W. Weiner, F. Barkhof, N. C. Fox, S. Klein, D. C. Alexander, t. EuroPOND Consortium, TADPOLE Challenge: Prediction of Longitudinal Evolution in Alzheimer’s Disease, ArXiv e-printsarXiv:1805.03909.
- [8] D. Schmitter, A. Roche, B. Maréchal, D. Ribes, A. Abdulkadir, M. Bach-Cuadra, A. Daducci, C. Granziera, S. Klöppel, P. Maeder, et al., An evaluation of volume-based morphometry for prediction of mild cognitive impairment and Alzheimer’s disease, NeuroImage: Clinical 7 (2015) 7–17.
- [9] L. Sørensen, C. Igel, A. Pai, I. Balas, C. Anker, M. Lillholm, M. Nielsen, A. D. N. Initiative, et al., Differential diagnosis of mild cognitive impairment and Alzheimer’s disease using structural MRI cortical thickness, hippocampal shape, hippocampal texture, and volumetry, NeuroImage: Clinical 13 (2017) 470–482.
- [10] E. Westman, A. Simmons, J.-S. Muehlboeck, P. Mecocci, B. Vellas, M. Tsolaki, I. Kłoszewska, H. Soininen, M. W. Weiner, S. Lovestone, et al., AddNeuroMed and ADNI: similar patterns of Alzheimer’s atrophy and automated MRI classification accuracy in Europe and North America, Neuroimage 58 (3) (2011) 818–828.
- [11] K. Poulakis, J. B. Pereira, P. Mecocci, B. Vellas, M. Tsolaki, I. Kłoszewska, H. Soininen, S. Lovestone, A. Simmons, L.-O. Wahlund, et al., Heterogeneous patterns of brain atrophy in Alzheimer’s disease, Neurobiology of aging 65 (2018) 98–108.
- [12] K. T. Chen, Integration of paths–a faithful representation of paths by noncommutative formal power series, Transactions of the American Mathematical Society 89 (2) (1958) 395–407.
- [13] H. Boedihardjo, X. Geng, T. Lyons, D. Yang, The signature of a rough path: uniqueness, Advances in Mathematics 293 (2016) 720–737.
- [14] B. Hambly, T. Lyons, Uniqueness for the signature of a path of bounded variation and the reduced path group, Annals of Mathematics (2010) 109–167.
- [15] T. Lyons, Rough paths, signatures and the modelling of functions on streams, arXiv preprint arXiv:1405.4537.
- [16] T. Lyons, Z. Qian, System control and rough paths,(2002).
- [17] Z. Xie, Z. Sun, L. Jin, H. Ni, T. Lyons, Learning spatial-semantic context with fully convolutional recurrent network for online handwritten chinese text recognition, IEEE Transactions on Pattern Analysis and Machine Intelligence.
- [18] I. P. Arribas, K. Saunders, G. Goodwin, T. Lyons, A signature-based machine learning model for bipolar disorder and borderline personality disorder, arXiv preprint arXiv:1707.07124.
- [19] I. Chevyrev, A. Kormilitzin, A primer on the signature method in machine learning, arXiv preprint arXiv:1603.03788.