20XX Vol. X No. XX, 000–000
22institutetext: College of Astronomy and Space Sciences, University of Chinese Academy of Sciences, Beijing 100049, China \vs\noReceived 20XX Month Day; accepted 20XX Month Day
Machine Learning Classification of Gaia Data Release 2
Abstract
Machine learning has increasingly gained more popularity with its incredibly powerful ability to make predictions or calculated suggestions for large amounts of data. We apply the machine learning classification to 85,613,922 objects in the data release 2, based on the combination of the Pan-STARRS 1 and AllWISE data. The classification results are cross-matched with Simbad database, and the total accuracy is 91.9%. Our sample is dominated by stars, 98%, and galaxies makes up 2%. For the objects with negative parallaxes, about 2.5% are galaxies and QSOs, while about 99.9% are stars if the relative parallax uncertainties are smaller than 0.2. Our result implies that using the threshold of 0 0.2 could yield a very clean stellar sample.
keywords:
methods: data analysis — stars: general — Gaia catalog1 Introduction
The ESA space mission performs an all-sky astrometric, photometric, and radial velocity survey at optical wavelengths (Gaia Collaboration et al., 2016a). The primary objective of the mission is to survey more than one billion stars, in order to investigate the origin and subsequent evolution of our Galaxy. Its second data release ( DR2; Gaia Collaboration et al. 2018) includes 1.3 billion objects with valid parallaxes. These parallaxes are obtained with a complex iterative procedure, involving various assumptions (Lindegren et al., 2012). Such procedure may produce parallaxes for galaxies and QSOs, which should present no significant parallaxes (Liao et al., 2018).
Besides, uses two fields of view to observe, and this in principle might lead to a global parallax bias (van Leeuwen, 2005; Butkevich et al., 2017; Liao et al., 2017). Separating galaxies and QSOs from stars allows us to characterize the parallax bias in the catalog, and to provide a clean and accurate stellar sample for further investigation. Traditionally, the classification of objects involves magnitudes and colors criteria, but the criteria become too complex to be described with functions in a multidimensional parameter space. By contrast, this parameter space can be effectively explored with machine-learning (ML) algorithms, which have helped us to deal with complex problems in modern astrophysics (Huertas-Company et al., 2008, 2009; Manteiga et al., 2009; Bai et al., 2018a; Pashchenko et al., 2018).
ML provides us an alternative option to classify billions of objects that cannot be followed-up spectroscopically. Bai et al. (2018a) applied the supervised ML to the star/galaxy/QSO classification based on the combination of SDSS and LAMOST spectral surveys (the SL classifier). Actually, the class labels of the training objects are from spectroscopy, and are regarded as true. Narrow line QSOs are classified as galaxies by both SDSS and LAMOST pipeline because the template of QSO in the pipelines is the theoretical one with broad emission lines. The classifier built with the random forest algorithm showed best performance on time cost and the inner accuracy. Several blind tests were also performed on the objects observed by the RAVE, 6dFGS and UVQS. The accuracies were higher than 99% for the stars and galaxies, and higher than 94% for the QSOs.
2 Data and Classification
In order to use the SL classifier, we build a nine-dimensional color space, , , , , , 1, 12, w1mag_1w1mag_3, and w2mag_1w2mag_3 (Bai et al., 2018a). The optical colors are extracted from the data release 1 of the Panoramic Survey Telescope and Rapid Response System (Pan-STARRS 1; hereafter PS1) archive data. The PS1 has carried out a set of imaging sky surveys including the 3 Steradian Survey, in which the mean 5 point source limiting sensitivities are 23.3, 23.2 and 23.1 mag in bands (Chambers et al., 2016). We cross-matched the DR2 with PS1 using , the pre-computed PS1 cross-match table provided in the archive (Marrese et al., 2017). The table includes 810,359,898, the most likely matches between PS1 and DR2, which were determined with the angular distances, position errors, epoch differences, and density of sources in PS1.
In order to obtain the infrared colors, we cross-matched the DR2 with AllWISE catalog using , which includes 300,207,917 matches (Marrese et al., 2017). Here we select the objects with the S/N ratios higher than 2 in the 1 and 2 bands. As a result, the cross-matchings yield 85,613,922 objects with the valid nine colors. We feed the SL classifier with the nine-color matrix, and the classifier returns the types and the possibilities () for stars, galaxies and QSOs. The sum of for three types is 100%, and the type with the highest is adopted by the SL classifier as the output type. Therefore, the of the adopted type is higher than 33.33%.
Traditionally, QSOs are separated from other AGNs mainly by their absolute magnitudes. The QSOs in training data of the SL classifier are identified with the QSO spectral templates. The different definitions of QSOs may cause many galaxies in our sample classified as QSOs in literatures. Therefore, the galaxies and QSOs given by the SL classifier are combined and hereafter called galaxies. The results includes 83,891,260 stars, and 1,722,662 galaxies.
3 Result and Analysis
3.1 Comparison with Simbad
We cross-match these objects to the Simbad database in order to estimate the probability of the possibly wrong classifications. The Simbad database gives 308,864 galaxies, 191,497 stars and 10,987 unclassified objects.
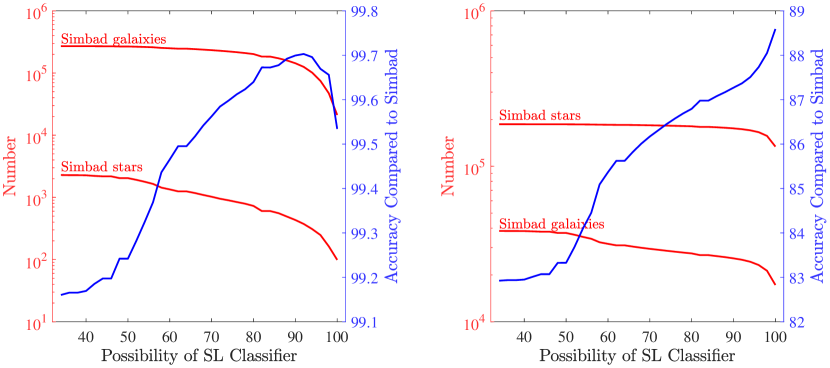
The distributions of the output possibilities are presented in Fig. 1. We defined the accuracies as the ratios between the numbers of the Simbad types and those given by SL classifier. The total accuracy is 91.9%. More than 99.1% of the galaxies in our sample are also classified as galaxies in the Simbad database, and more than 83% of the stars in our sample are classified as stars.
The classification accuracy of the stars is lower than those of the spectrally resolved samples in Bai et al. (2018a). The stars in the training sample of the SL classifier are mainly from LAMOST, which is dominated by the stars located in the Galactic anticenter. This selection effect may make the SL classifier familiar with the lightly reddened objects. The objects located at the heavily reddened direction of the Galaxy are probably hard to be recognized by the SL classifier.
3.2 Sky Distribution
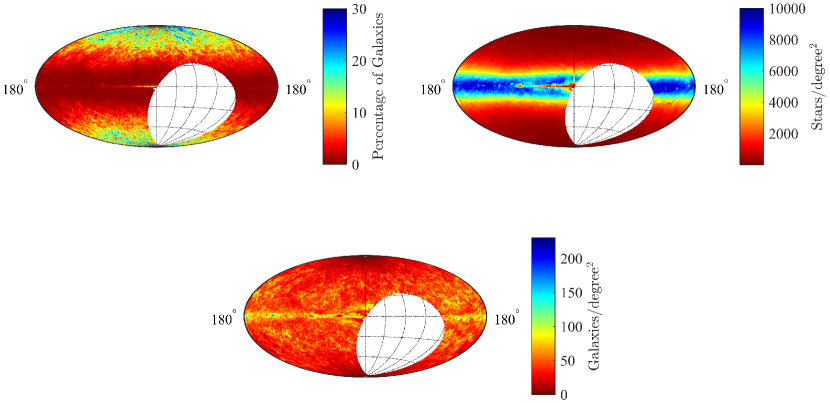
We present distributions of the classification results in Fig. 2. It is expected that the Galactic plane is dominated by the stars, and the percentages of the galaxies become higher at high latitudes. The relative high percentages in the most central Galactic plane may be due to the low density of the stars in this region (left panel in Fig. 2). The low completeness of PS1 caused by the high extinction (Chambers et al., 2016) maybe results in the low density of the stars in the most central Galactic plane. Additionally, the photometry is limited by confusion near the Galactic plane due to high source density (Wright et al., 2010). In the distribution of the galaxies, we can find over-density areas corresponding to some galaxy clusters (Jarrett, 2004), e.g., Abell 624, Perseus-Pisces supercluster, and Shapley concentration.
3.3 Relative Error of Parallax
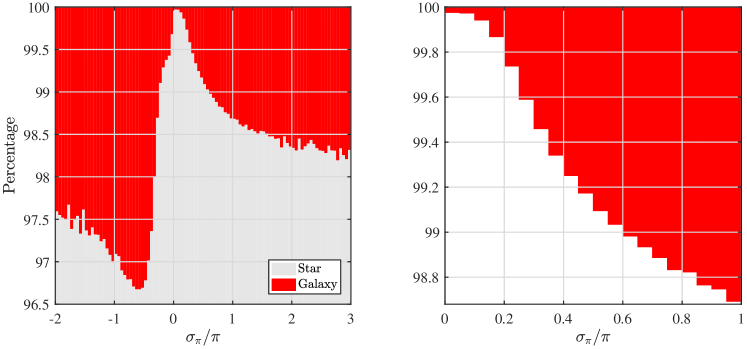
The relative parallax uncertainty, , is an important parameter that can be used to constrain the bias caused by the LutzKelker Effect (LKE; Trumpler & Weaver 1953; Lutz & Kelker 1973; Bai et al. 2018b). We present the stacked distributions of in Fig. 3. The sample of galaxies make up 2.5% for the objects with parallaxes less than zero. The percentages of the stars decrease sharply in the rang of 0.6 0.0, and reach the minimum 96.7%. Since there is no negative uncertainty, the negative means negative parallax.
The percentages of the stars decline with the increase of the for the objects with positive parallaxes. The galaxies make up less than 1% for the objects in the range of 0 0.6. The sample are nearly all stars ( 99.9%) when 0 0.2. In this range, the bias caused by the LKE also becomes insignificant (Bai et al., 2018b). Using the threshold of 0 0.2 could yield a very clean stellar sample, including 27,500,769 stars, 18,674 galaxies.
4 Summary
We apply the SL classifier to 85,613,922 objects in the DR2, based on the colors built from the PS1 and AllWISE. The classification shows that about 98% of the sample are stars, and 2% are galaxies. This result is cross-matched with Simbad database in order to estimate the probability of the possibly wrong classifications, and the total accuracy is 91.9%. The Galactic plane is dominated by the stars, and the percentages become higher at high latitudes. We find that about 2.5% of the sample are galaxies for the objects with negative parallaxes, and the threshold of 0 0.2 could yield a very clean stellar sample including about 99.9% stars.
Acknowledgements.
This work was supported by the National Program on Key Research and Development Project (Grant No. 2016YFA0400804) and the National Natural Science Foundation of China (NSFC) through grants NSFC-11603038/11333004/11425313/11403056. Some of the data presented in this paper were obtained from the Mikulski Archive for Space Telescopes (MAST). STScI is operated by the Association of Universities for Research in Astronomy, Inc., under NASA contract NAS5-26555. Support for MAST for non-HST data is provided by the NASA Office of Space Science via grant NNX09AF08G and by other grants and contracts. This work has made use of data from the European Space Agency (ESA) mission Gaia (https://www.cosmos.esa.int/gaia), processed by the Gaia Data Processing and Analysis Consortium (DPAC, https://www.cosmos.esa.int/web/gaia/dpac/consortium). Funding for the DPAC has been provided by national institutions, in particular the institutions participating in the Gaia Multilateral Agreement.References
- Bai et al. (2018a) Bai, Y., Justham, S., Liu, J.F., et al. 2018a, in preparation
- Bai et al. (2018b) Bai, Y., Liu, J. F., & Wang, S. 2018b, arXiv:1807.00531
- Butkevich et al. (2017) Butkevich, A. G., Klioner, S. A., Lindegren, L., Hobbs, D., & van Leeuwen, F. 2017, A&A, 603, A45
- Chambers et al. (2016) Chambers, K. C., Magnier, E. A., Metcalfe, N., et al. 2016, arXiv:1612.05560
- Gaia Collaboration et al. (2016a) Gaia Collaboration, Prusti, T., de Bruijne, J. H. J., et al. 2016, A&A, 595, A1
- Gaia Collaboration et al. (2016b) Gaia Collaboration, Brown, A. G. A., Vallenari, A., et al. 2016, A&A, 595, A2
- Gaia Collaboration et al. (2018) Gaia Collaboration, Brown, A. G. A., Vallenari, A., et al. 2018, arXiv:1804.09365
- Huertas-Company et al. (2008) Huertas-Company, M., Rouan, D., Tasca, L., Soucail, G., & Le Fèvre, O. 2008, A&A, 478, 971
- Huertas-Company et al. (2009) Huertas-Company, M., Tasca, L., Rouan, D., et al. 2009, A&A, 497, 743
- Jarrett (2004) Jarrett, T. 2004, PASA, 21, 396
- Liao et al. (2017) Liao, S., Lattanzi, M. G., Vecchiato, A., et al. 2017, Proceedings of the International Astronomical Union, S330, 231
- Liao et al. (2018) Liao, S.-l., Qi, Z.-x., Guo, S.-f., & Cao, Z.-h. 2018, arXiv:1804.08821
- Lindegren et al. (2012) Lindegren, L., Lammers, U., Hobbs, D., et al. 2012, A&A, 538, A78
- Lutz & Kelker (1973) Lutz, T. E., & Kelker, D. H. 1973, PASP, 85, 573
- Manteiga et al. (2009) Manteiga, M., Carricajo, I., Rodríguez, A., Dafonte, C., & Arcay, B. 2009, AJ, 137, 3245
- Marrese et al. (2017) Marrese, P. M., Marinoni, S., Fabrizio, M., & Giuffrida, G. 2017, A&A, 607, A105
- Pashchenko et al. (2018) Pashchenko, I. N., Sokolovsky, K. V., & Gavras, P. 2018, MNRAS, 475, 2326
- Trumpler & Weaver (1953) Trumpler, R. J., & Weaver, H. F. 1953, Dover Books on Astronomy and Space Topics, New York: Dover Publications
- van Leeuwen (2005) van Leeuwen, F. 2005, A&A, 439, 805
- Wright et al. (2010) Wright, E. L., Eisenhardt, P. R. M., Mainzer, A. K., et al. 2010, AJ, 140, 1868