Three-dimensional photonic band gap cavity with finite support: enhanced energy density and optical absorption
Abstract
We study numerically the transport and storage of light in a three-dimensional (3D) photonic band gap crystal doped by a single embedded resonant cavity. The crystal has finite support since it is surrounded by vacuum, as in experiments. Therefore, we employ the finite element method to model the diamond-like inverse woodpile crystal that consists of two orthogonal arrays of pores in a high-index dielectric such as silicon and that has experimentally been realized by CMOS-compatible methods. A point defect that functions as the resonant cavity is formed in the proximal region of two selected orthogonal pores with a radius smaller than the ones in the bulk of the crystal. We present a field-field cross-correlation method to identify resonances in the finite-support crystal with defect states that appear in the 3D photonic band gap of the infinite crystal. Out of five observed angle-independent cavity resonances, one is -polarized and four are -polarized for light incident in the or directions. It is remarkable that quality factors up to appear in such thin structures (only three unit cells), which is attributed to the relatively small Bragg length of the perfect crystal. We find that the optical energy density is remarkably enhanced at the cavity resonances by up to the incident energy density in vacuum or up to the energy density of the equivalent effective medium. We find that an inverse woodpile photonic band gap cavity with a suitably adapted lattice parameter reveals substantial absorption in the visible range. Below the 3D photonic band gap, Fano resonances arise due to interference between the discrete fundamental cavity mode and the continuum light scattered by the photonic crystal. We argue that the five eigenstates of our 3D photonic band gap cavity have quadrupolar symmetry, in analogy to d-like orbitals of transition metals. We conclude that inverse woodpile cavities offer interesting perspectives for applications in optical sensing and photovoltaics.
I Introduction
Confining light in a minuscule volume in space is a main topic in nanophotonics Vahala2003Nature ; Lourtioz2005Book ; Novotny2006Book ; Ghulinyan2015Book . Notable interests include trapping or slowing down of photons Baba2008NatPhot , sensing for bio applications Krioukov2002OptLett , Purcell enhancement of spontaneous emission Purcell1961PR ; Gerard1998PRL , and cavity quantum electrodynamics Thompson1992PRL ; Imamoglu1997PRL ; Gerard2003TAP ; Reithmaier2004Nature ; Yoshie2004Nature ; Peter2005PRL . To achieve micro- and nano-scale light confinement, many types of devices have been reported such as microspheres Gorodetsky1996OptLett ; Vernooy1998OptLett , micropillars Gerard1998PRL ; Reithmaier2004Nature ; Peter2005PRL ; Pelton2002IEEEJQE , microdisks Gayral1999APL , plasmonic cavities Miyazaki2006PRL ; Kuttge2010NanoLett ; Chikkaraddy2016Nature , toroidal rings Armani2003Nature , or 2D photonic crystal slab cavities Painter1999Science ; Akahane2003Nature .
A cavity formed by a defect embedded in a three-dimensional (3D) photonic band gap crystal has a prime significance Yablonovitch1987PRL ; John1987PRL , since the confinement of light is truly three-dimensional Busch2006book ; Minkov2017APL . A defect in a photonic crystal is formed by the addition or by the removal of high-index material to break the periodic spatial symmetry Villeneuve1996PRB . A defect formed by adding high-index material is called a donor defect since the defect state derives from the high frequency (“conduction”) bands, whereas a defect formed by removing high-index material is called an acceptor defect since the defect state derives from the low frequency (“valence”) bands Villeneuve1996PRB ; Ozbay1995PRB ; Okano2002PRB ; Joannopoulos2008Book .
Among all 3D photonic band gap crystals, the class of crystals with a diamond-like symmetry stand out for their broad 3D photonic band gap Maldovan2004NP , which makes them robust to unavoidable fabrication disorder Woldering2009JAP , and which is favorable to shield embedded cavities from the surrounding vacuum Vos2015Book . Following the seminal microwave studies of Yablonovitch et al. Yablonovitch1991PRL and Bayindir et al. Bayindir2000PRL ; Bayindir2000PRB , Ogawa et al. studied the modified emission spectra of quantum wells in presence of a 3D photonic band gap cavity in direct woodpile crystals made from GaAs Ogawa2004Science . The Kyoto group performed a group-theoretical study to identify the symmetry properties of the sizable number of cavity resonances that appear in woodpile crystals (between 17 and 32, depending on the cavity geometry) Okano2004PRB . Recently, the Tokyo team demonstrated a quality factor in emission spectra of quantum dots in a GaAs woodpile crystal Tajiri2015APL .
Here, we pursue the so-called inverse woodpile photonic crystal structures that consists of two 2D orthogonal arrays of pores Ho1994SSC . Since this structure is relatively straightforward to define, it has been realized by various nanofabrication techniques and high-index backbones Schilling2005APL ; Santamaria2007AdvMater ; Hermatschweiler2007AdvFunctMater ; Jia2007JApplPhys . Moreover, 3D inverse woodpile photonic crystals made from silicon have been fabricated by our group using CMOS-compatible nanofabrication methods that were developed in collaboration with high-tech industry Tjerkstra2011JVSTB ; vandenBroek2012AFM ; Grishina2015Nanotechnology . To functionalize inverse woodpile crystals, our group has proposed a design to create a resonant cavity in the 3D inverse woodpile crystal structure, whereby the photons are tightly confined in the proximal region of two orthogonal defect pores that have a radius smaller than all other pores in the bulk of the crystal, as illustrated in Fig. 1(a) Woldering2014PRB . Up to five cavity defect bands were found inside the band gap for defect pores smaller than all other pores, corresponding to donor states footnote:AccepterStates . The occurrence of five resonances suggests that the defect cavity has d-like character - in analogy to an atomic defect in a semiconductor band gap Ashcroft1976Book - or quadrupole character in terms of electrodynamic resonances Jackson1999Book , as is also borne out of a parallel theoretical study of a 3D superlattice of cavities Hack2018 . Each of the resonances has a resonance frequency () that is nearly independent on wave vector, as expected for a defect state Woldering2014PRB . Since the calculations in Ref. Woldering2014PRB were performed for infinite crystals with no surrounding vacuum, however, the cavity quality factor could not be calculated and thus the energy enhancement and potential absorption in such a cavity could not be assessed.
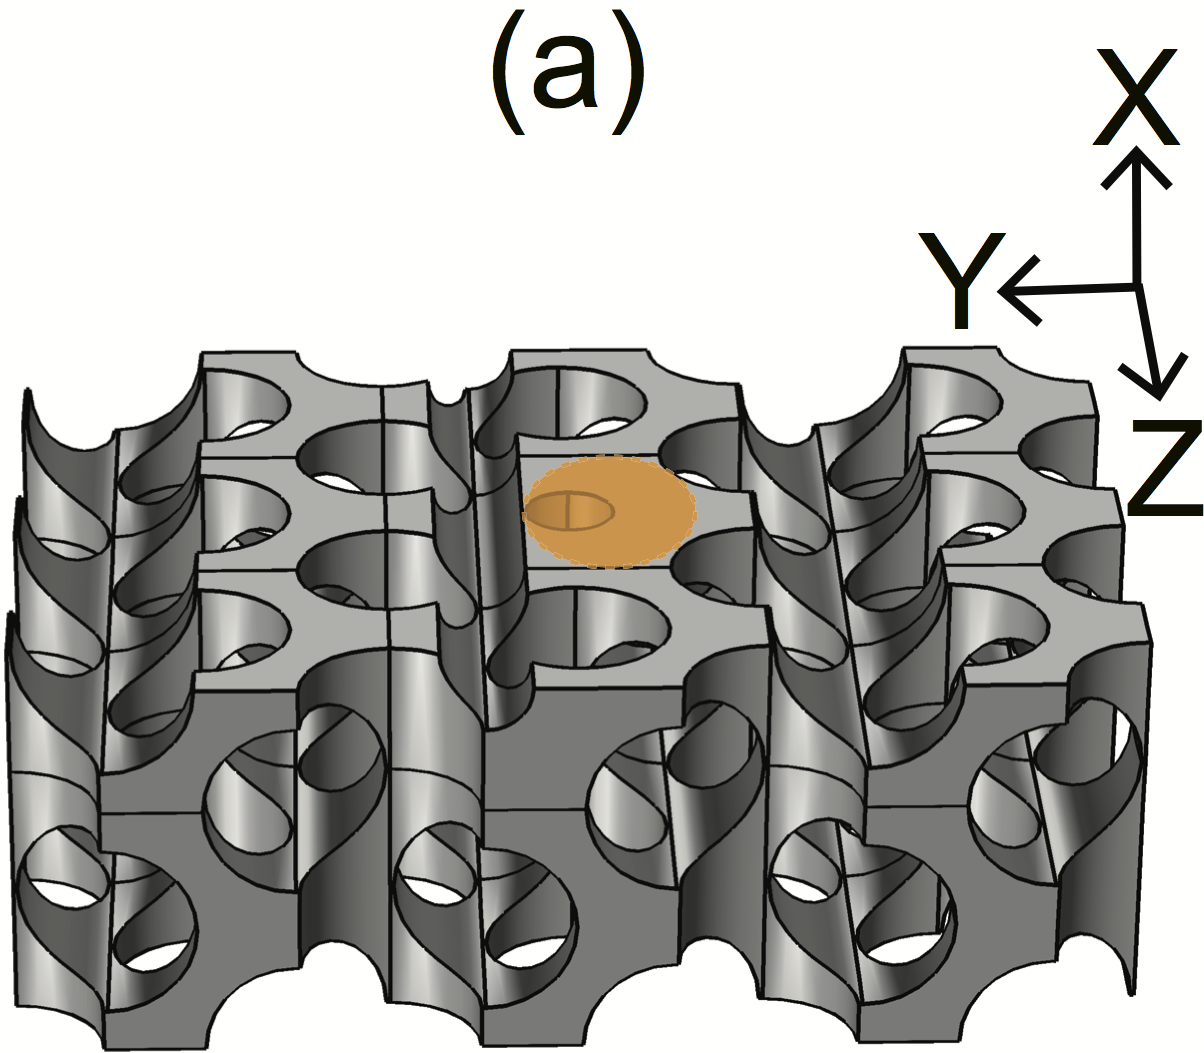
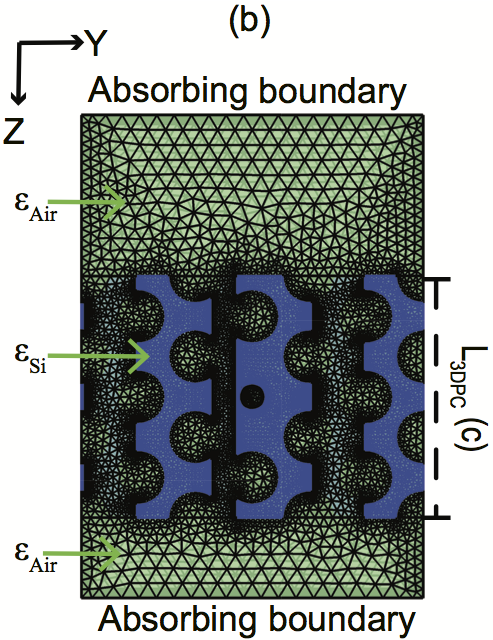
Therefore, we investigate here the optical properties of a 3D photonic band gap cavity with finite support that is surrounded by vacuum as in real devices, as guidance for experimental work. By cross-correlating the fields for a crystal with finite support with those of the defect states in the infinite crystal, we identify the resonances in the crystal with finite support and their field patterns. We verify the angle-independence of the reflectivity resonances to confirm the 3D localization of the cavity resonances in real space. We study the quality factors of the resonances, and calculate the electric-field energy enhancement due to these resonances and assess their potential application to enhance absorption, notably for photovoltaic applications. We also address resonances below the 3D band gap of the perfect crystal structure, and find evidence for Fano resonances.
II Methods
The two 2D arrays of pores in a 3D inverse woodpile crystal structure have a radius and run in the orthogonal and directions Ho1994SSC . The 2D arrays have a centered-rectangular lattice with lattice parameters (in the and -directions) and (in the -direction). The diamond-like structure is cubic when . For pores with a relative radius , cubic inverse woodpile crystals have a maximum band gap width with a broad relative bandwidth relative to the central band gap frequency Hillebrand2003JAP ; Woldering2008Nanotechnology .
Woldering et al. Woldering2014PRB calculated the photonic band structure for a supercell of the 3D inverse woodpile photonic crystal with a cavity by employing a plane-wave expansion (PWE) method Johnson2001OptExpress that assumes the structure to be infinitely extended. They reported that defect pores with radius yield an optimal light confinement. In order to relate to the previous work, we tuned the parameters to be the same as previously, namely an optimal ideal pore radius Hillebrand2003JAP ; Woldering2009JAP , an optimal defect pore radius (or ) Woldering2014PRB , and a dielectric permittivity that is typical for silicon in the near infrared and telecom ranges Woldering2009JAP ; Woldering2014PRB ; Huisman2011PRB ; Leistikow2011PRL .
To investigate the consequences of the finite support and of the defect cavity, we study the reflectivity spectra for a 3D photonic band gap crystal with a point defect and with a finite thickness (slab geometry). Since our recent results revealed that a thin perfect crystal with a thickness of only three unit cells is sufficient to reveal strong reflectivity and strongly attenuated transmission Devashish2017PRB , we selected as the size of the super cell, as shown in Fig. 1, to keep the computations tractable. Thus, there is one point defect in the direction of propagation of the incident plane wave in the thickness of the photonic crystal slab.
We employ the finite-element method (FEM) to solve the time-harmonic Maxwell equations (using the commercial solver COMSOL COMSOLMultiphysics ). In order to describe reflectivity (or transmission) from a photonic crystal slab oriented perpendicular to the direction, we employ Bloch-Floquet periodic boundaries in the and the directions and absorbing boundaries in the and directions Joannopoulos2008Book . The incident field starts from a plane in the direction that is separated from the crystal by an air layer. The plane represents a boundary condition rather than a true current source since it also absorbs the reflected waves Jin1993Book . We launch incident plane waves with either polarization - with the electric field perpendicular to the plane of incidence - or polarization - with magnetic field normal to the plane of incidence - and with an angle of incidence between and .
We investigate the effects of the symmetry-disruption of the infinite crystal by the interfaces by comparing the reflectivity spectra for a thin slab to the corresponding photonic band structure for an infinitely extended crystal Devashish2017PRB . To eliminate possible deviations arising from differences in numerical methods or in the detailed dielectric permittivity distributions , we employ the eigenvalue solver of our FEM solver COMSOLMultiphysics to compute the photonic band structure. Differences occurring between band structures computed with the plane-wave expansion (PWE) method and with FEM are discussed in Appendix A. Since a photonic band structure pertains to an infinitely extended crystal, we alter our finite reflectivity computational cell by employing Bloch-Floquet periodic boundaries in all three dimensions , , and Joannopoulos2008Book . Hence, the point defect sits at the center of a supercell that is replicated infinitely.
We use tetrahedra as basic elements in our finite element mesh to subdivide the 3D computational cell into elements. To accurately mesh sharp interfaces in a 3D inverse woodpile crystal, an upper limit is imposed to the edge length on any tetrahedron in the inverse woodpile, with the maximum dielectric permittivity for the selected range of frequencies. An analysis of the mesh convergence is presented in Appendix B. For comparison, the PWE method requires Cartesian meshing which results in a less faithful discretization of the crystal structure, and hence greater systematic errors than with the adaptive mesh in FEM, as discussed in Appendix A.
To detect narrow reflectivity resonance troughs (as analyzed in Appendix C), we used a frequency resolution footnote:ReducedFrequency below the 3D band gap and in the 3D band gap, therefore we were able to resolve quality factors as high as . All calculations are performed on the “Serendipity” cluster in the MACS group at the MESA+ Institute Serendipity . Even on this powerful computer cluster, the computation of a single spectrum as shown in Fig. 2 takes more than hours or days.
III Results
III.1 Reflectivity resonances within the 3D band gap
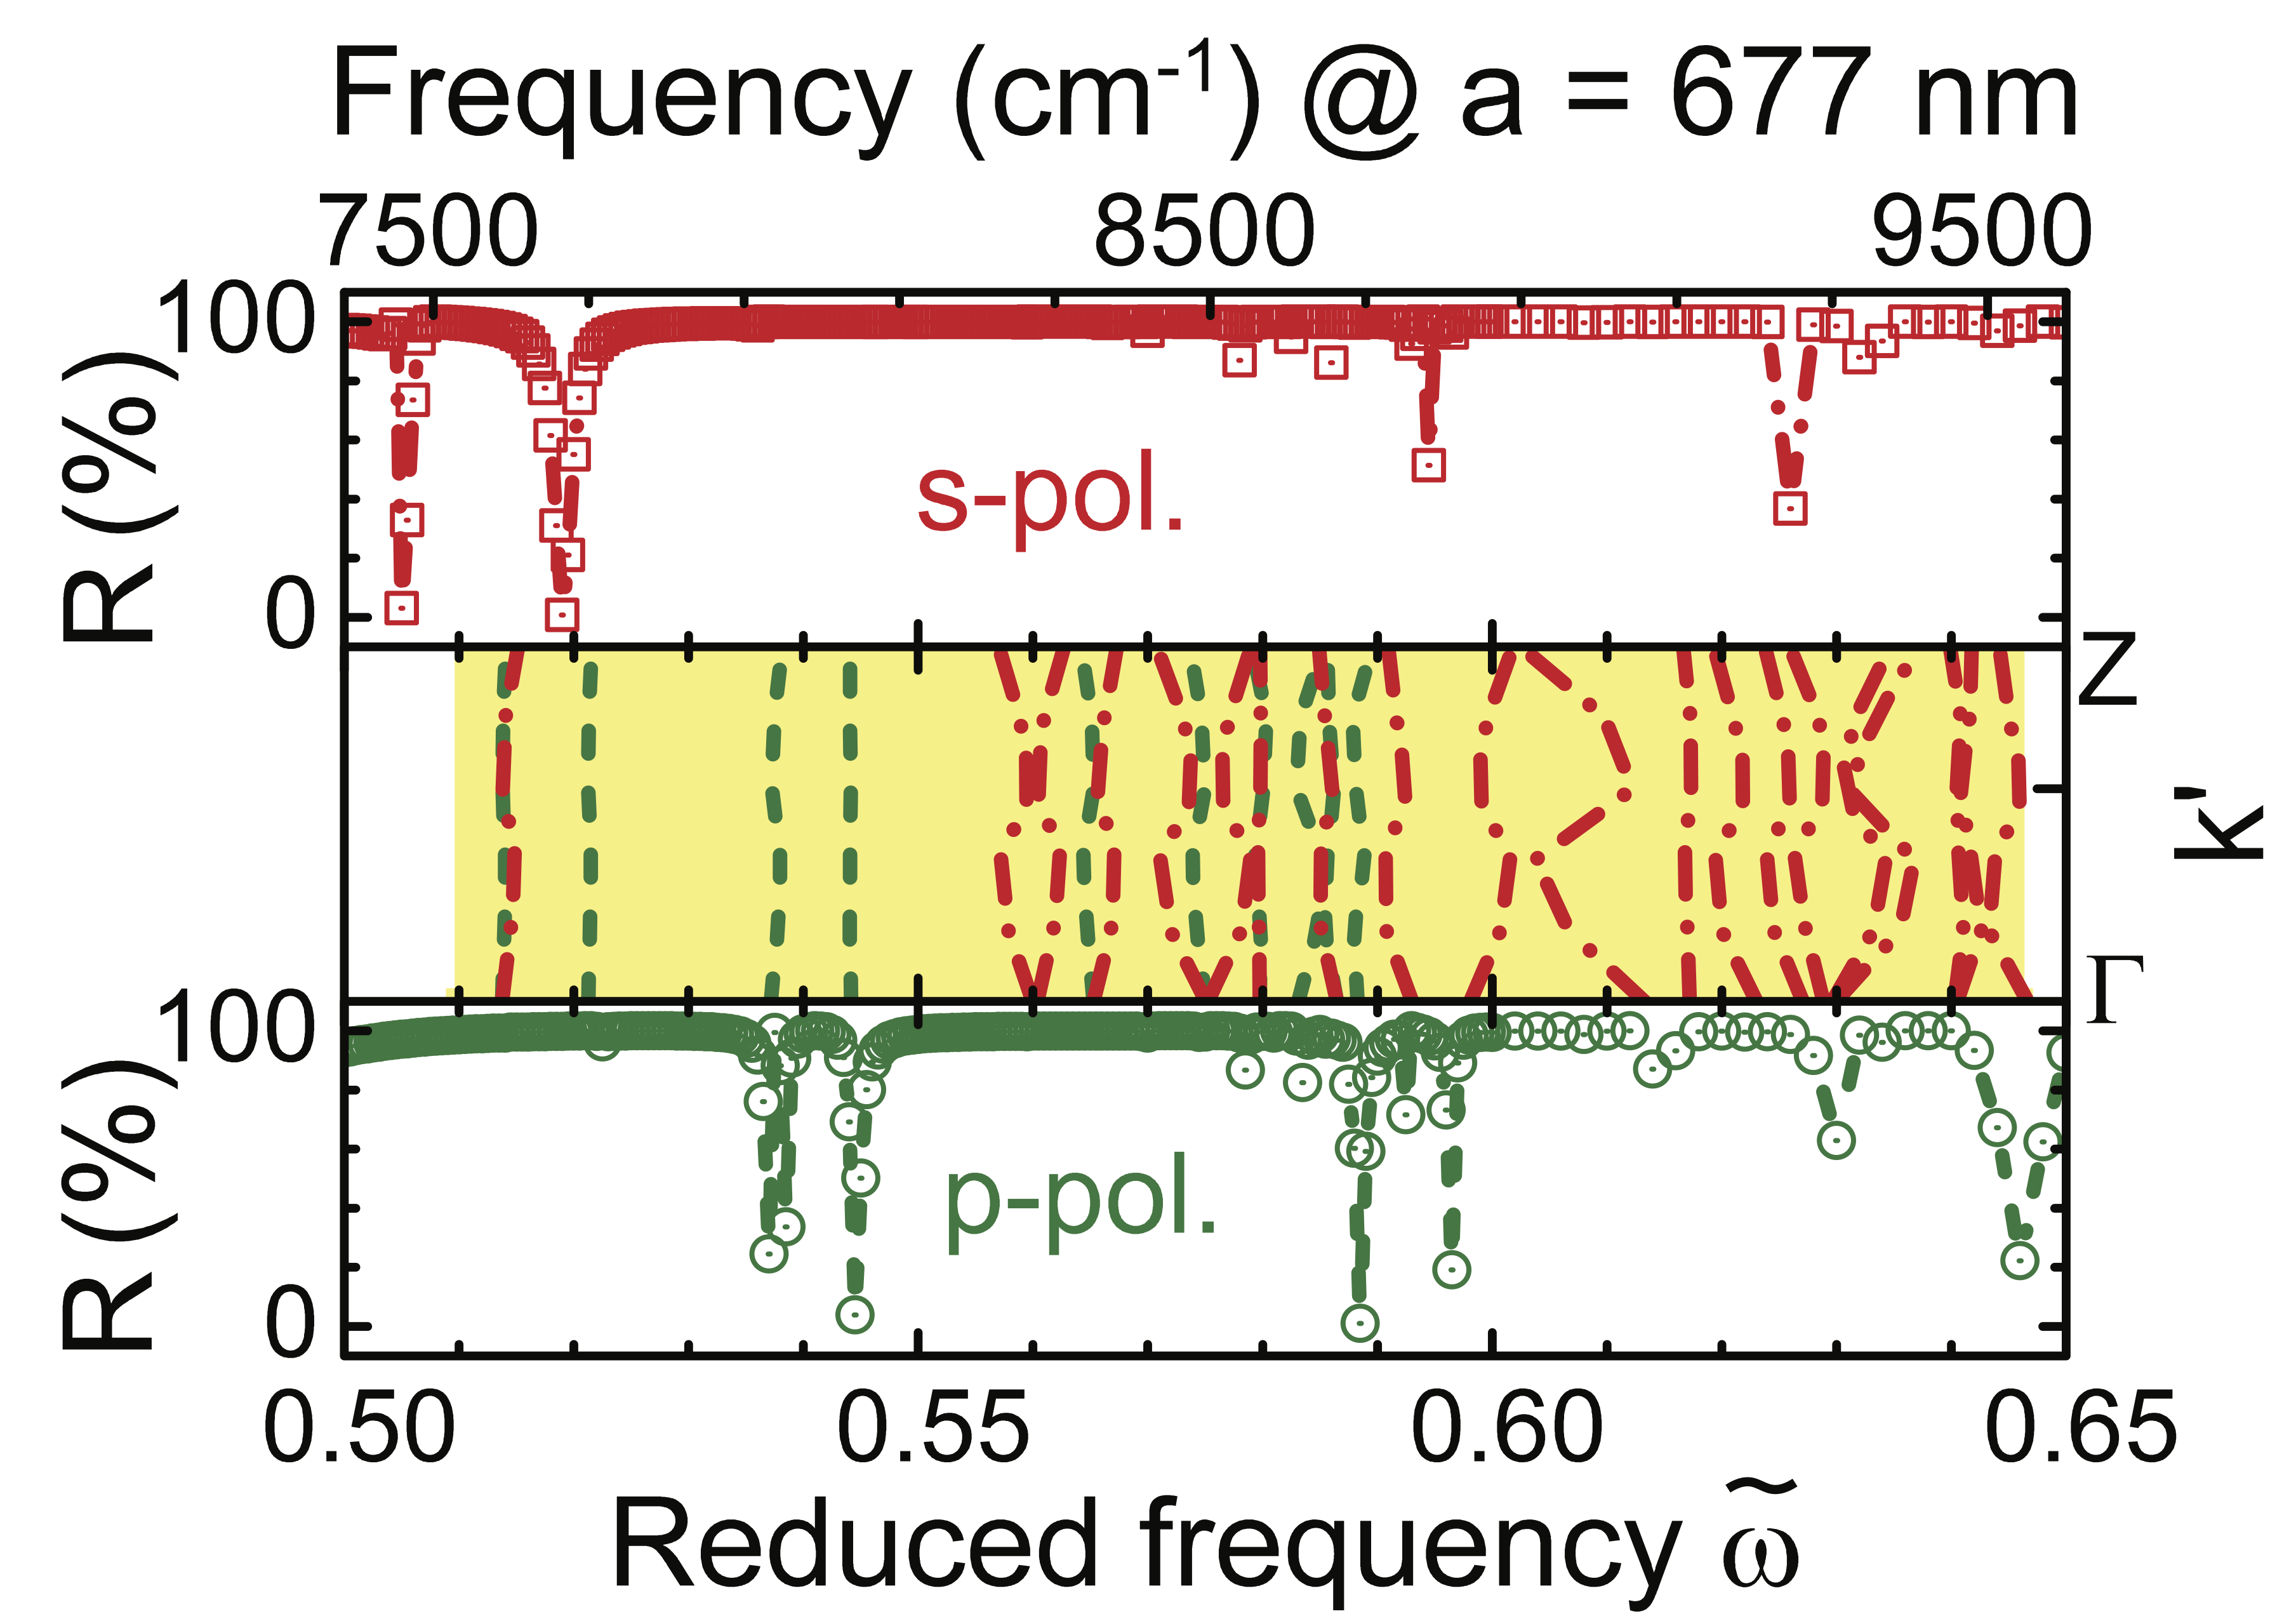
The central panel of Fig. 2 shows the polarization-resolved band structure in the high symmetry direction for a supercell of the 3D inverse woodpile photonic crystal with a point defect. For reference, the 3D photonic band gap of the perfect crystal spans from to . With increasing frequency from the bottom of the band gap, we observe that there is one isolated -polarized defect band S1 at and four isolated -polarized defect bands P1, P2, P3, and P4 at , respectively, where the S1 and P1 bands are nearly degenerate. The observation of five nearly dispersionless defect bands agrees very well with Ref. Woldering2014PRB who also reported five defect states, although the polarization of the states was not identified footnote:ComparisonToHack2018 . The central panel of Fig. 2 reveals numerous other and defect bands beyond that are possibly due to waveguiding along the defect pores. Since these bands are neither isolated nor dispersionless, we do not consider these to be cavity resonances, similar to Ref. Woldering2014PRB . For clarity, we note that these defect modes are fully vectorial in character. In this paper, we refer to them as or -polarized only to indicate their symmetry properties, which allow them to be excited either with or -polarized incident light. The frequencies reported in Ref. Woldering2014PRB are nearly higher than the present results, which is attributed to the different numerical methods (PWE versus FEM) with concomitant different spatial meshing and resolutions, see Appendix A.
Naively, one may expect a resonance trough in reflectivity for each of the five defect bands. To identify such resonance troughs, we calculate reflectivity inside the 3D band gap at normal incidence for a supercell of the 3D inverse woodpile photonic crystal with a point defect. The top and bottom panels of Fig. 2 show the reflectivity spectra for and polarizations, respectively. For both polarizations, however, we observe only four reflectivity resonances, namely one -polarized one at , and three -polarized ones at . Moreover, it is remarkable that there do not seem to be reflectivity counterparts for the S1-band at , and for the two -bands at and . Thus, this straightforward inspection of the reflectivity spectra does not allow to identify reflectivity resonances in the finite-support crystal with defect states in its infinite counterpart, and a more advanced approach is needed.
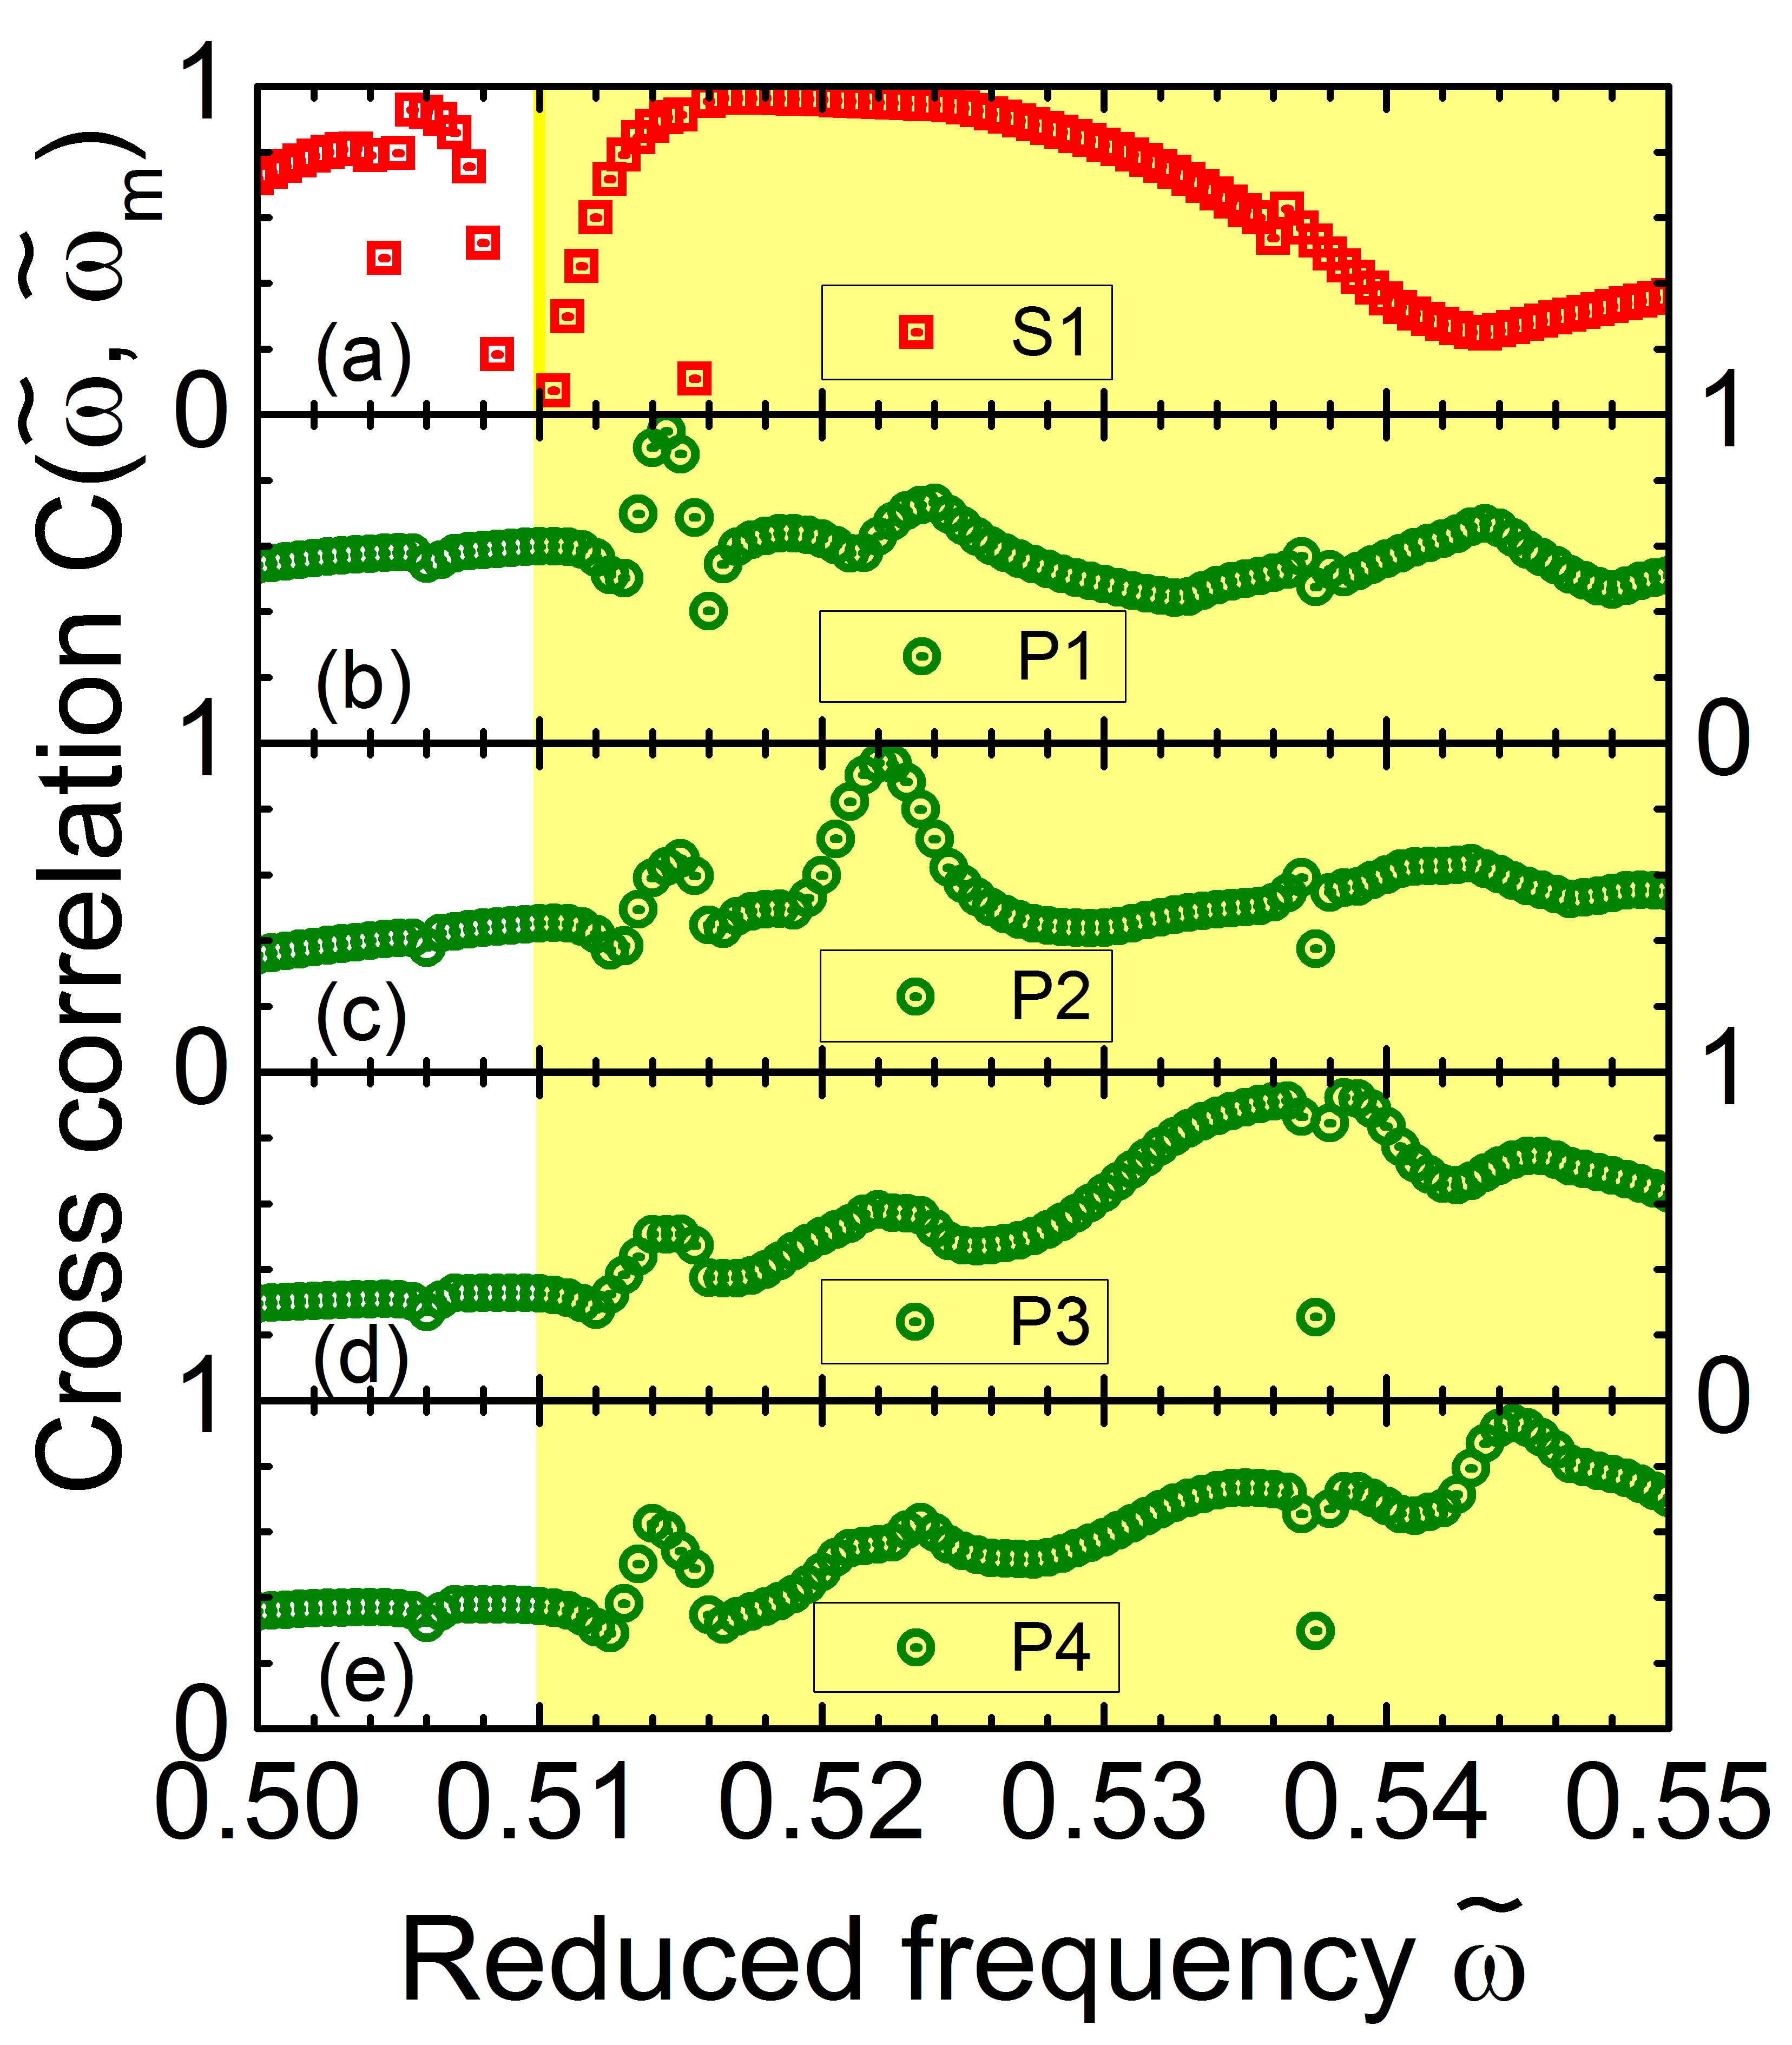
To match a reflectivity trough of a finite crystal slab to a corresponding defect band of an infinite crystal, we cross-correlate the spatial distribution of the electric-field norm of a defect band at frequency with the field in the finite crystal slab calculated as a function of frequency . To keep the computation tractable footnote:NormEField , we consider the field distributions and in the cross section through the center of the cavity at the reference position for the infinite crystal and at for the finite-support crystal, see Fig. 5 for such field patterns. The normalized cross-correlation is defined as
| (1) | ||||
When the position of the cavity in the finite-support crystal is matched to the position in the infinite crystal, , and is at a maximum; in Fig. 3 we plot . A reflectivity resonance with a field that cross-correlates to at its central frequency will correspond to a defect state at . In addition to the field cross-correlation, we also confirm the cavity resonance by the visual inspection of the cross sections of the electric-field distributions, and we verify the 3D band gap confinement of light by checking the angular independence of a reflectivity resonance. From the five resonances S1, P1, P2, P3, and P4, it appears that P1, P2, and P4 show relatively straightforward behavior, therefore we first discuss these three resonances, before analyzing the more complex behavior of S1 and P3 resonances.
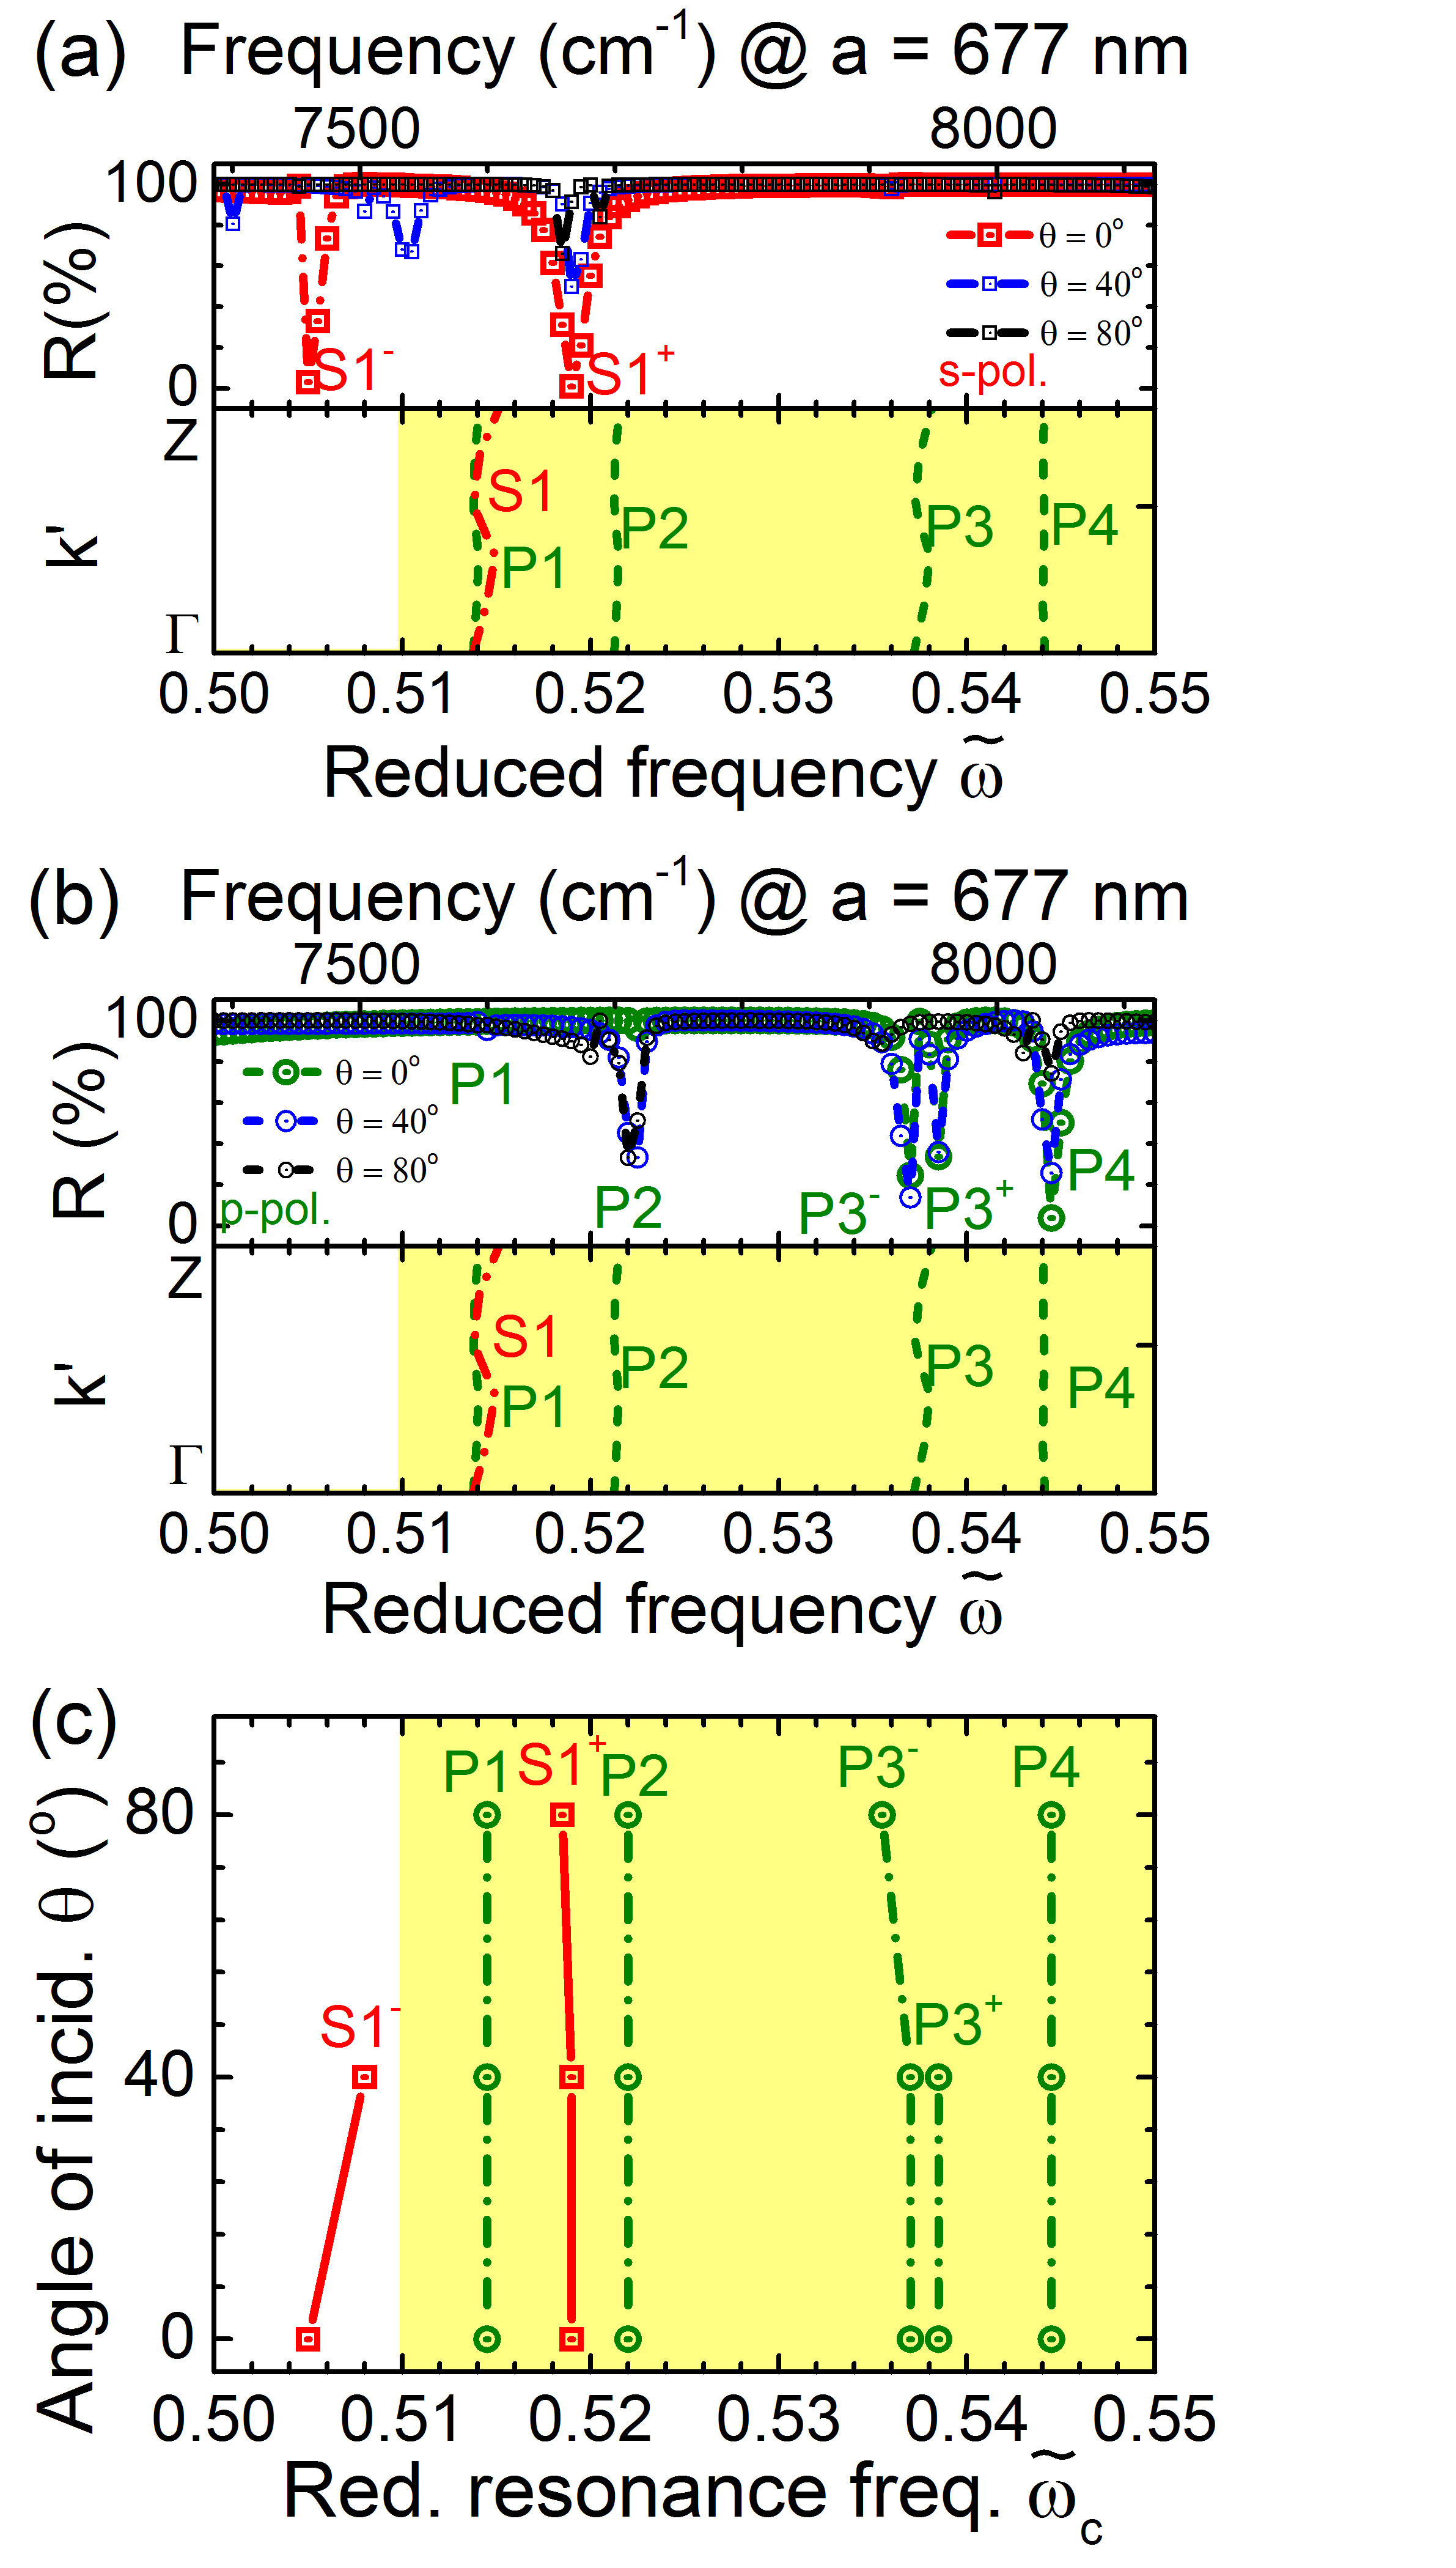
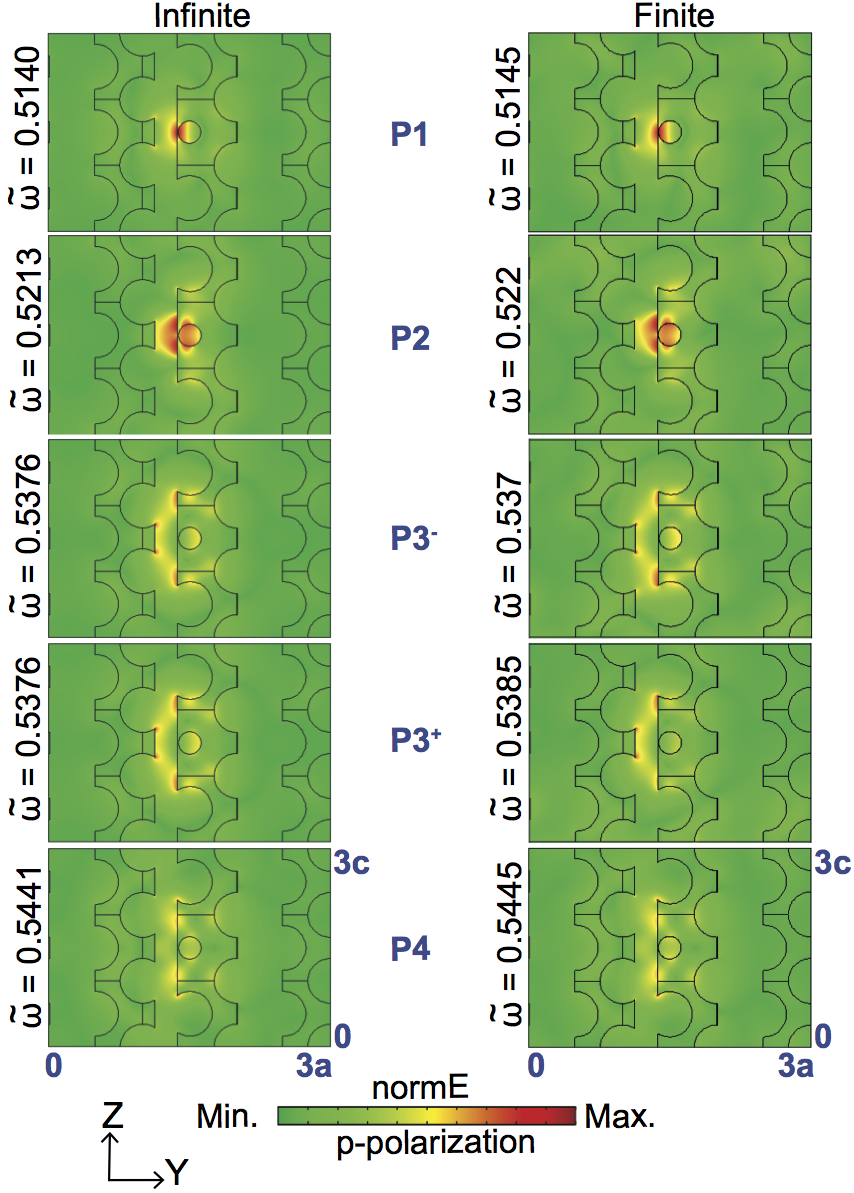
P1 resonance: In Fig. 3(b), the cross-correlation of the field of the P1 defect band at with the finite-crystal fields equals about 0.6 at most frequencies, with a marked peak at . This cross-correlation peak with corresponds to a weak resonance trough in reflectivity () at normal incidence. Upon varying the angle of incidence, we observe that the reflectivity resonance becomes a bit more prominent (), and that the reflectivity resonance frequency is independent of angle, as shown in Fig. 4. In addition, Fig. 5 shows that the spatial field distribution for the defect band in the infinite crystal matches very well with the field distribution of the resonance in the photonic crystal with finite support. Therefore, from all three main observations (correlation, angle-independent reflectivity resonance, and spatial field distribution) we identify the P1 defect band to occur in reflectivity at with a field distribution shown in Fig. 5.
P2 resonance: The cross correlation of the field of the P2 defect band at in the infinite crystal is nearly constant at about , with a maximum at a frequency that agrees well with a weak reflectivity resonance at at normal incidence, see Fig. 4(b). With increasing angle of incidence the reflectivity resonance deepens to . The frequency of the reflectivity resonance is independent of incident angle (Figure 4) as expected for a cavity resonance in a 3D band gap. Figure 5 shows that the field distribution in the infinite crystal agrees very well with the field distribution in the finite crystal slab. We note that the P2 field distribution resembles the P1 field distribution, since there is a secondary cross-correlation peak at the P1-resonance at in Fig. 3. Thus, we identify the P2 resonance to occur at with a field distribution as shown in Fig. 5.
P4 resonance: The cross correlation of the P4 defect band at in the infinite crystal (Figure 2 with the finite crystal field distributions is nearly constant at about (Figure 3 (e)). At , the cross correlation has a maximum at that agrees well with a strong reflectivity () resonance at at normal incidence (see Fig. 4(b)). With increasing angle of incidence the reflectivity resonance changes to or . The reflectivity resonance is independent of incident angle (Fig. 4), as expected for a cavity resonance in a 3D band gap. Finally, Fig. 5 shows that the spatial field distribution in the infinite crystal defect band agrees very well with the field distribution in the finite crystal slab. The cross-correlation shows that the P4 field distribution resembles the P3 field distribution in view of a secondary cross-correlation peak at and in Fig. 3. Thus, we identify the P4 defect band to occur at with a field distribution as shown in Fig. 5.
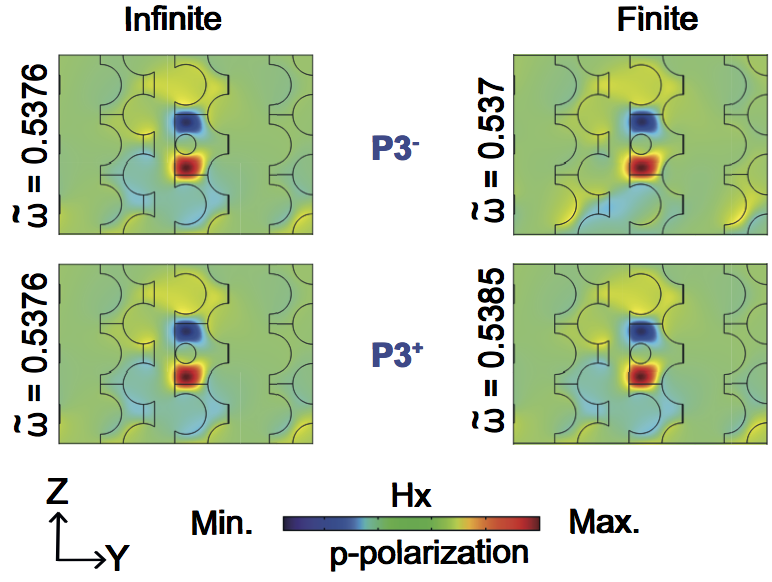
P3 resonance: The P3 defect band at in the infinite crystal reveals a surprising double cross correlation peak with at and , see Fig. 3. Indeed the reflectivity spectrum also shows two corresponding resonance troughs at and , see Fig. 4(b). These two troughs are symmetrically located on either side of the defect band . Both troughs develop deep minima () versus angle of incidence, and their resonance frequencies are independent of angle (Fig. 4), typical of 3D photonic band gap cavity resonances. Figure 5 shows that the spatial electric-field distribution of the P3 defect band matches very well with both field distributions at the lower () and upper () reflectivity resonances. Since the magnetic field of an electromagnetic wave is complementary to the electric field and thus holds additional information Griffiths1998Book ; Burresi2009Science , we show the magnetic-field distributions for both the infinite crystal and the finite-support crystal in Fig. 6. We see that both the field distributions and the phases of both finite-crystal resonances match very well with the distribution and phase of the single P3 defect state in the infinite crystal, which confirms that both finite-size resonances derive from one and the same resonance in the infinite crystal.
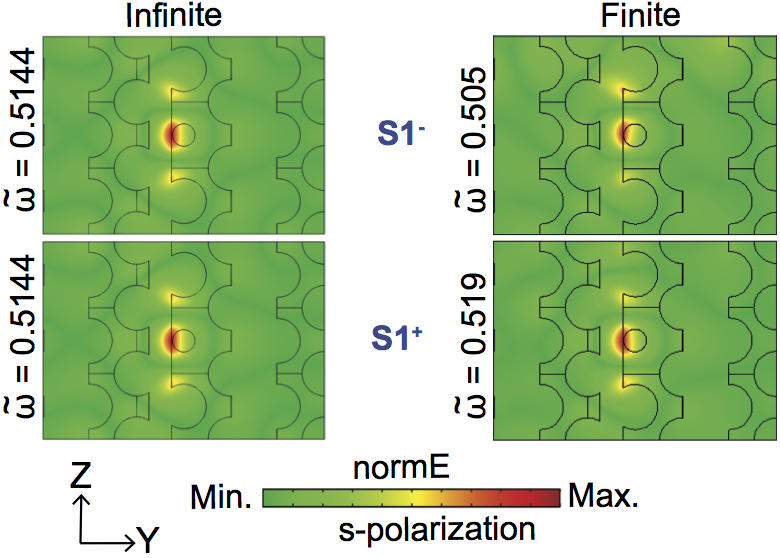
S1 resonance: The S1 field distribution at in the infinite crystal also reveals a double cross correlation peak in Fig. 3 with maxima at and at , the latter being remarkably broad. In reflectivity (Fig. 2(a)) we observe two matching resonances at normal incidence at and . With increasing angle of incidence the two reflectivity resonances reveal remarkably different behavior: the upper resonance at does not shift with angle of incidence (Fig. 4), as expected for a photonic band gap cavity. The lower resonance at (at ), however, shifts with angle of incidence since different resonances occur at or . The shift makes intuitive sense in view of the striking occurrence of this resonance outside the photonic band gap, hence no 3D confinement is expected. Nevertheless, this resonance occurs inside the polarized stop band so at least one-dimensional (1D) confinement is expected. Another remarkable feature of the S1 resonance is that the two reflectivity resonances are asymmetrically located on either sides of the defect state in the infinite-crystal at .
At this time, we do not yet have a physical explanation for the remarkable frequency splitting of the S1 and P3 defect states in the crystal with finite support. We speculate whether a hybridization with surface modes or the leaking of modes of the surrounding vacuum into the finite crystal slab may cause the splitting, although we are unaware why or how there could be resonant structure in the vacuum. It is also conceivable that the double reflectivity resonances are the result of the coupling of the defect state with another, as yet unidentified, resonance.
III.2 Quality factor and energy enhancement
Quality factor: Since we consider here a 3D photonic crystal with finite support, our study allows us to investigate the quality factor of all resonances. Since we perform steady-state computations, we calculate the cavity quality factor from the ratio of the central frequency and the full width at half maximum of the reflectivity resonance Feynman1964Book ; Griffiths1998Book
| (2) |

From the reflectivity spectra in Fig. 4 we obtain the bandwidths of the resonances S1-, S1+, P3-, P3+ footnote:P3Bandwidth , and P4 to be , and , respectively, which corresponds to the cavity quality factors shown in Fig. 8. The P1 , P2, P3-, P3+ resonances have the highest cavity quality factors near and the S1+ resonance has the lowest quality factor of about . Since the bandwidth of the P1 and the P2 resonances is close to the numerical resolution, we take the minimum bound for their bandwidth to be the frequency resolution , and thus a corresponding quality factor as a lower bound.
For a strong confinement of light by an optical cavity, a large quality factor is most desirable Vahala2003Nature ; Gerard1998PRL .
Hence, the P2 reflectivity resonance with has the best potential for the 3D spatial confinement of light.
This conclusion matches with Ref. Woldering2014PRB though interestingly for a different underlying motivation:
Woldering et al. concluded that the resonance is the best, since it is most isolated as it has the greatest frequency difference to the other defect states Woldering2014PRB .
Energy enhancement: Considering the electric-field distributions of Figs. 5 and 7, we note that the electric field is strongly concentrated in the proximal region of the two orthogonal defect pores for all cavity resonances. We observe that the cavity resonances are localized both in silicon and in air, e.g., the S1+ and P1 resonances have field maxima in the silicon backbone, whereas the P2 resonance has maxima in both air and in silicon. Therefore, to accurately quantify the energy enhancement at a frequency in the reflectivity spectra with respect to the reference frequency , we employ the definition
| (3) |
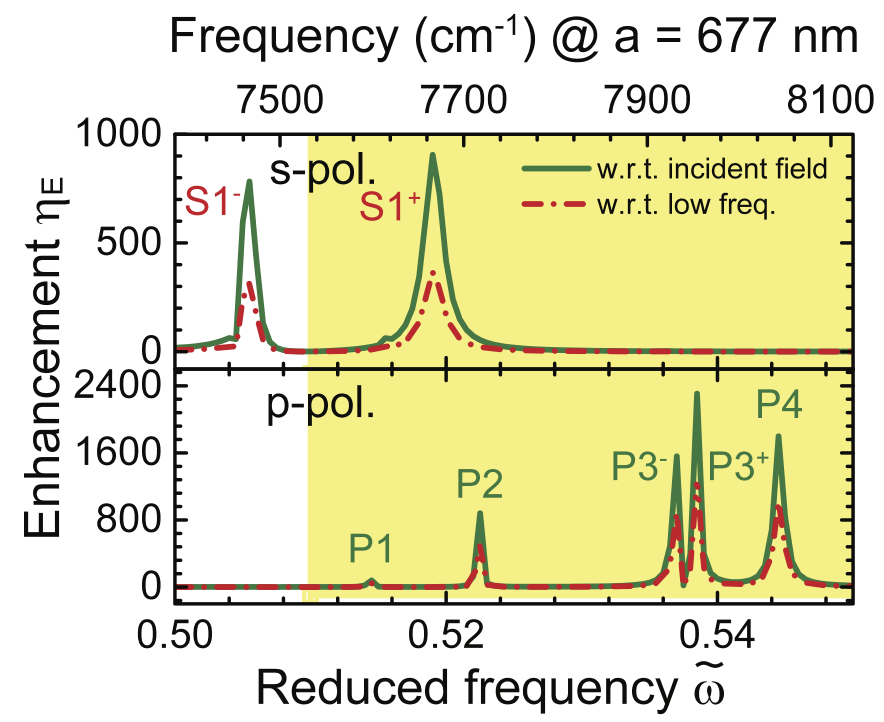
where we choose the integration volume as , the volume of one unit cell of the cubic inverse woodpile photonic crystal. To normalize the energy density, we consider two reference states, namely vacuum (by computing the energy density outside the crystal), or the homogeneous effective medium (by considering light at a low frequency below the gap). Figure 9 shows the enhancement between and for both polarizations. We observe large -fold energy enhancements at frequencies pertaining to the reflectivity resonances, i.e., S1-, S1+, P3-, P3+, and P4, which confirms our results regarding the identification of these resonances. The enhancement of the S1+ resonance is nearly equal to the one for the P2 resonance. The energy enhancement is maximum for the P3-, P3+, and P4 resonances, reaching up to .
III.3 Enhanced absorption
To benefit from the large energy enhancement at the reflectivity resonances, we investigate the possibility of using a 3D silicon inverse woodpile with a resonant cavity as an absorbing medium in the visible part of the spectrum, for instance, for an optical sensor or a solar cell. It is well known that a thin submicron silicon film absorbs weakly in the wavelength range from to nm Chopra2004PPRA ; Green2007JMS . To enhance the absorption in this range we tailor the lattice parameters of the inverse woodpile to nm and nm such that the reflectivity resonances occur in this range. To make our calculations relevant to future experimental work, we employ a realistic refractive index of silicon including dispersion and absorption taken from Ref. Green2008SolarEnergyMater .
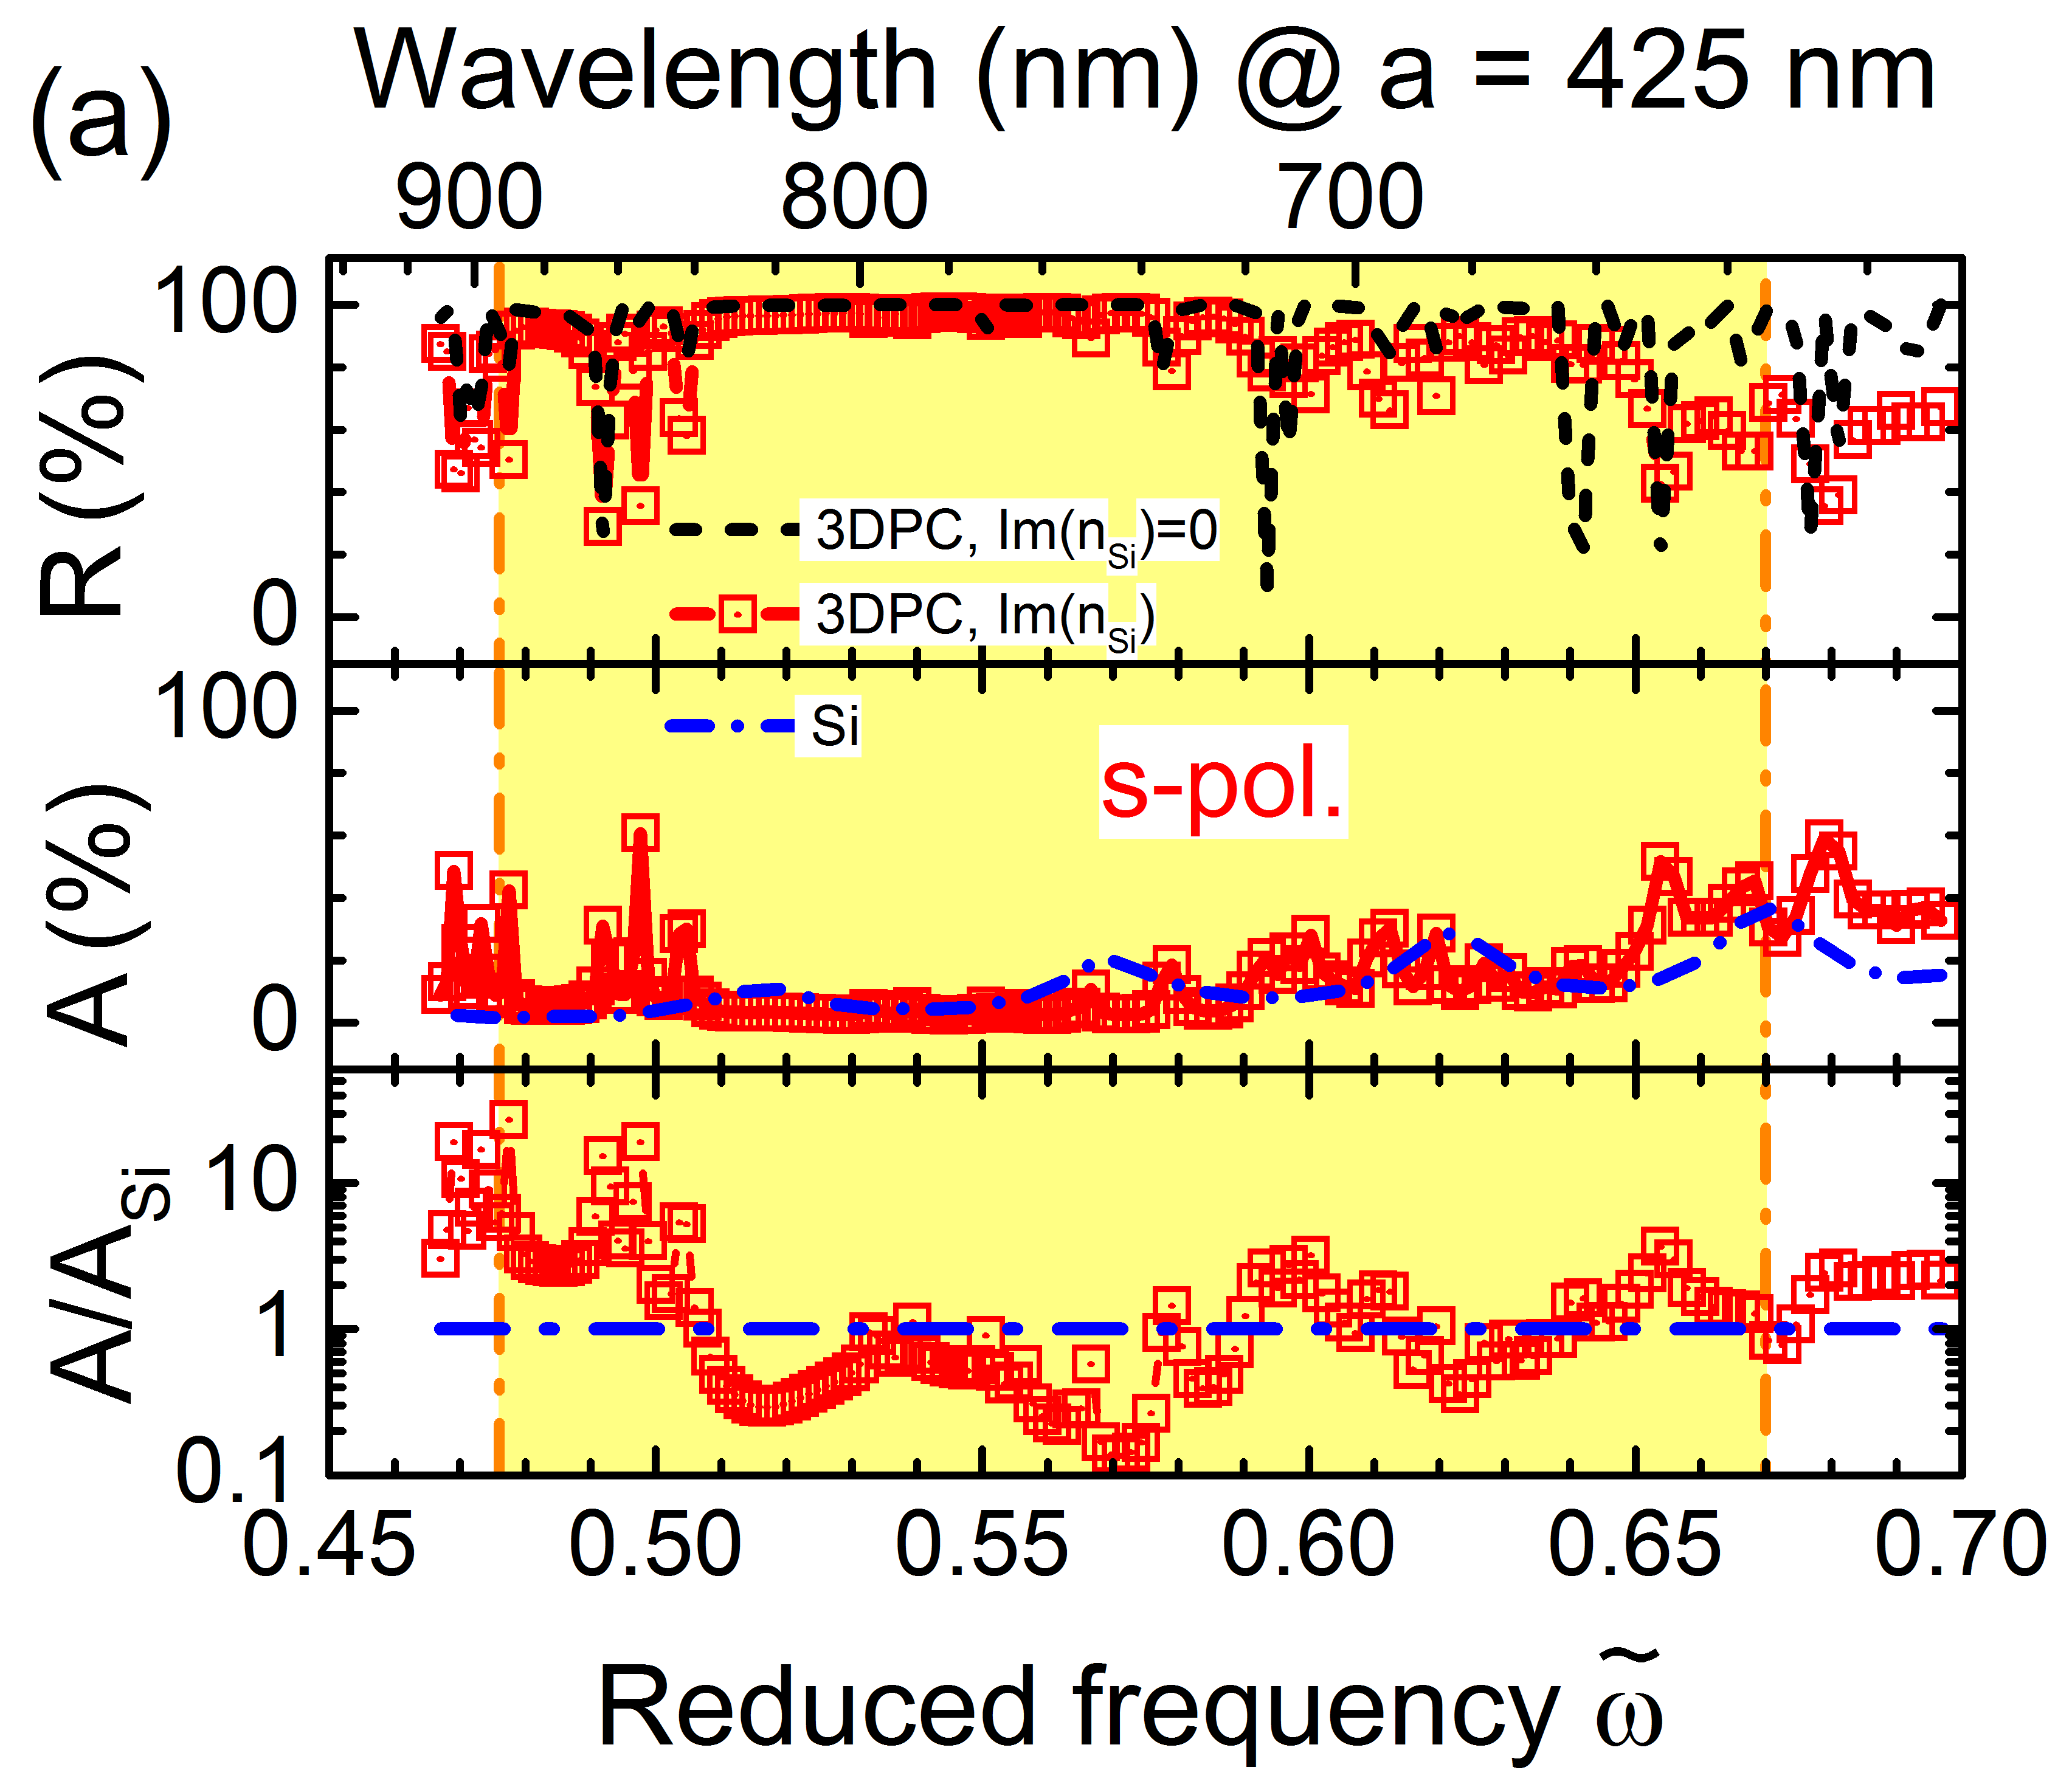
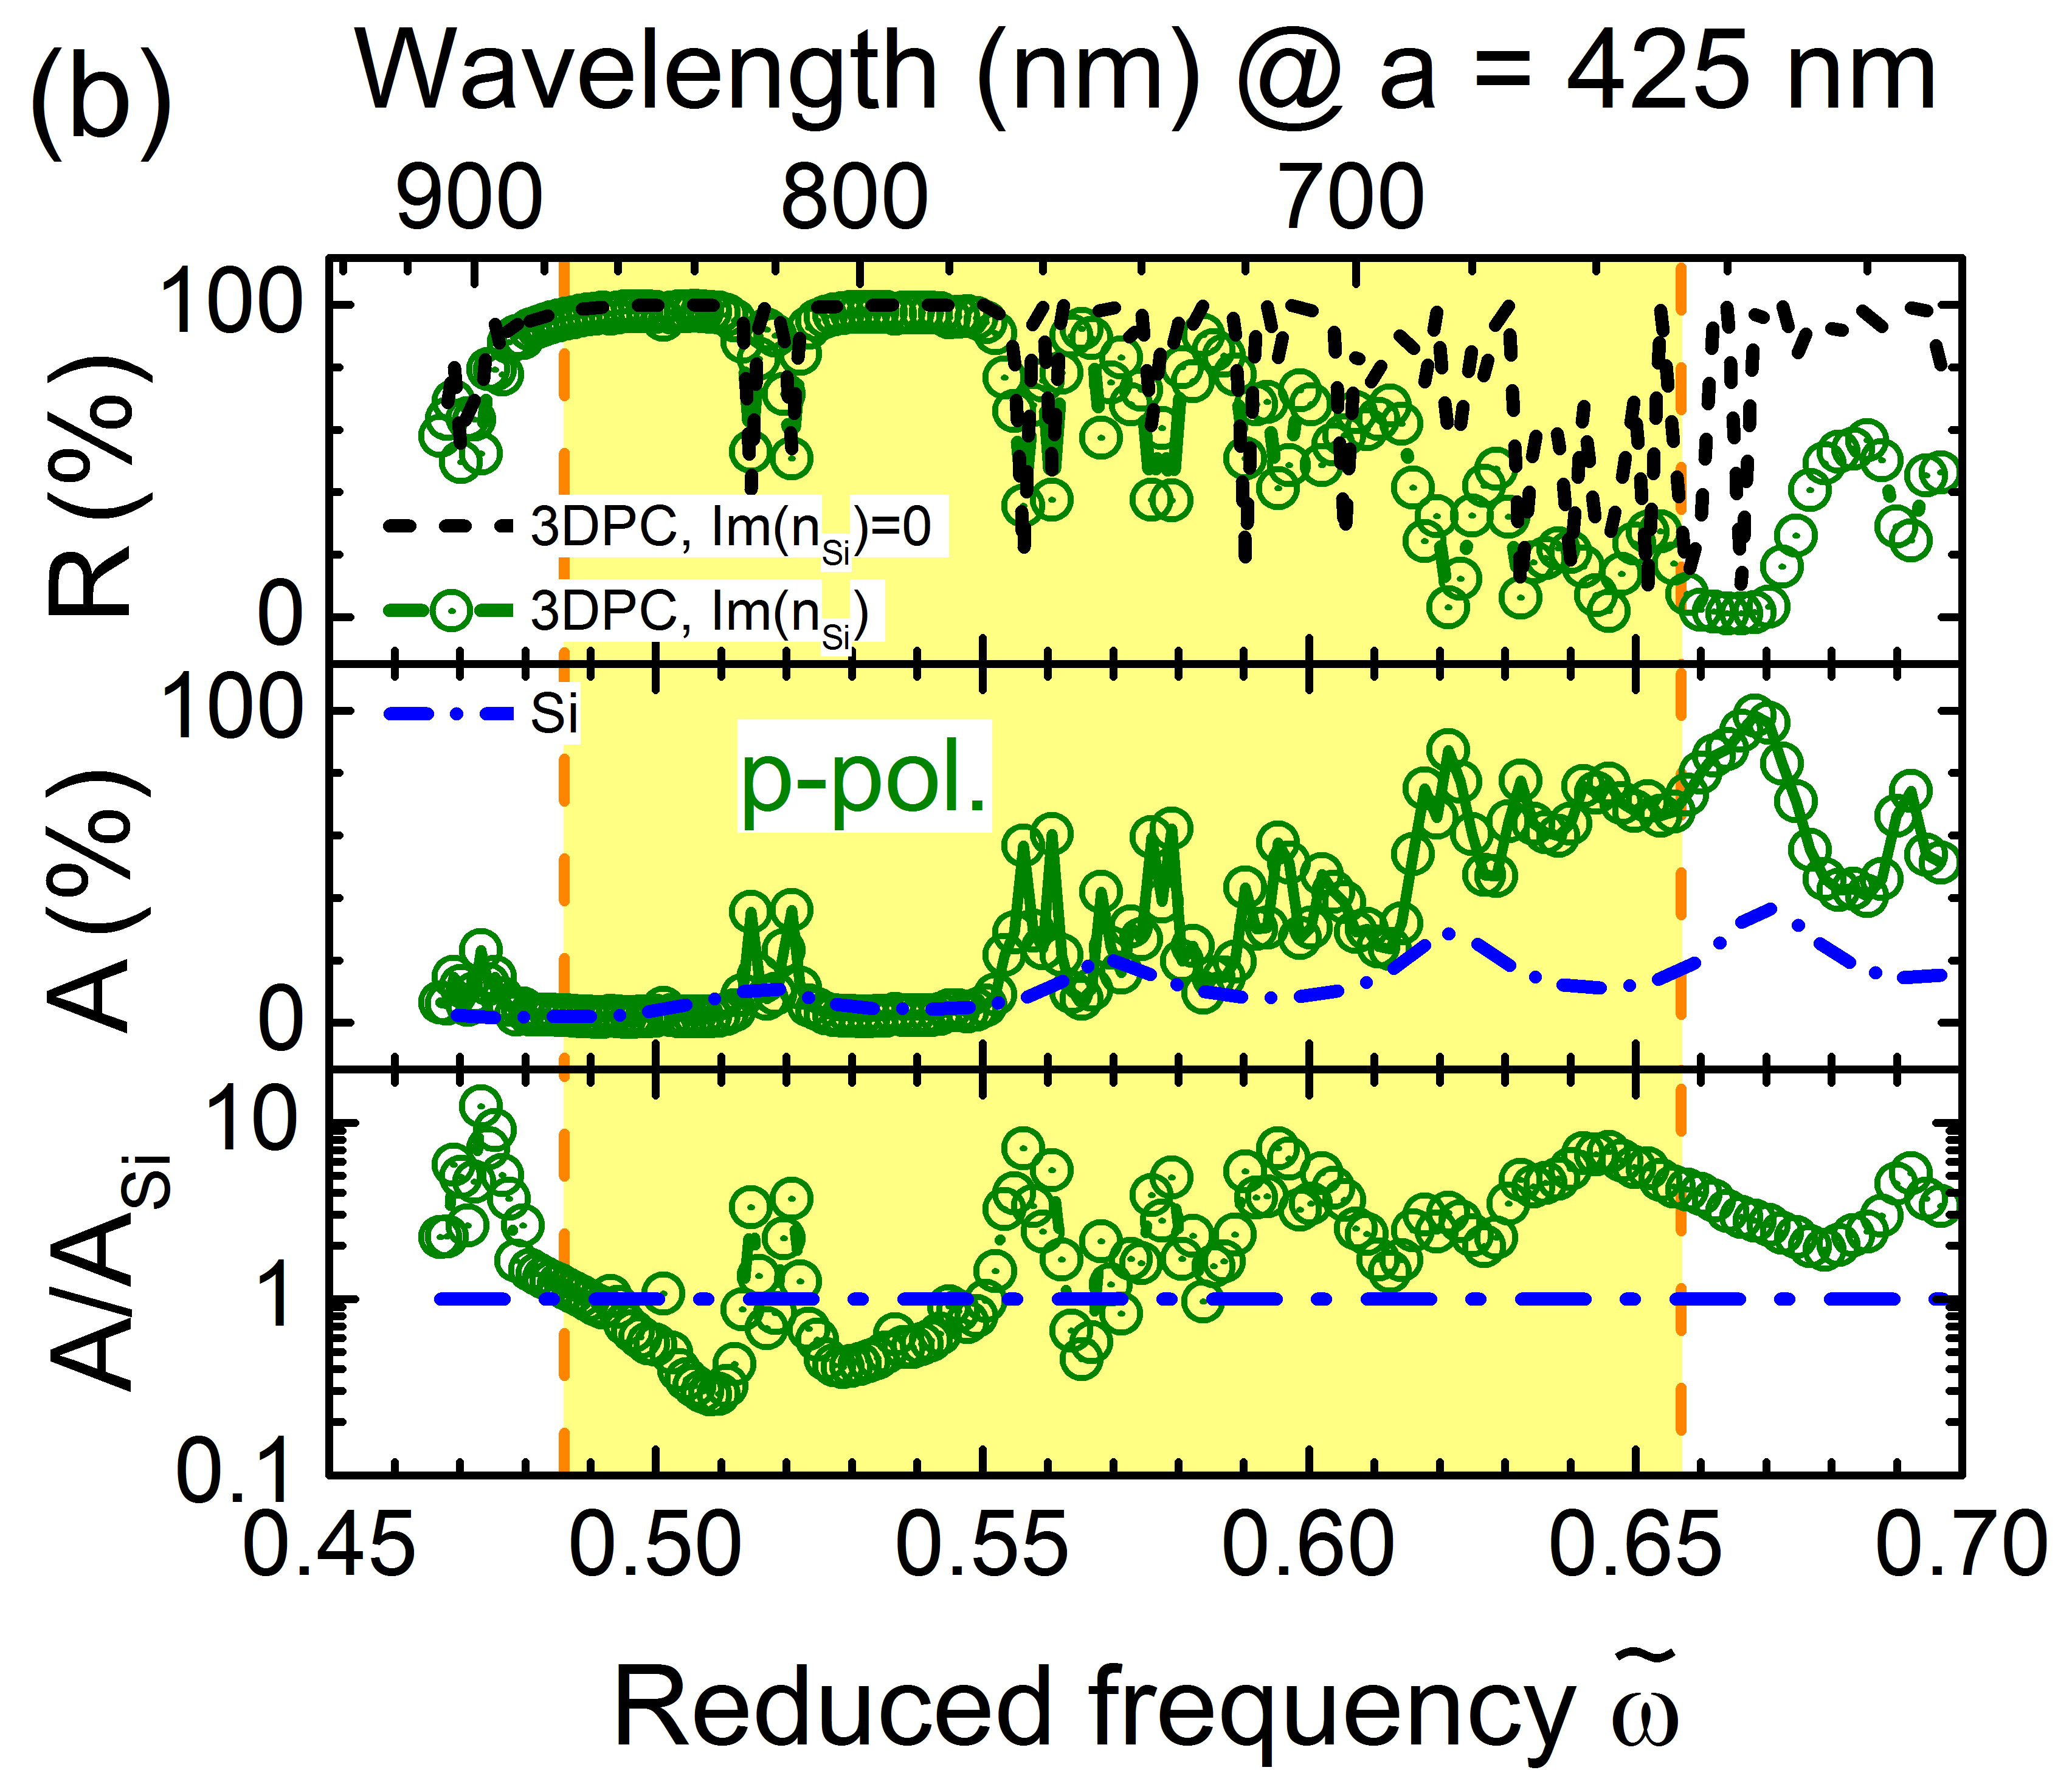
Figures 10(a,b) show reflectivity and absorption spectra for and polarizations, respectively. For an ideal inverse woodpile crystal with the same dispersive and complex refractive index, we find in separate calculations that the -stop band appears between and (Fig. 10(a)), and the -stop band in between and (Fig. 10(b)). Compared to an ideal inverse woodpile crystal with a refractive index typical of silicon in the near-infrared below its electronic bandgap including the telecom ranges (see Ref. Devashish2017PRB , Fig. 7), we find that the and stop bands in Fig. 10(a,b) are shifted to lower reduced frequency. This shift makes sense since the refractive index in the visible range is greater than at optical frequencies below the electronic band gap Green2008SolarEnergyMater .
For the inverse woodpile crystal with cavity, we observe in Fig. 10(a,b) that there are numerous narrow resonance troughs in the absence of imaginary refractive index. For instance, for polarization we see narrow resonances at , , , , and for polarization at , , , . When we introduce the imaginary part of the silicon refractive index, there are still resonances that even appear at the same frequencies as for zero imaginary refractive index. To profit from the identification of the finite-support resonances in Section III.1 where a purely real refractive index was used, we compare the reflectivity spectra in the top panels of Figs. 10(a,b) both without and with imaginary part of the silicon refractive index. It is remarkable that in presence of the imaginary part of the refractive index several resonances are more pronounced than in absence of imaginary index, for instance, at and for polarization and at and for polarization. In terms of a 1D planar Fabry-Perot microcavity model Gerard2003TAP , we propose that the imaginary index effectively increases the reflectivity of the (photonic crystal) mirrors that surround the defect cavity, hence the resonance’s amplitude increases.
As a first step to investigate possible photovoltaic functionality of the 3D inverse woodpile photonic crystal, we calculate absorption and enhancement spectra that are shown in the middle and bottom panels of Figs. 10(a), (b) for both and polarizations. We compare the absorption of an inverse woodpile crystal with thickness nm to the absorption of a thin homogeneous silicon film of equal thickness nm. We observe that at reduced frequencies beyond 0.55, an inverse woodpile crystal has substantially greater absorption than a homogeneous thin film, especially for polarization with enhancement as high as , see Figs. 10(a), (b) bottom panels. The absorption peaks near for polarization and for polarization are similar to corresponding cavity resonances identified above in Section III.1.
In addition to remarkable absorption, a 3D inverse woodpile photonic crystal has the advantageous feature that it is much rarified compared to bulk silicon, as it contains only volume fraction silicon Devashish2017Thesis and is thus lighter than a bulk silicon device with the same thickness. On the other hand, it is known that the photocurrent density depends not only on the optical absorption but also on the surface recombination of excited charge carriers Pankove000book . Since an inverse woodpile crystal has a large surface area per unit cell compared to a thin homogeneous film, surface recombination requires further investigation to ascertain whether the enhanced absorption indeed leads to enhanced photovoltaic efficiy. Hence, a 3D inverse woodpile photonic crystal with a resonant cavity is an interesting candidate as absorbing medium to enhance the absorption of photons at multiple discrete frequencies in the visible range.
III.4 Fano resonances below the 3D band gap
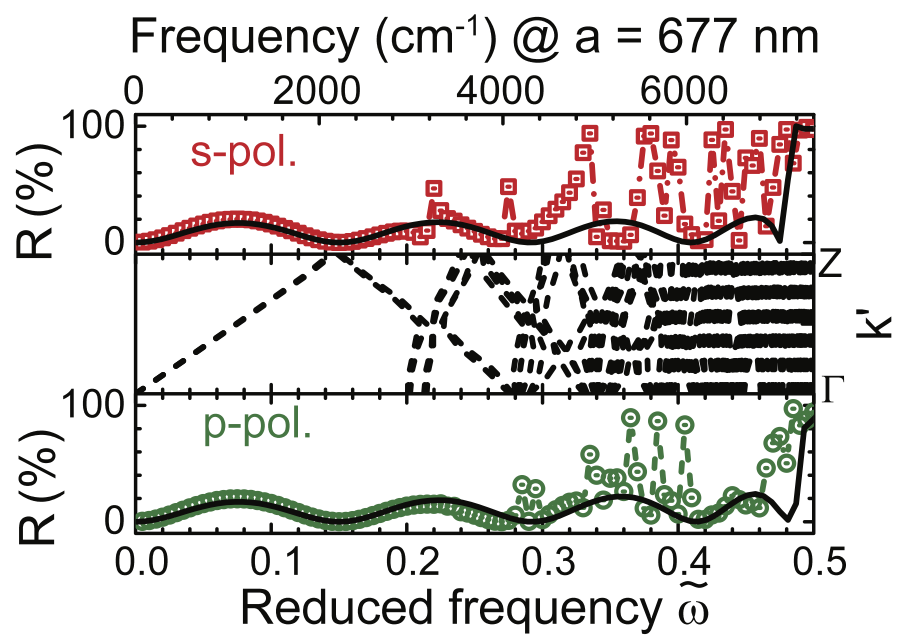
The reflectivity spectra for a perfect 3D inverse woodpile photonic crystal reveal Fabry-Pérot fringes below the stop band as a result of interference between the front and back surfaces Devashish2017PRB . To investigate the effect of a point defect on these Fabry-Pérot fringes, we calculate the polarization-resolved ( or ) reflectivity below at normal incidence to the supercell of an inverse woodpile photonic crystal with and without a point defect, see Fig. 11. Below we observe in Fig. 11 that the spectra for a photonic crystal with two line defects matches very well with the one for a perfect photonic crystal. Beyond , however, several peaks appear. These peaks are narrow and sometimes have a reflectivity near . The band structure in Fig. 11 (ii) reveal the characteristic band folding due to the supercell. The bands increase linearly up to and then fold back up to . By comparing this band structure to the corresponding reflectivity spectra, we note that fringes for a photonic crystal with a defect match with the fringes for a perfect crystal only when the bands are in the linear dispersion regime , that is, below . Therefore, these narrow peaks in the fringes correspond to frequency ranges of band folding.
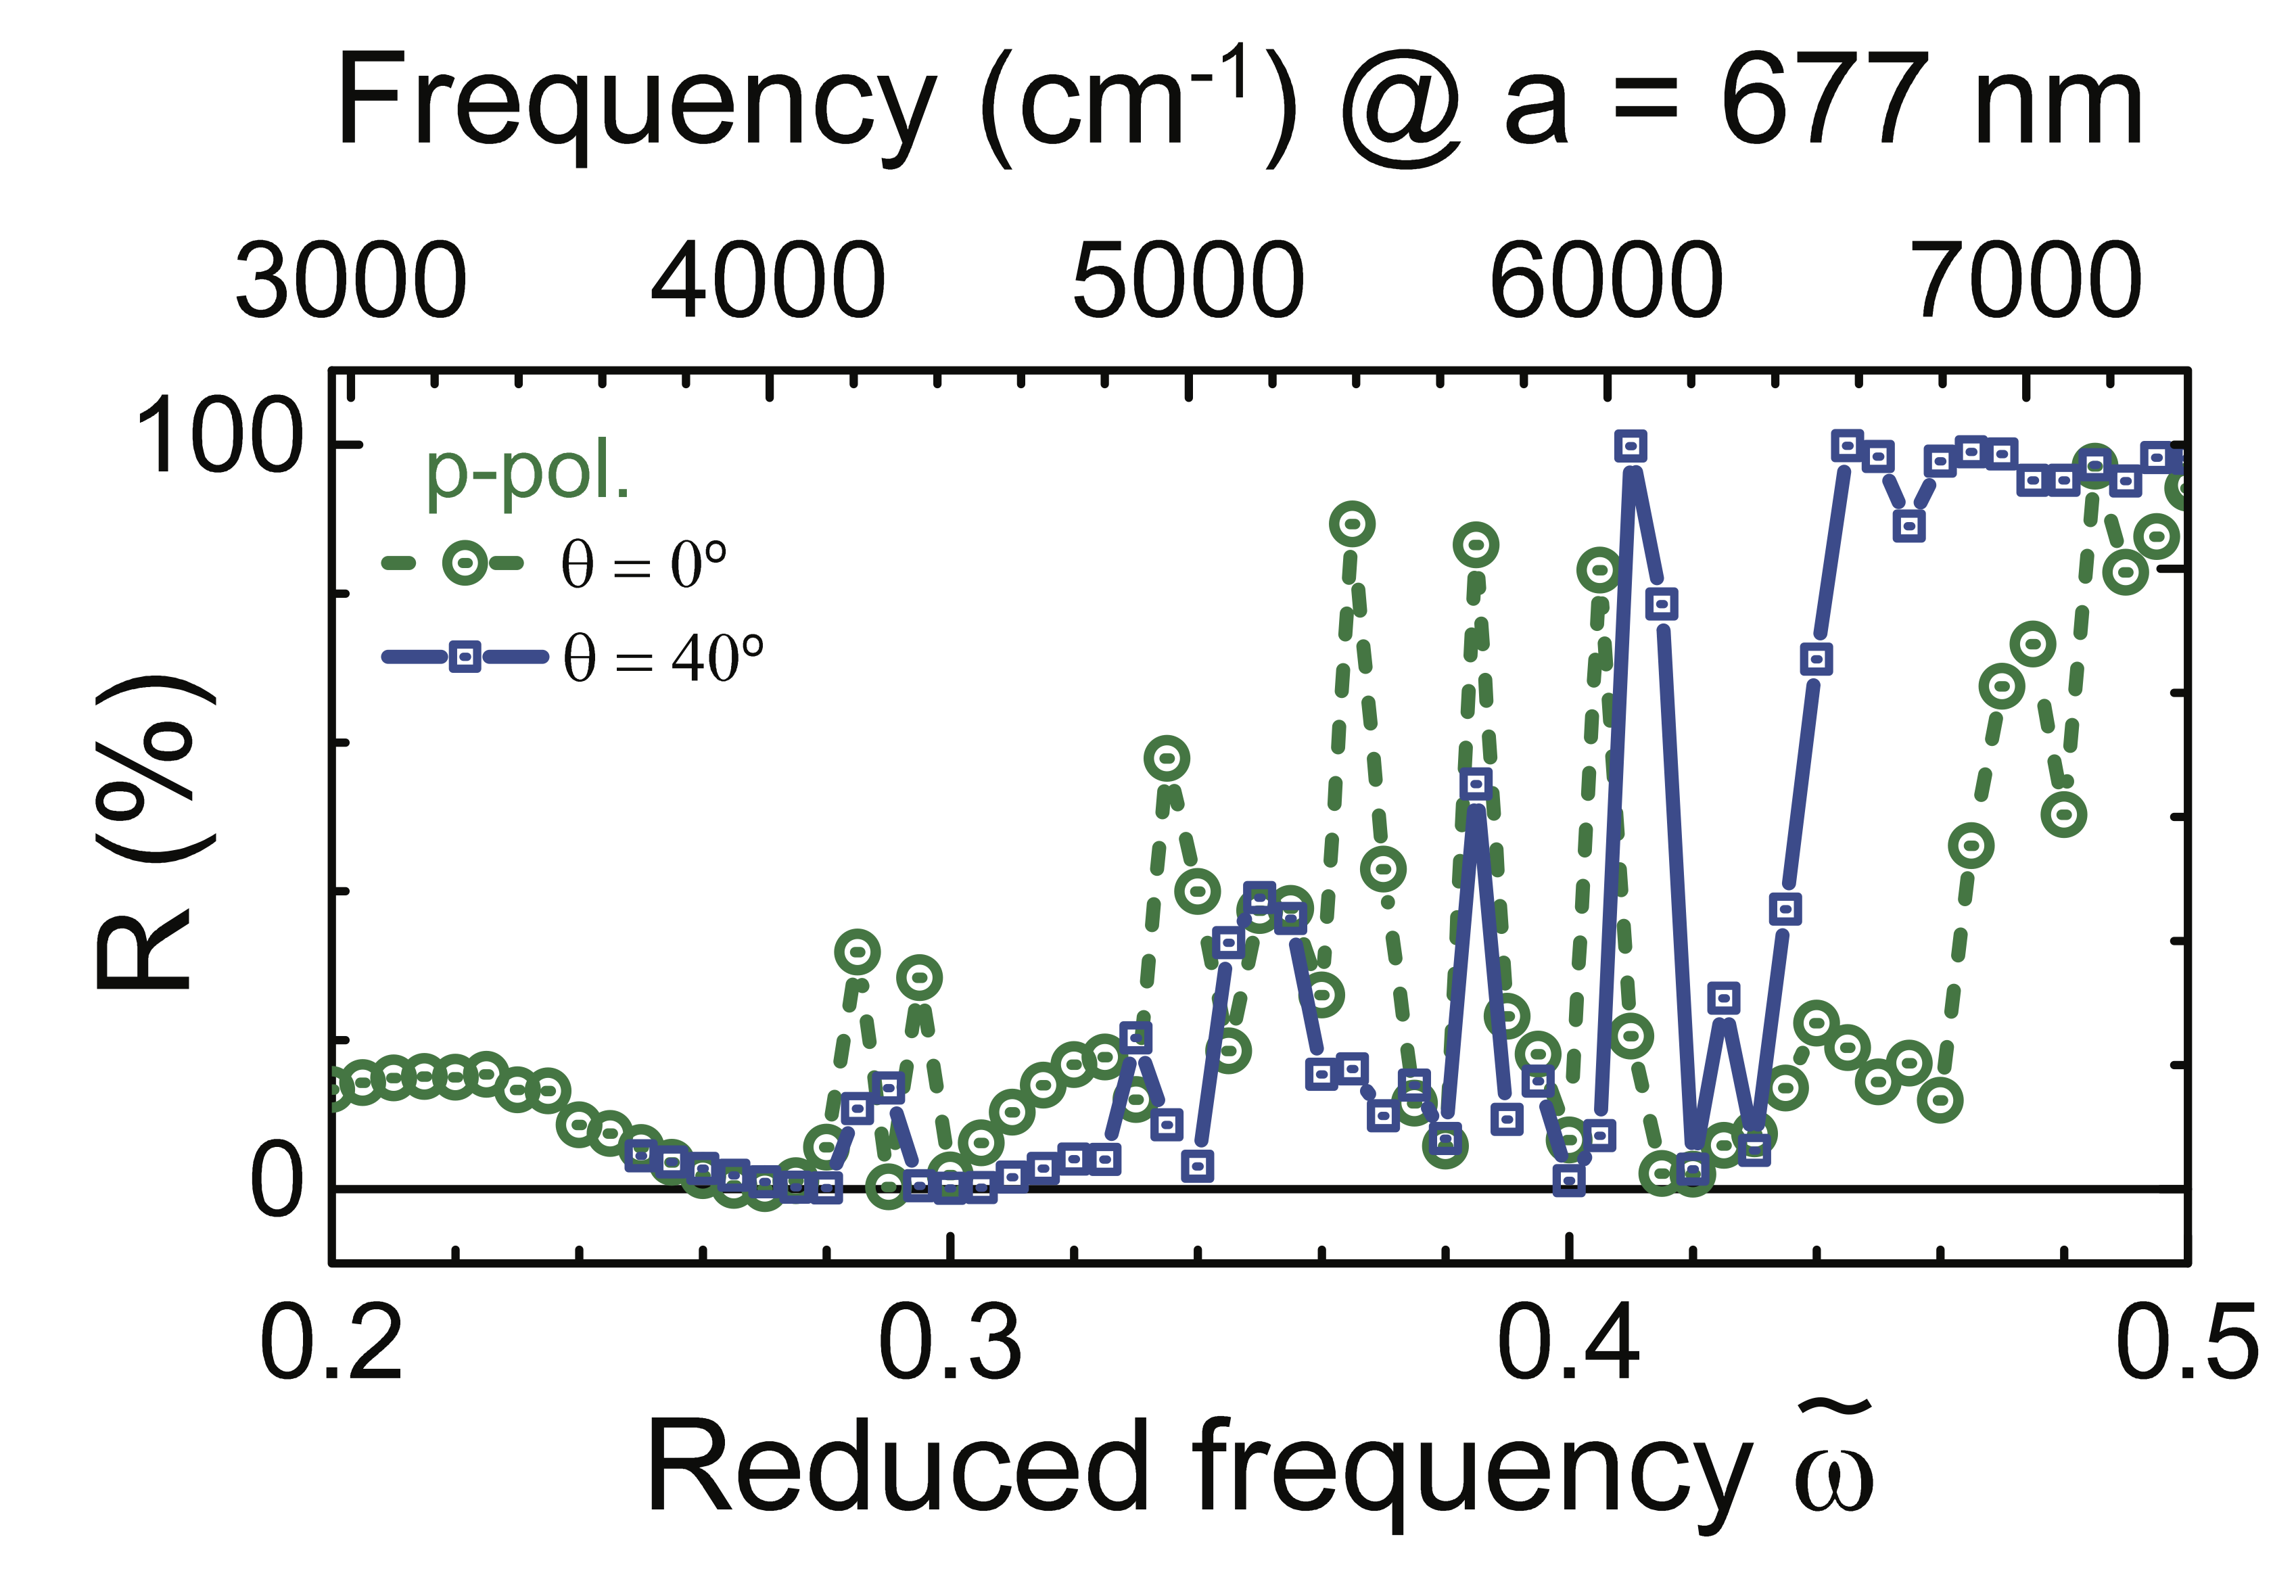
To verify the confinement of light in real space at these peak frequencies, we investigate the angle-dependence of the peaks. Figure 12 shows the reflectivity for a photonic crystal with a point defect between and at incident angles and . We observe that there are peaks on top of the low-frequency Fabry-Pérot fringes for both incident angles. Most of these peaks vary with incident angle, unlike the cavity resonances in Section III.1, and thus these peaks are not cavity resonances.
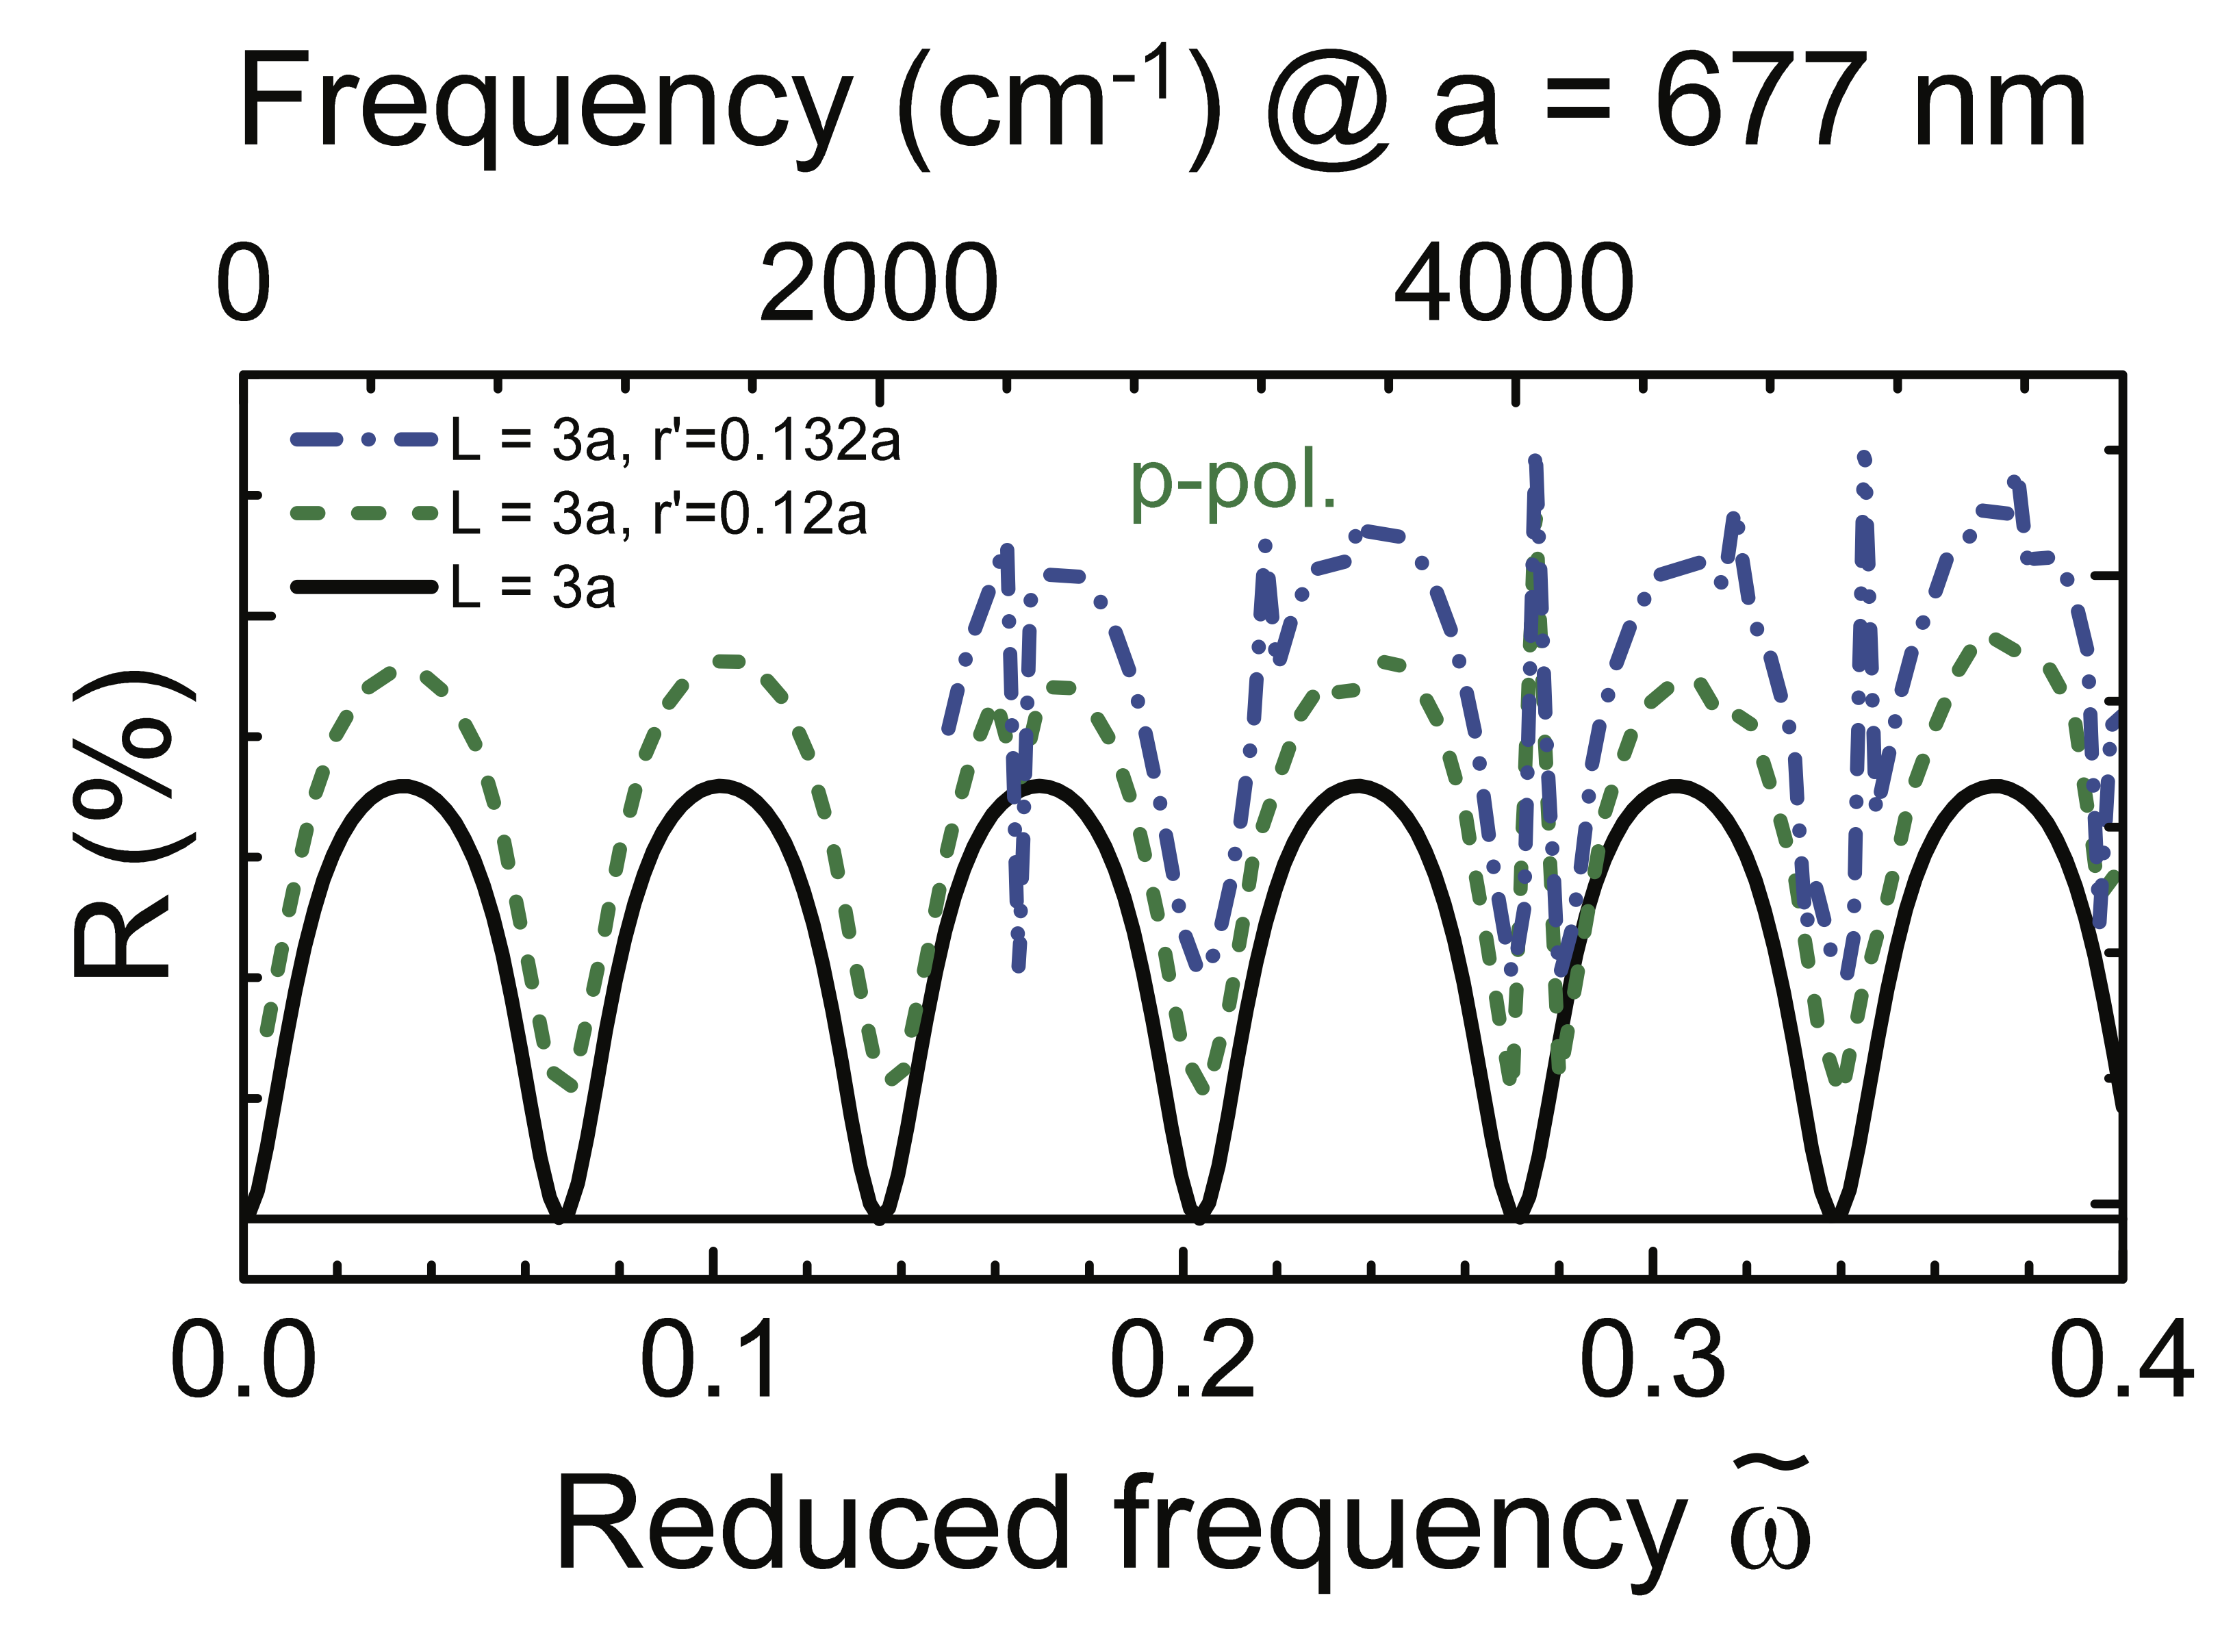
To understand the origin of these peaks, we simplify the problem by studying a homogeneous thin silicon film ( nm) with two orthogonal defect pores at the center (radii ), with the same computational cell as the inverse woodpile with the two defect pores. Figure 13 shows the reflectivity spectra for a thin film without and with two orthogonal defect pores. We observe Fabry-Pérot fringes below that are due to the interference of the light with the two interfaces of the thin film. The reflectivity spectrum for a thin film with two orthogonal defect pores reveals several peaks and troughs at discrete frequencies, e.g., a trough at and a peak at . We note that a trough always occurs near the maxima and a peak always near the minima of a Fabry-Pérot fringe. Increasing radii of these defect pores changes amplitudes of existing peaks and troughs and new ones appear as well. We interpret this behavior as the electromagnetic interference of reflectivity from the continuum contribution of the film and from the discrete contribution of the defect pores. This interference leads to sharp asymmetric peaks, commonly referred as Fano resonances in solid-state and atomic physics Fano1961PRB ; Lukyanchuk2010NatMater ; Fan2002PRB .
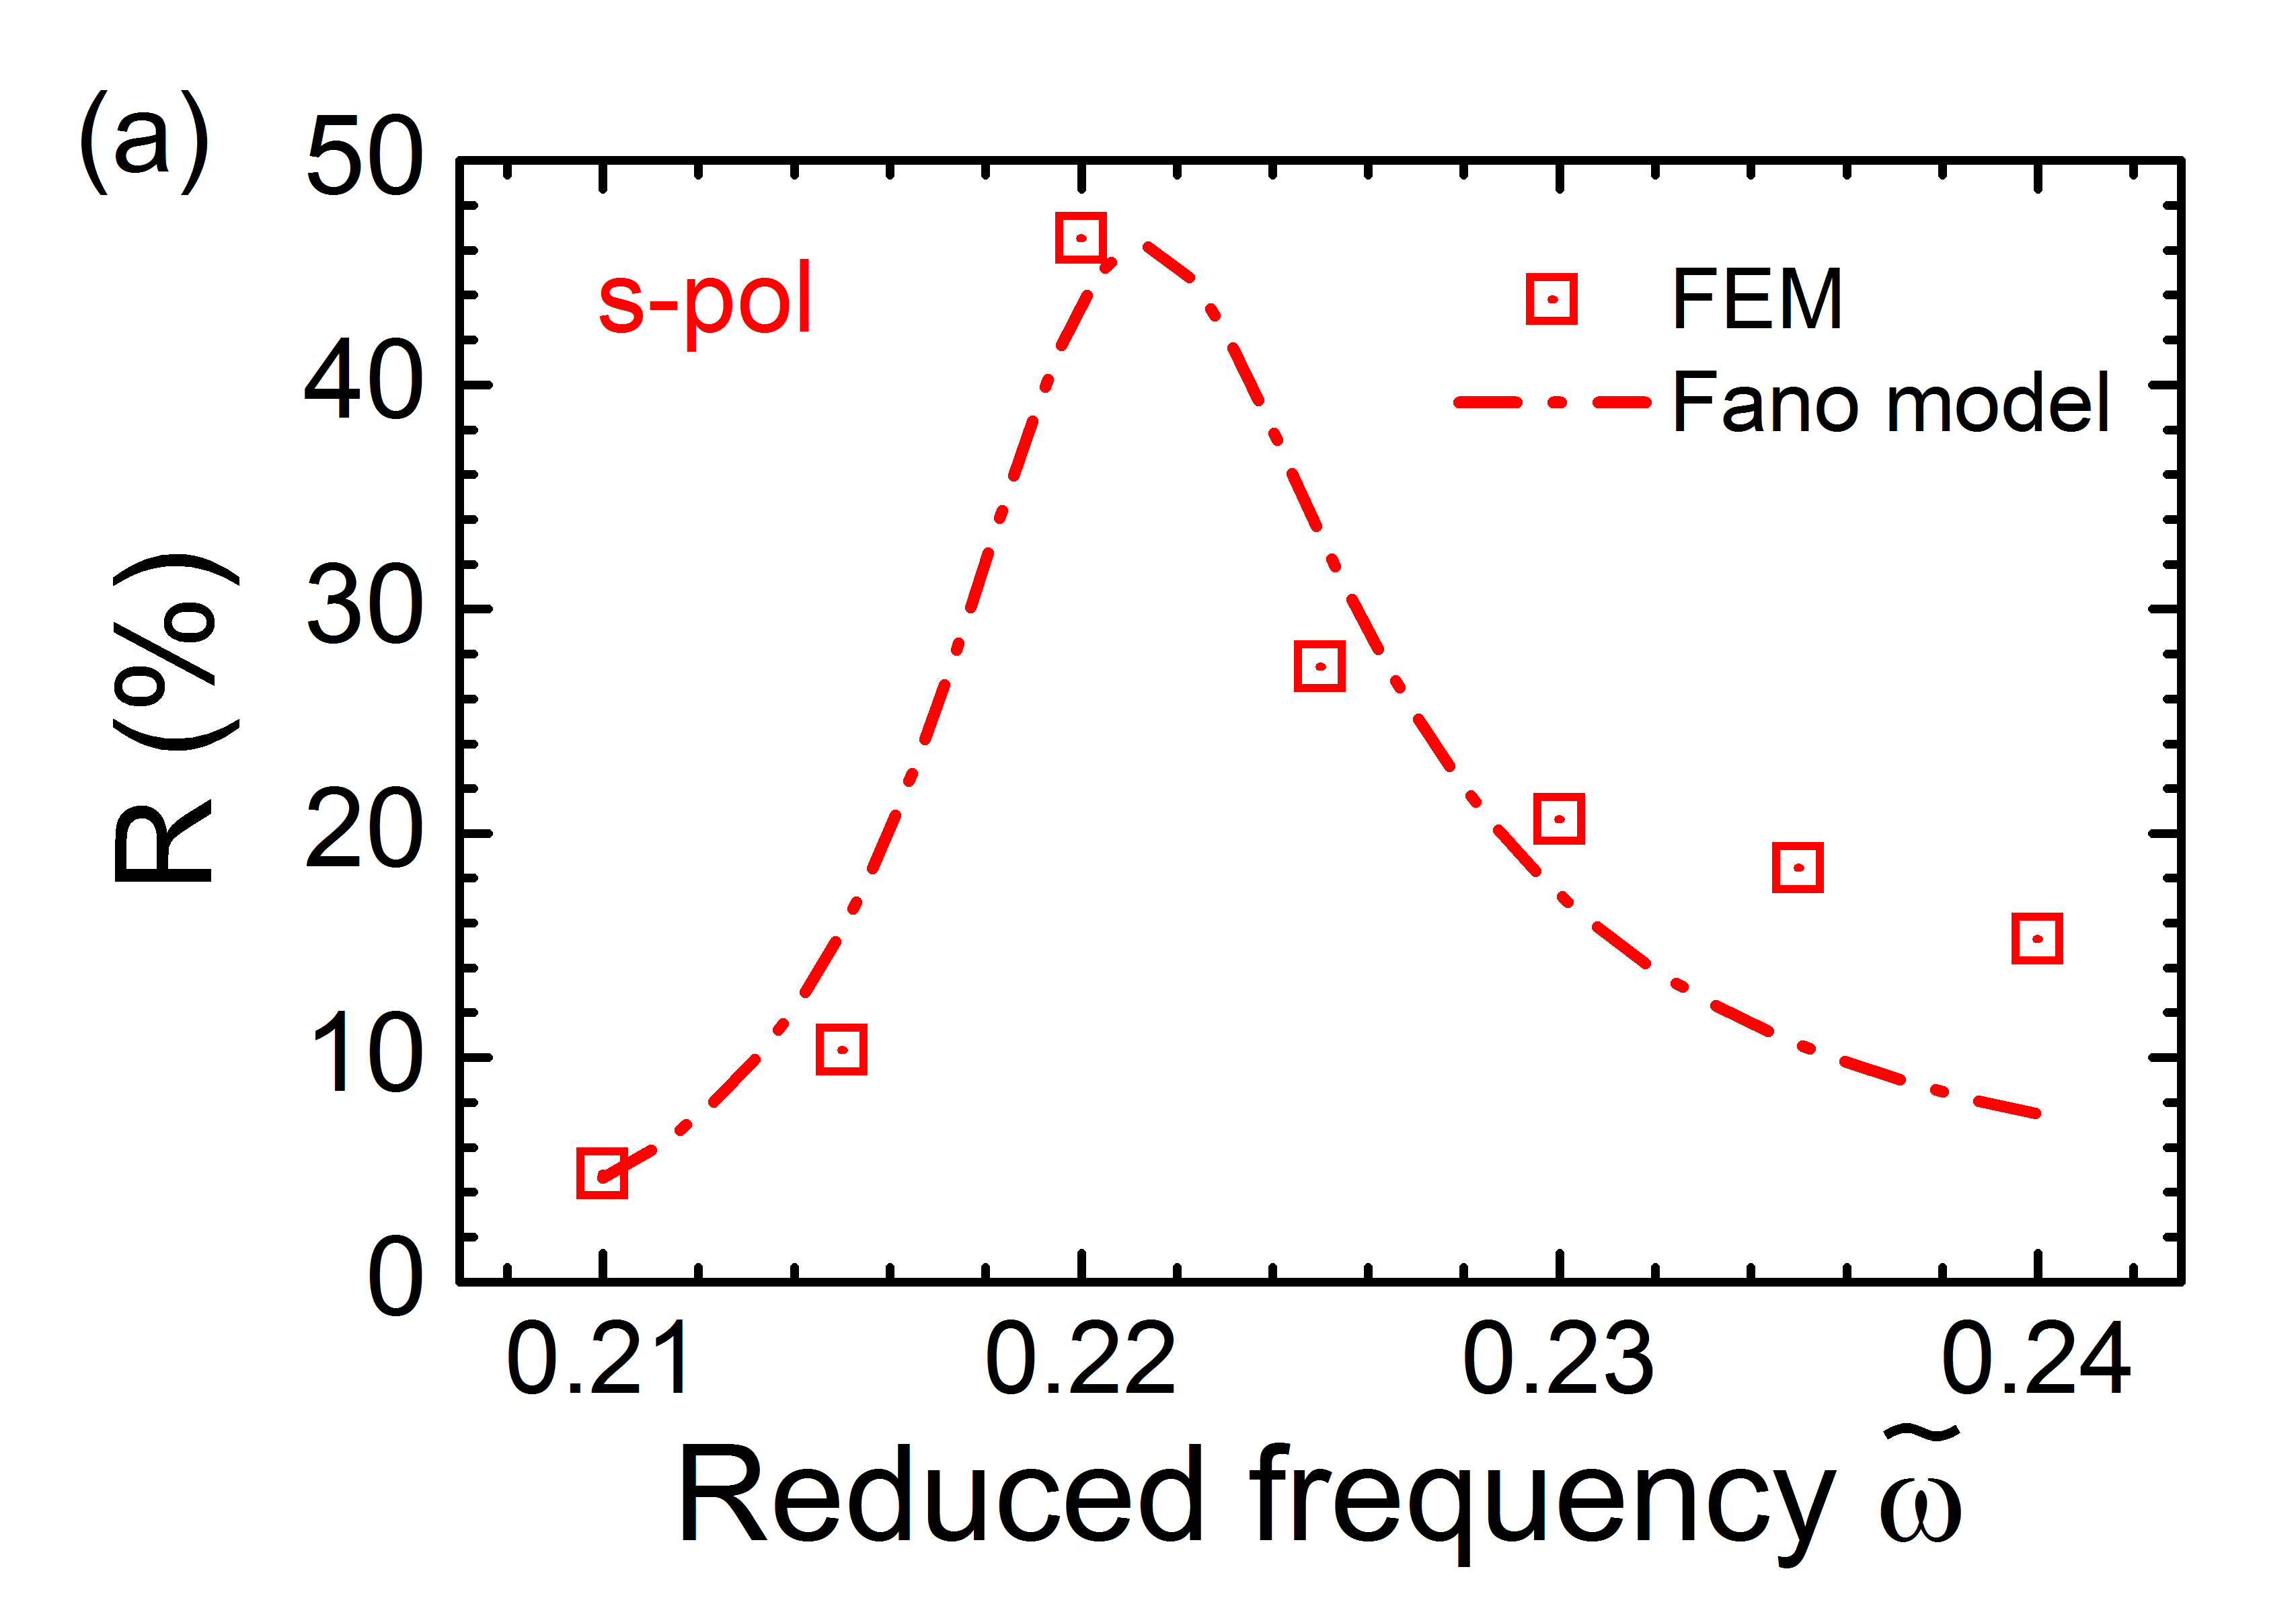
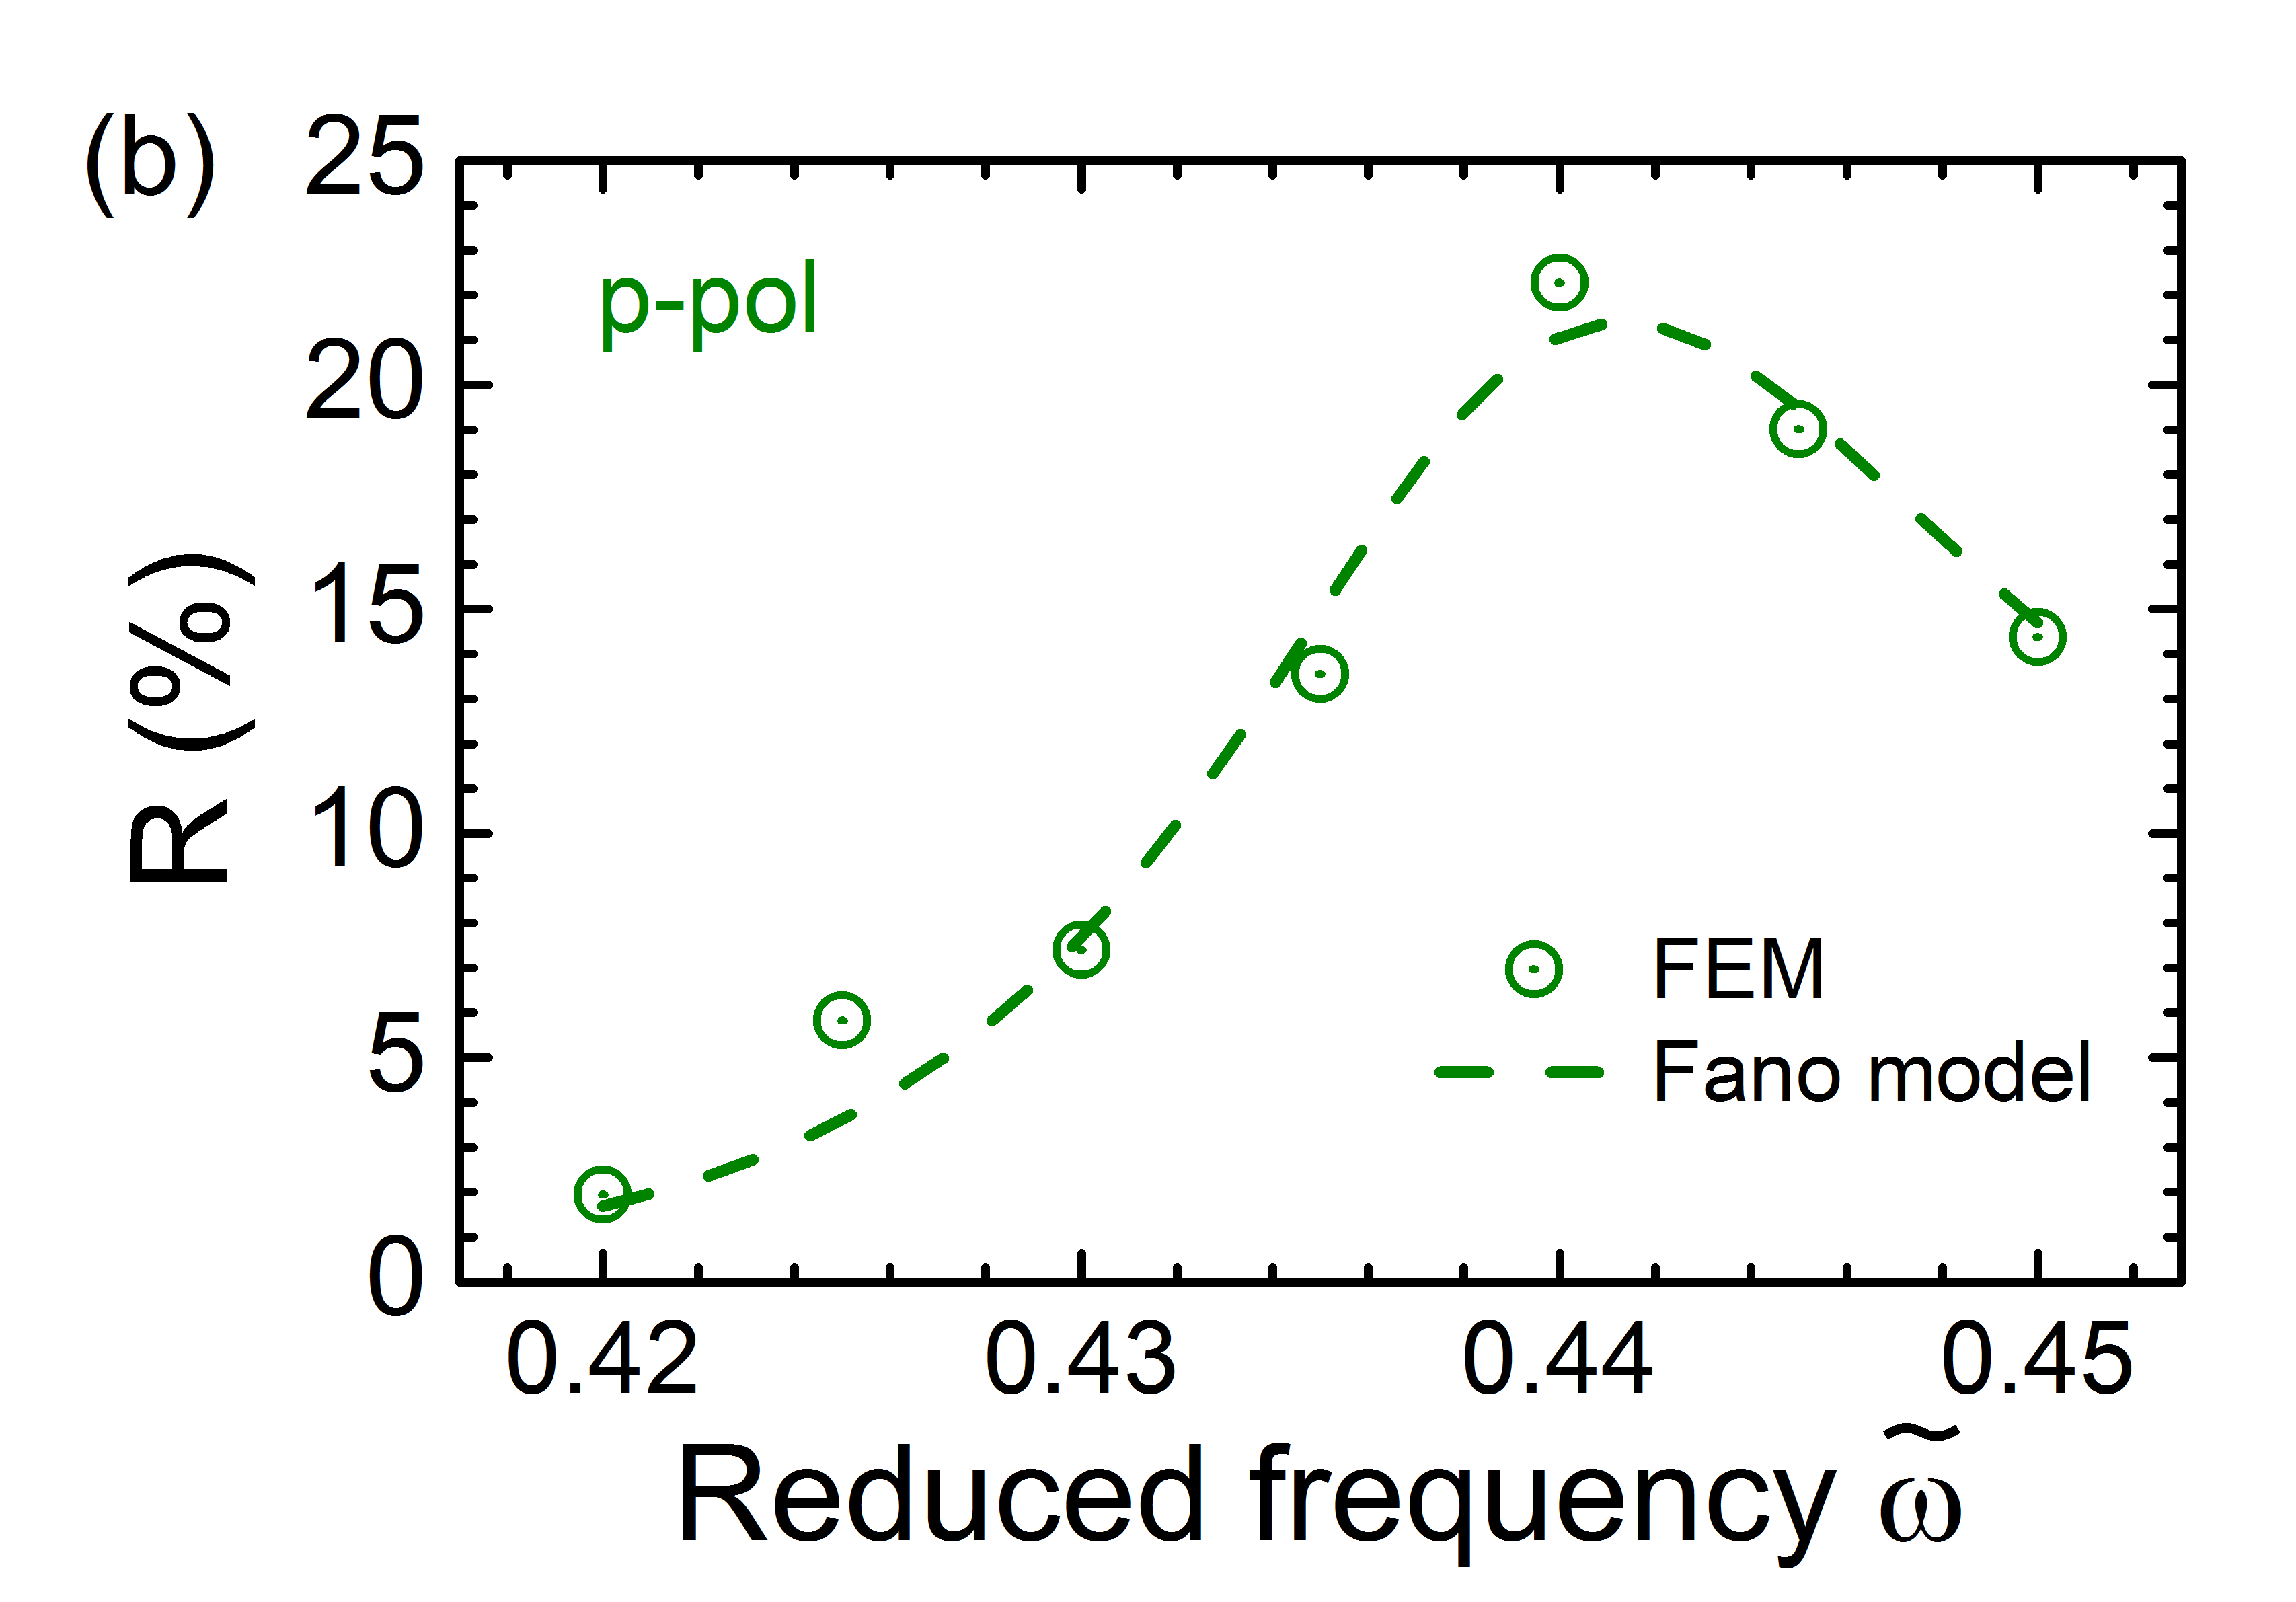
We now return to two orthogonal defect pores in an inverse woodpile. The incident plane wave is reflected from the photonic crystal for all frequencies and gets coupled to the resonant cavity only at discrete frequencies Fan2002PRB ; Vasco2013OptExpress . Therefore, the electromagnetic interference between the continuum contribution of the light reflected by the photonic crystal and the discrete contribution of the cavity resonance gives rise to a Fano resonance Fano1961PRB ; Vasco2013OptExpress , e.g., at in the -polarized spectrum in Fig. 14(a). To confirm the reasoning above, we modeled the reflectivity data with the functional form of the Fano resonance footnote:FanoFitting ; Fano1961PRB in Fig. 14(a,b). When the continuum contribution and the discrete contribution to the interference are comparable, the Fano resonance has a characteristic sharp asymmetrical shape, e.g., at for polarization in Fig. 14(a) and at for polarization in Fig. 14(b). Hence, these Fano resonances are angle-dependent and asymmetric in shape, unlike the cavity resonances that are angle-independent and have symmetric line shapes.
IV Discussion
IV.1 Quadrupolar symmetry
Since Ref. Woldering2014PRB did not provide a symmetry-assignment of the cavity resonances, we propose an assignment here based on three main arguments. Firstly, the consistent observation of five resonances by three independent studies (Refs. Woldering2014PRB ; Hack2018 and the present work) strongly suggests that a cavity in an inverse woodpile photonic band gap crystal has eigenstates with quadrupole symmetry, since a quadrupole in electrodynamics has five components Jackson1999Book . Conversely, a cavity in an inverse woodpile crystal is analogous to d-orbitals in atomic solid-state physics, since d-orbitals have states (, , , , ) Ashcroft1976Book .
Secondly, the degeneracy of two bands at the high-symmetry point in Fig. 4(a,b) agrees with the occurrence of two degenerate bands out of five 3d-orbital bands of transition metal nickel at the conventional cubic points, see Fig. 10.6(a) in Ref. Ashcroft1976Book . Simultaneously, the degeneracy of the S1 and P1 bands both at and at about 2/3 along in Fig. 4(a,b) agrees with the occurrence of a degeneracy of two bands in the nickel case both at and at 0.9 of the direction (see Fig. 10.6(c) in Ref. Ashcroft1976Book ), where the second point corresponds to 0.67 along in our tetragonal Brillouin zone footnote:CubicLattice .
Thirdly, Woldering et al. presented (but did not interpret) in their Fig. 5 a cross-section of the energy density distributions in the plane of the crossing defect pores for a single resonance, namely the 3rd one that corresponds to our P2 resonance. The cross-section reveals that sharp field maxima occur at sharp corners in the high-index dielectric material, with the same spatial distribution as the potential minima and maxima of an electric quadrupole Jackson1999Book . Since the field distribution pertains strictly to a single resonance, one can immediately exclude the naive suggestion whether the field maxima pertain to a double dipole state. Taking these arguments together, we conclude that the resonances of the inverse woodpile cavity have quadrupolar symmetry and are the optical analogues of d-orbitals in solid-state physics.
IV.2 Thickness-dependent quality factor
In a finite crystal, it is common that perfect symmetries that pertain to infinitely extended crystals are disrupted ChaikinBook . Indeed, we have seen in the cross-correlation analysis above (Fig. 3) that for several finite-crystal resonances, a non-zero amount of other states has been admixed, on account of the observation of secondary maxima in the cross-correlation plots, e.g., the P1 resonance containing admixtures of the P2 and P4 resonances.
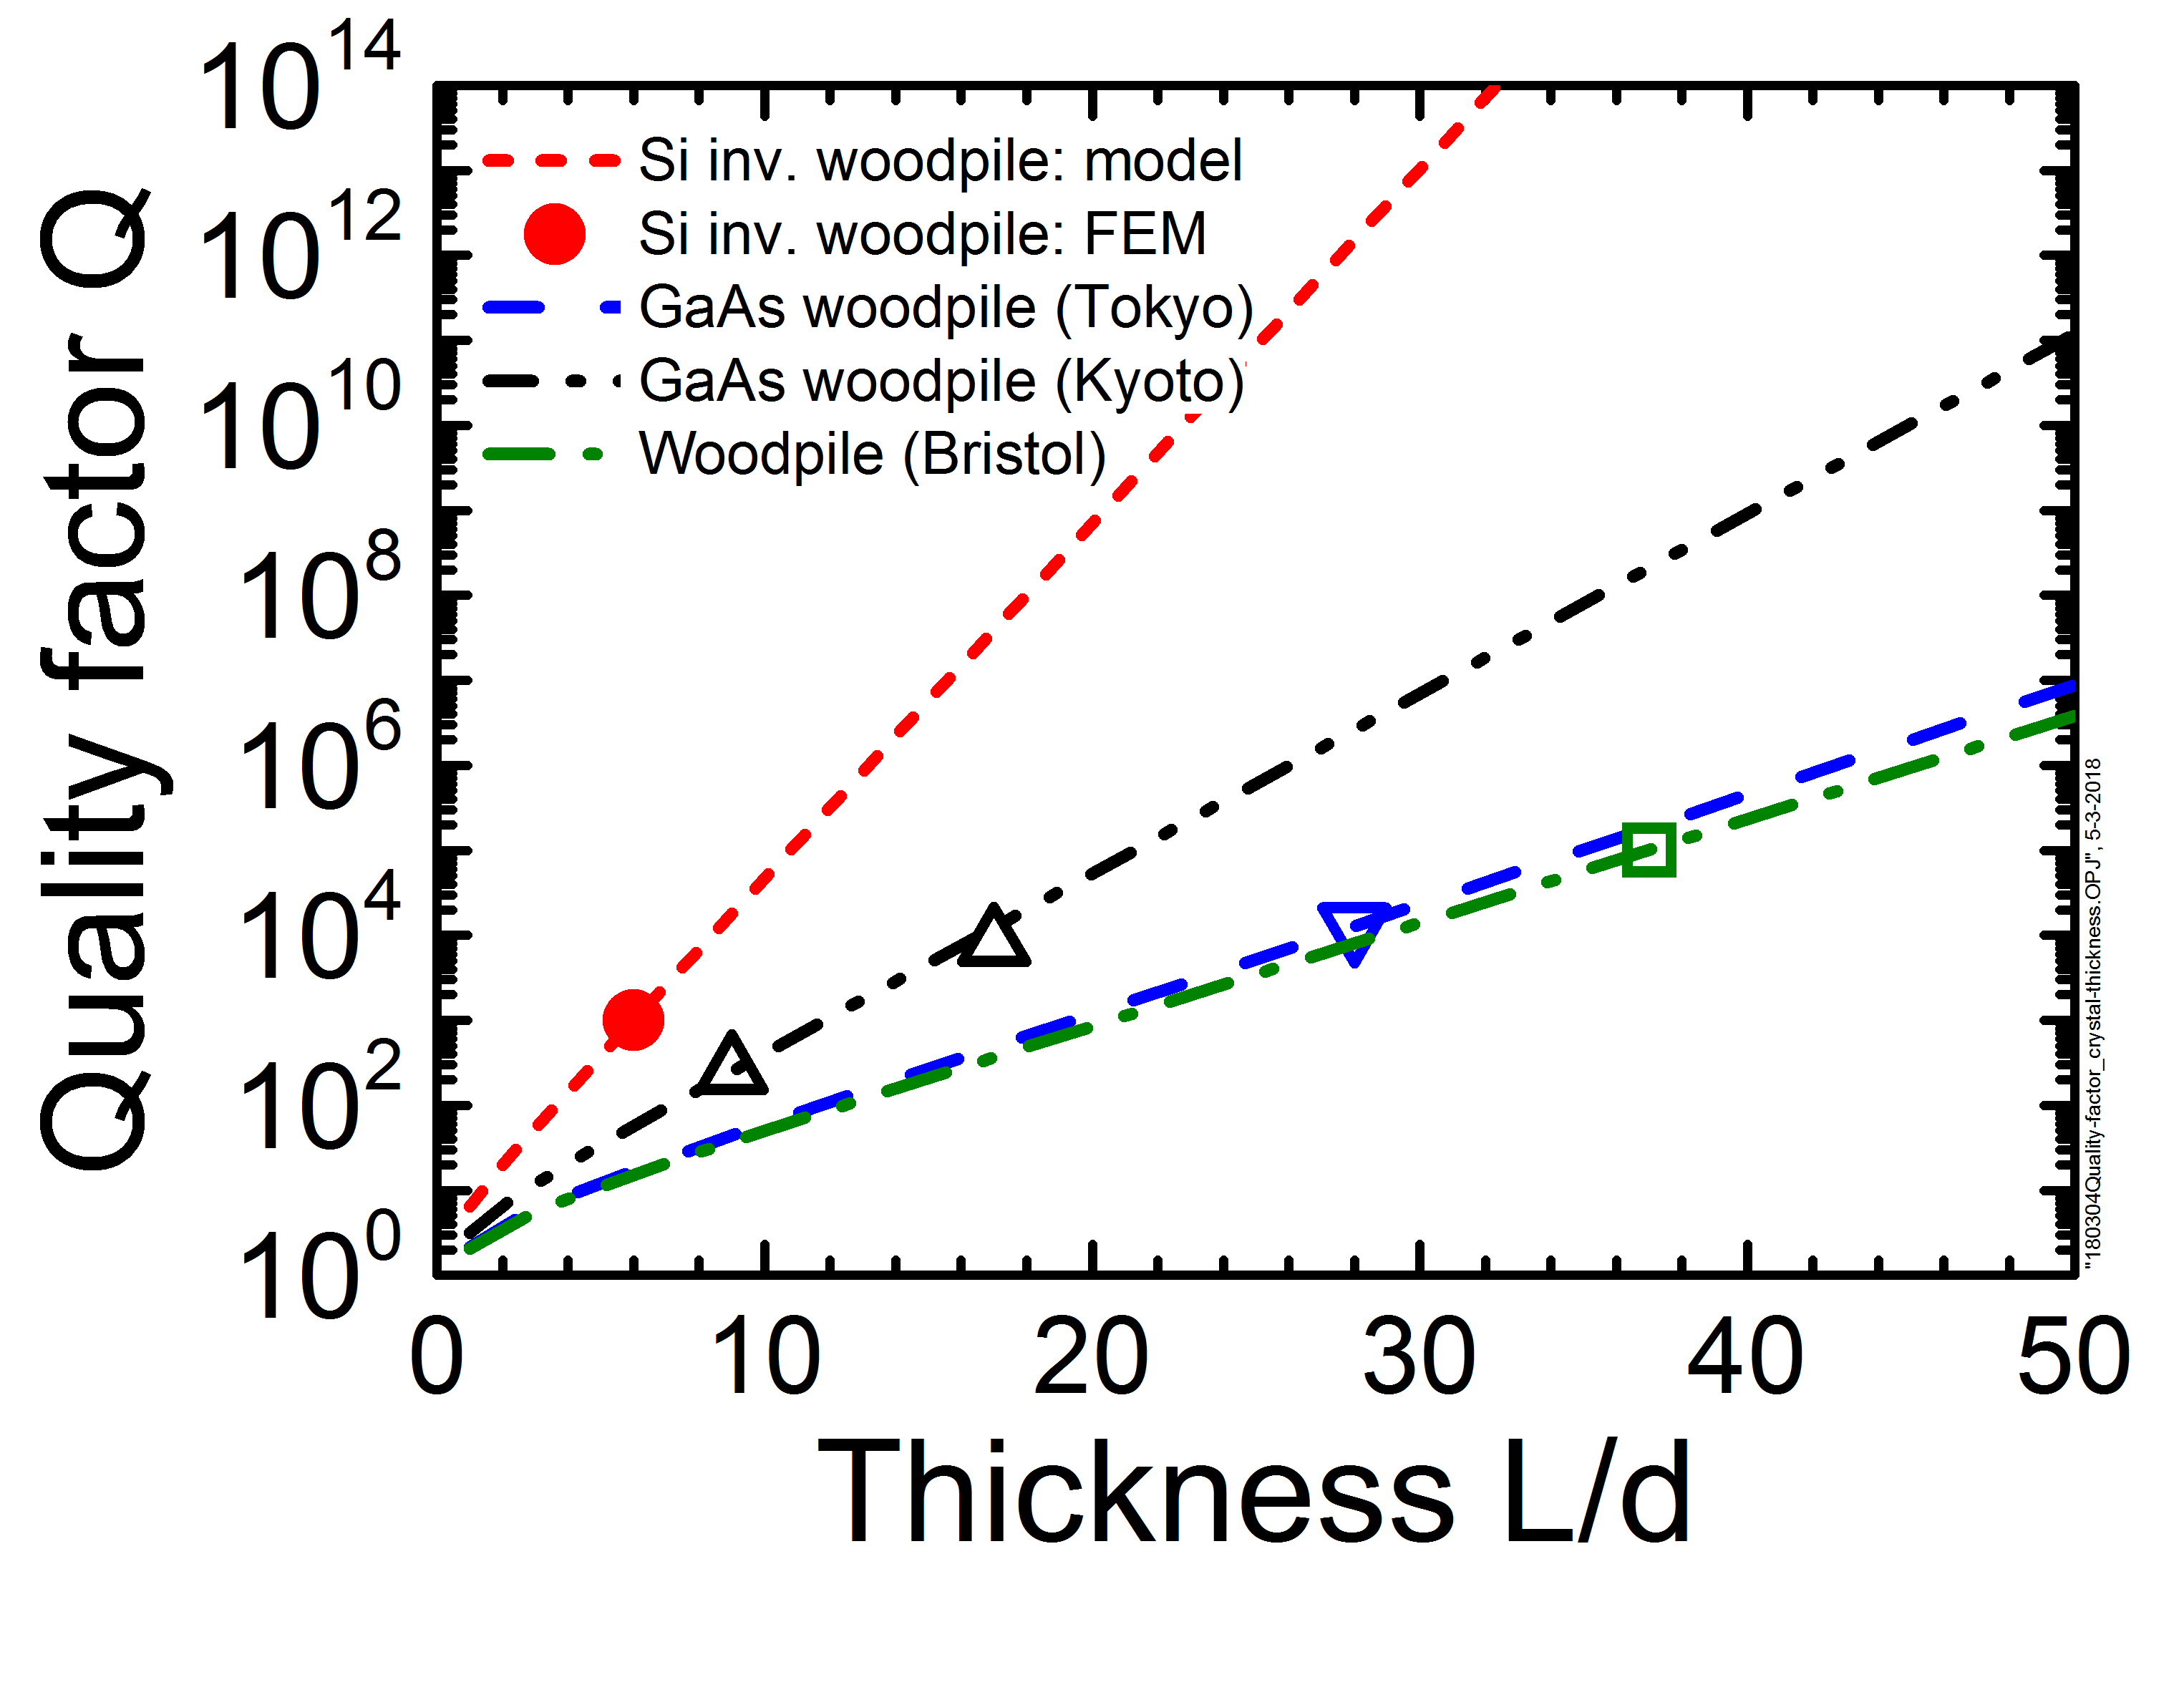
Let us put the quality factors above in context with other 3D photonic band cavities Ogawa2004Science ; Tajiri2015APL ; Taverne2015JOSAB . Since all results to date pertain to photonic band gap crystals with different thicknesses, different high-index backbones, and different crystal structures, we derive an analytic model. Therefore, we invoke a simplified one-dimensional (1D) model for a photonic band gap cavity, that corresponds to a microcavity consisting of two Bragg stacks surrounding a central defect layer (cf. Ref. Gerard2003TAP . For such a cavity, we derive (see Appendix D) that the quality factor increases exponentially with the thickness of the cavity structure
| (4) |
with the lattice spacing of the photonic crystal, and the band width and the central frequency of the stop band. In Fig. 15, we plot the available data for all photonic band gap cavities. We model each data set with Eq. (4) where the only adjustable parameter is the ratio that is taken to be equal to the photonic interaction strength of a photonic crystal Vos2015Book , and that is inversely proportional to the Bragg length that gauges the typical length scale for interference in a photonic stop gap.
Figure 15 shows that the computed quality factor of the best confined resonances (P1, P2, P3) of the Si inverse woodpile structure occurs for a thickness of lattice planes footnote:LatticePlane . If we model this data point with Eq. (4), we find , which is considerably larger than the relative width of the dominant or stop bands () and than the width of the stop band (). We surmise that the effective photonic strength is rather large, since the inverse woodpile structure has a topology and connectivity that are very amenable to photonic gap formation, see Ref. Economou1993PRB . Ogawa et al. report quality factors computed by FDTD simulations for cavities in GaAs woodpile crystals with two different thicknesses ( and ) Ogawa2004Science . These results are described by Eq. (4) with , which matches well with the stop band widths in band structures. Tajiri et al. report an experimentally measured for a GaAs woodpile crystal with a thickness . This results is described by Eq. (4) with , in reasonable agreement with the stop band widths in the band structures. Since in general computed quality factors are greater than measured ones (see, e.g., Ref Ogawa2004Science ), the photonic strength derived from computed results on the perfect structure is expected to also be much greater. Taverne et al. report the quality factor in a woodpile structure from FDTD simulations, and obtain for layers Taverne2015JOSAB . Interpreting this result with Eq. (4) yields , in agreement with the stop band widths in the band structures.
V Conclusion
We have numerically studied the reflectivity and the absorption of a resonant cavity in a three-dimensional photonic crystal with finite support. We employed the finite element method to study crystals with the cubic diamond-like inverse woodpile structure with a high-index backbone having a dielectric function similar to silicon. The point defect functioning as a cavity is formed in the proximal region of two orthogonal pores with a radius that differs from all others in the bulk of the crystal. By comparing defect bands in the band structure for an infinite crystal with resonances in the reflectivity spectra for a finite crystal, we identify cavity resonances and their field patterns. Out of five observed cavity resonances, one is -polarized and four are -polarized. These cavity resonances are angle-independent, indicating a strong confinement of light in the crystal slab. The P1, P2, and P4 resonances reveal normal behavior with single cross-correlation peaks (between field distributions) and single reflectivity resonances. The P3 and S1 resonances in finite crystals reveal an intriguing splitting into 2 sub-resonances. We find large energy enhancement at cavity resonances, i.e., up to times the incident energy and up to times the energy at a lower frequency. Our results indicate that 3D photonic band gap crystals with resonant cavities are potential candidates for the absorbing medium of a solar cell in order to enhance the photovoltaic efficiency and reduce the weight of the absorbing component by nearly . Fano resonances are observed below the band gap due to the electromagnetic interference between the discrete contribution of the fundamental cavity mode and the continuum contribution of the light scattered by the photonic crystal. Our study indicates that the five eigenstates of our 3D photonic band gap cavity have quadrupolar symmetry, in analogy to d-like orbitals in solid-state physics. We conclude that inverse woodpile cavities have intriguing potential to applications in optical sensing and photovoltaics.
VI Acknowledgments
It is a pleasure to thank Bart van Tiggelen (CNRS, Grenoble), Jean-Michel Gérard (CEA, Grenoble), Sjoerd Hack, Ad Lagendijk, Allard Mosk (Utrecht), Pepijn Pinkse, Ravitej Uppu, and Satoshi Iwamoto, Takeyoshi Tajiri (Tokyo) and Shun Takahashi (Kyoto) for stimulating discussions, and Manashee Adhikary for help. This research is supported by the Shell-NWO/FOM programme “Computational Sciences for Energy Research” (CSER), by the FOM/NWO programme “Stirring of light!,” the STW/NWO-Perspectief program “Free-form scattering optics”, the “Descartes-Huygens” prize of the French Academy of Sciences, and the MESA+ Institute for Nanotechnology section Applied Nanophotonics (ANP).
Appendix A Comparison of the numerical solvers
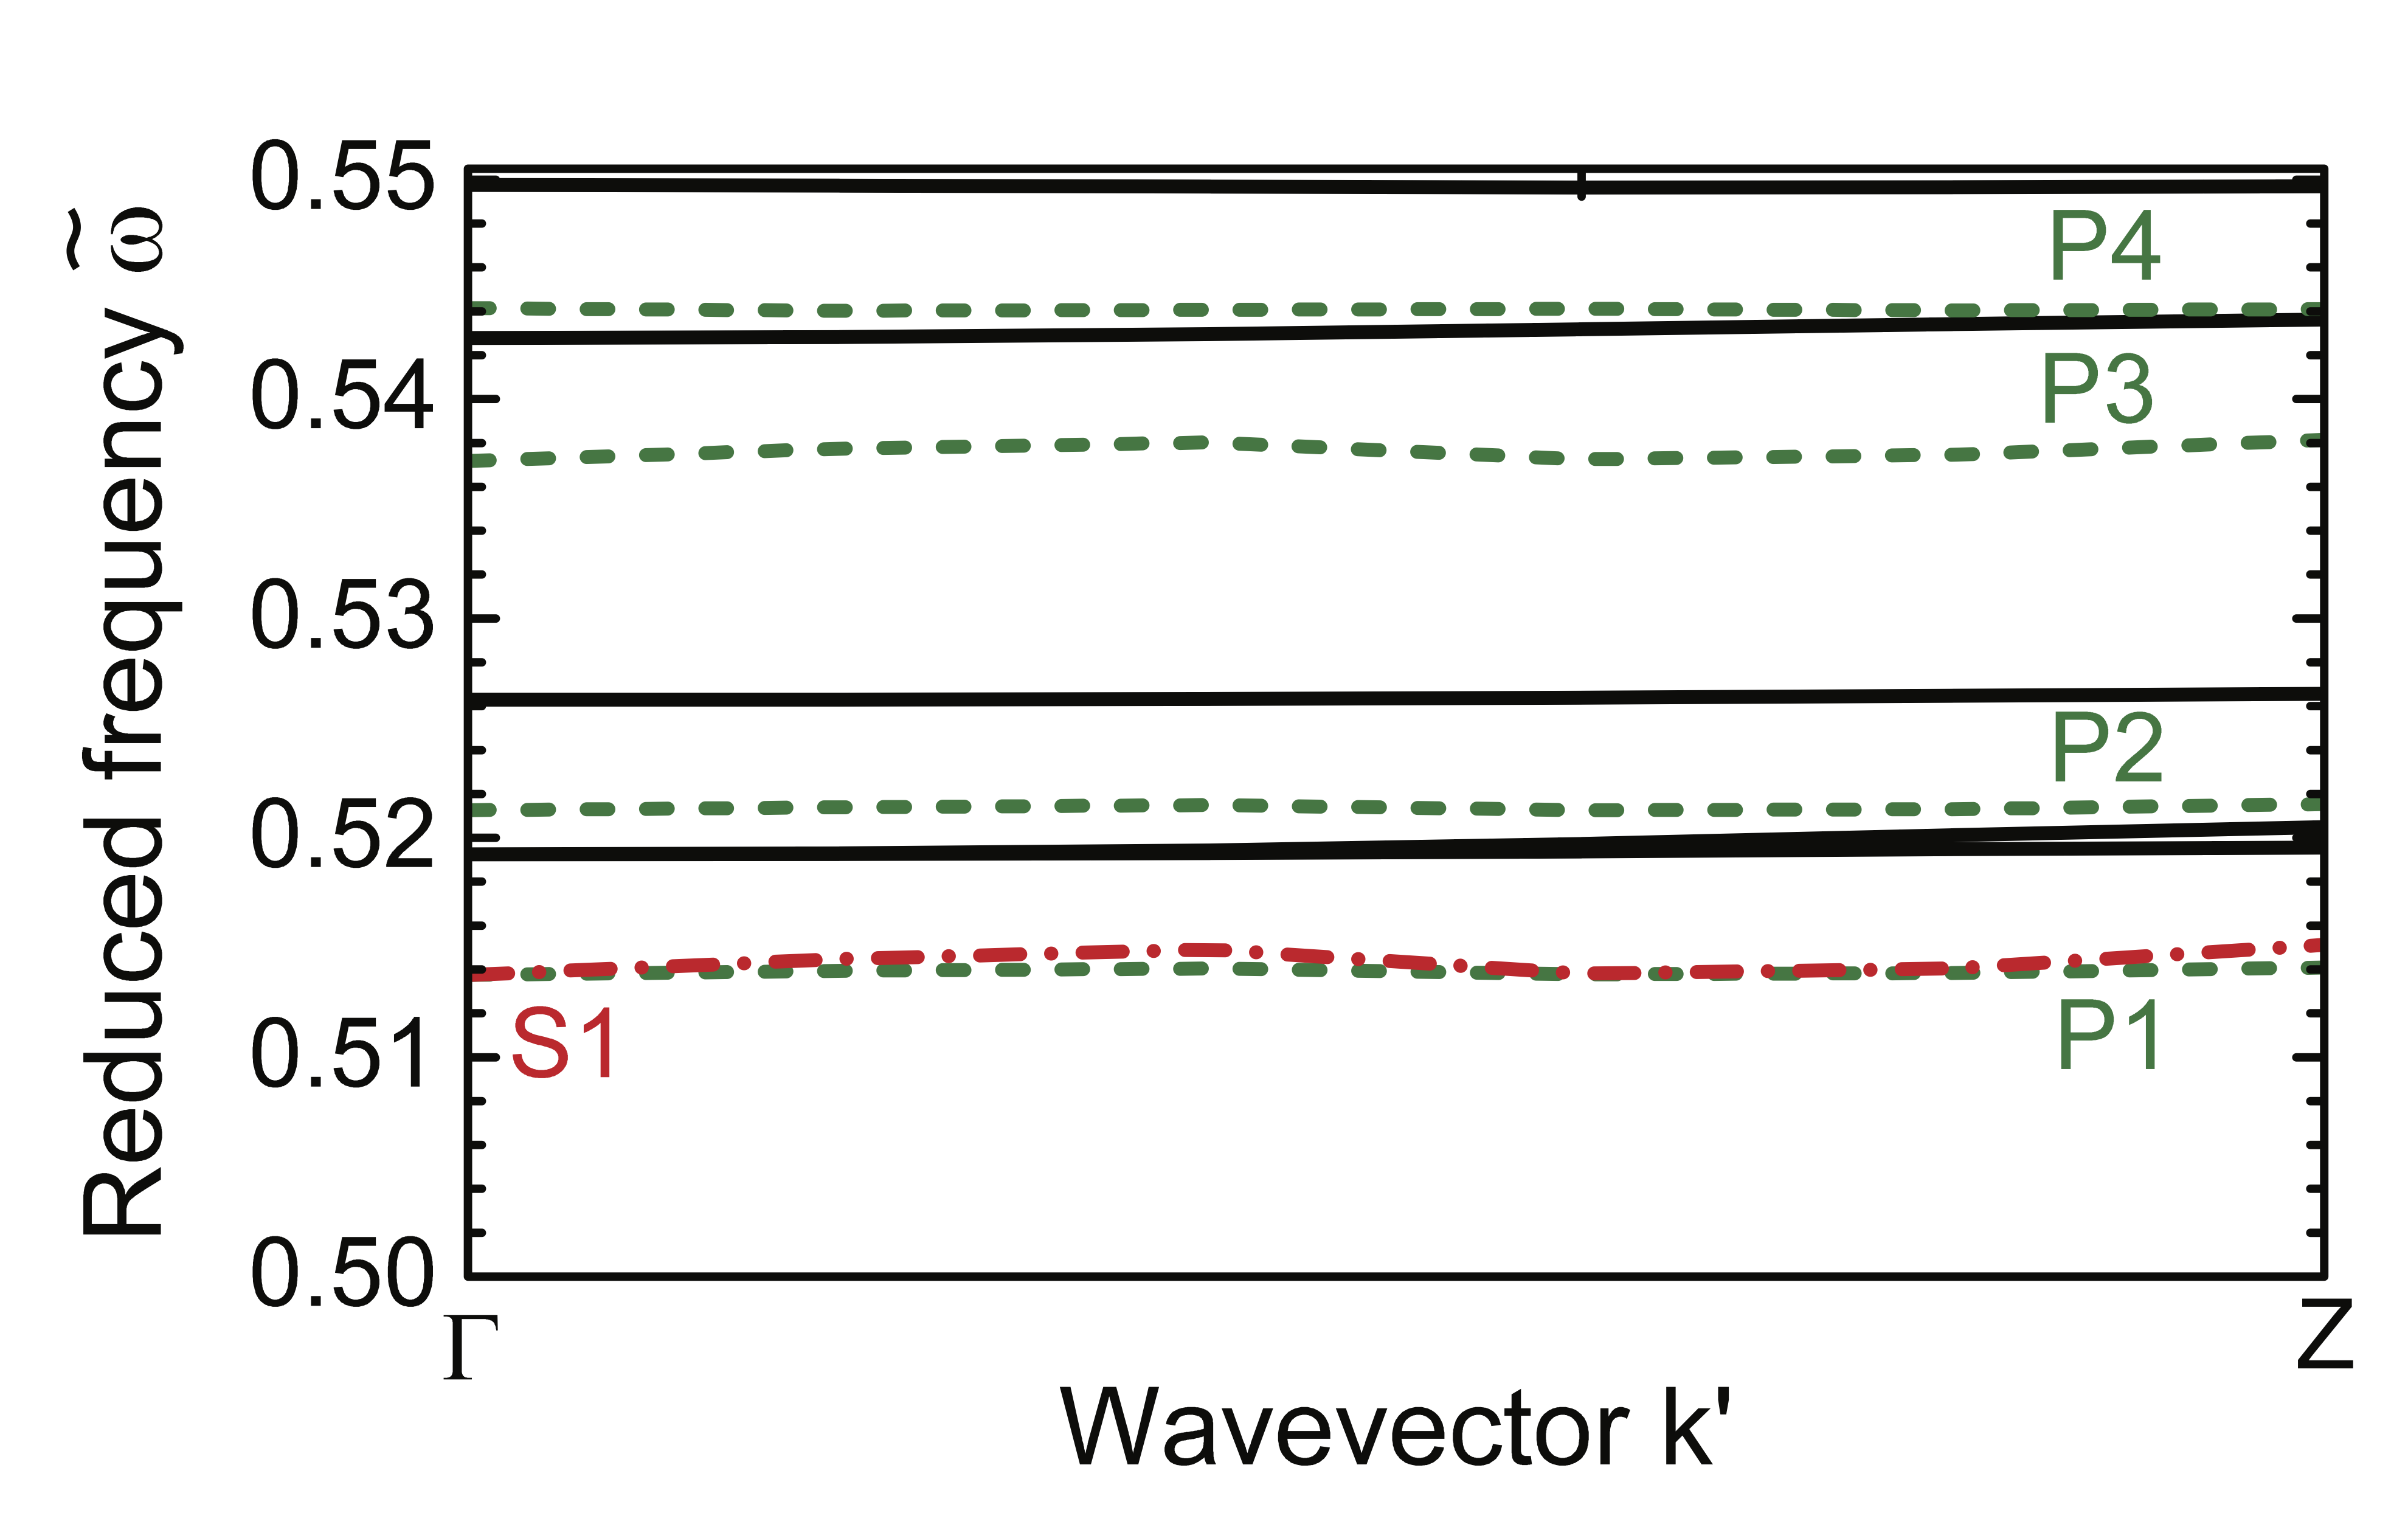
To compute the photonic band structure for the supercell of a 3D inverse woodpile photonic crystal with a point defect, Ref. Woldering2014PRB employs a plane-wave expansion (PWE) method eigenvalue solver, whereas we employ the COMSOL finite-element method (FEM) COMSOLMultiphysics eigenvalue solver Johnson2001OptExpress . We compute the polarization-resolved (both and ) band structures. Figure 16 shows the bands between and obtained using both the FEM solver and the PWE method. We observe that there are five isolated and nearly dispersionless bands obtained using both methods. Out of these five bands, the FEM solver gives one -polarized band, namely S1, and four -polarized bands, namely P1, P2, P3, and P4. We note that all bands obtained using the FEM occur at lower frequencies compared to the corresponding bands obtained using the PWE method.
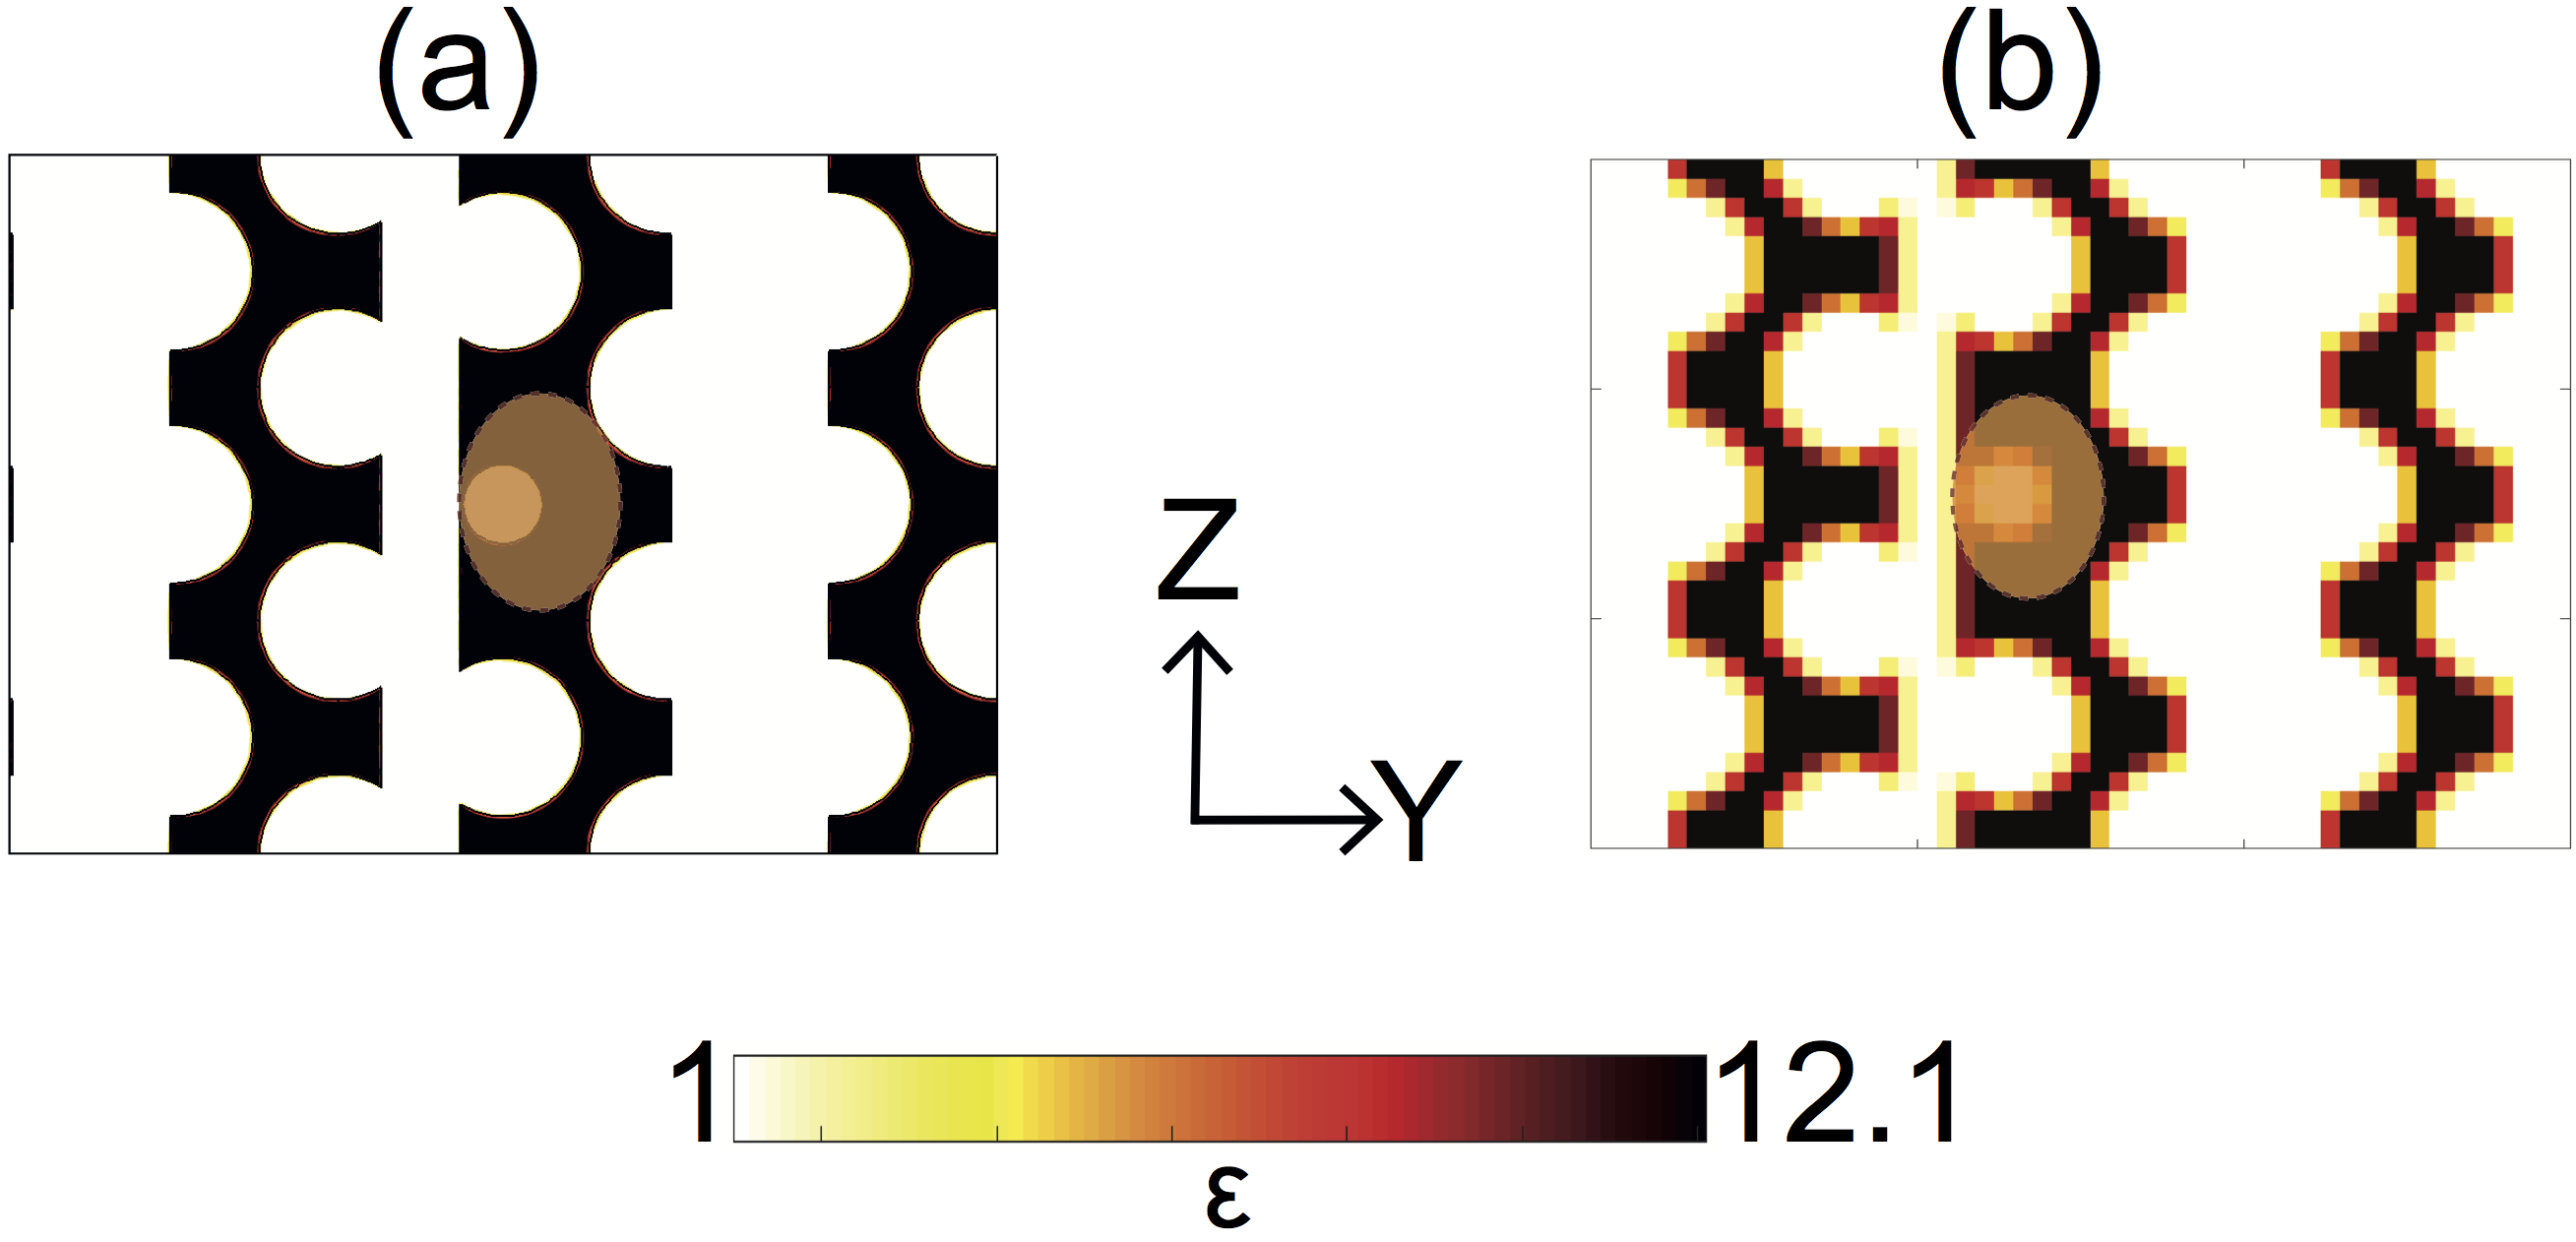
In order to characterize this frequency shift between the FEM and the PWE results, we compare cross sections of the dielectric-permittivity distribution of the supercell structure obtained from both methods in Fig. 17. We take the cross section through the center of the cavity and parallel to the plane. We observe that the curved boundaries between the air and the high-index backbone material are smoother in Fig. 17 (a) compared to Fig. 17 (b). This difference is more pronounced for the sharp interface surrounding the point defect. Compared to the PWE solver, we use a smaller element size in the FEM solver to subdivide the computational domain and hence the sharp interfaces and the curved boundaries are better approximated. Ref. Woldering2014PRB also reports in Appendix A that the resonance bands shift to lower frequencies with a higher spatial resolution. Therefore, we conclude that the frequency shift between the bands obtained using the two numerical methods is due to the differences in the spatial resolution, resulting into different dielectric-permittivity distributions.
The computational time using the FEM solver is longer than the PWE method. In order to minimize the computational time, we subdivide the frequency regime into two ranges: below the 3D band gap and the 3D band gap. Since there are no isolated resonance bands below the 3D band gap, we do not need the calculation to have the FEM spatial resolution. Hence, we employ the faster option of the PWE method to calculate the photonic band structure below the band gap. However, we employ a spatial resolution of , which is a times greater 3D spatial resolution than in Ref. Woldering2014PRB . Since we explicitly aim at identifying isolated cavity resonances, we compute the photonic band structure inside the 3D band gap using the FEM solver, which is the same numerical method used for the reflectivity calculations.
Appendix B Mesh convergence
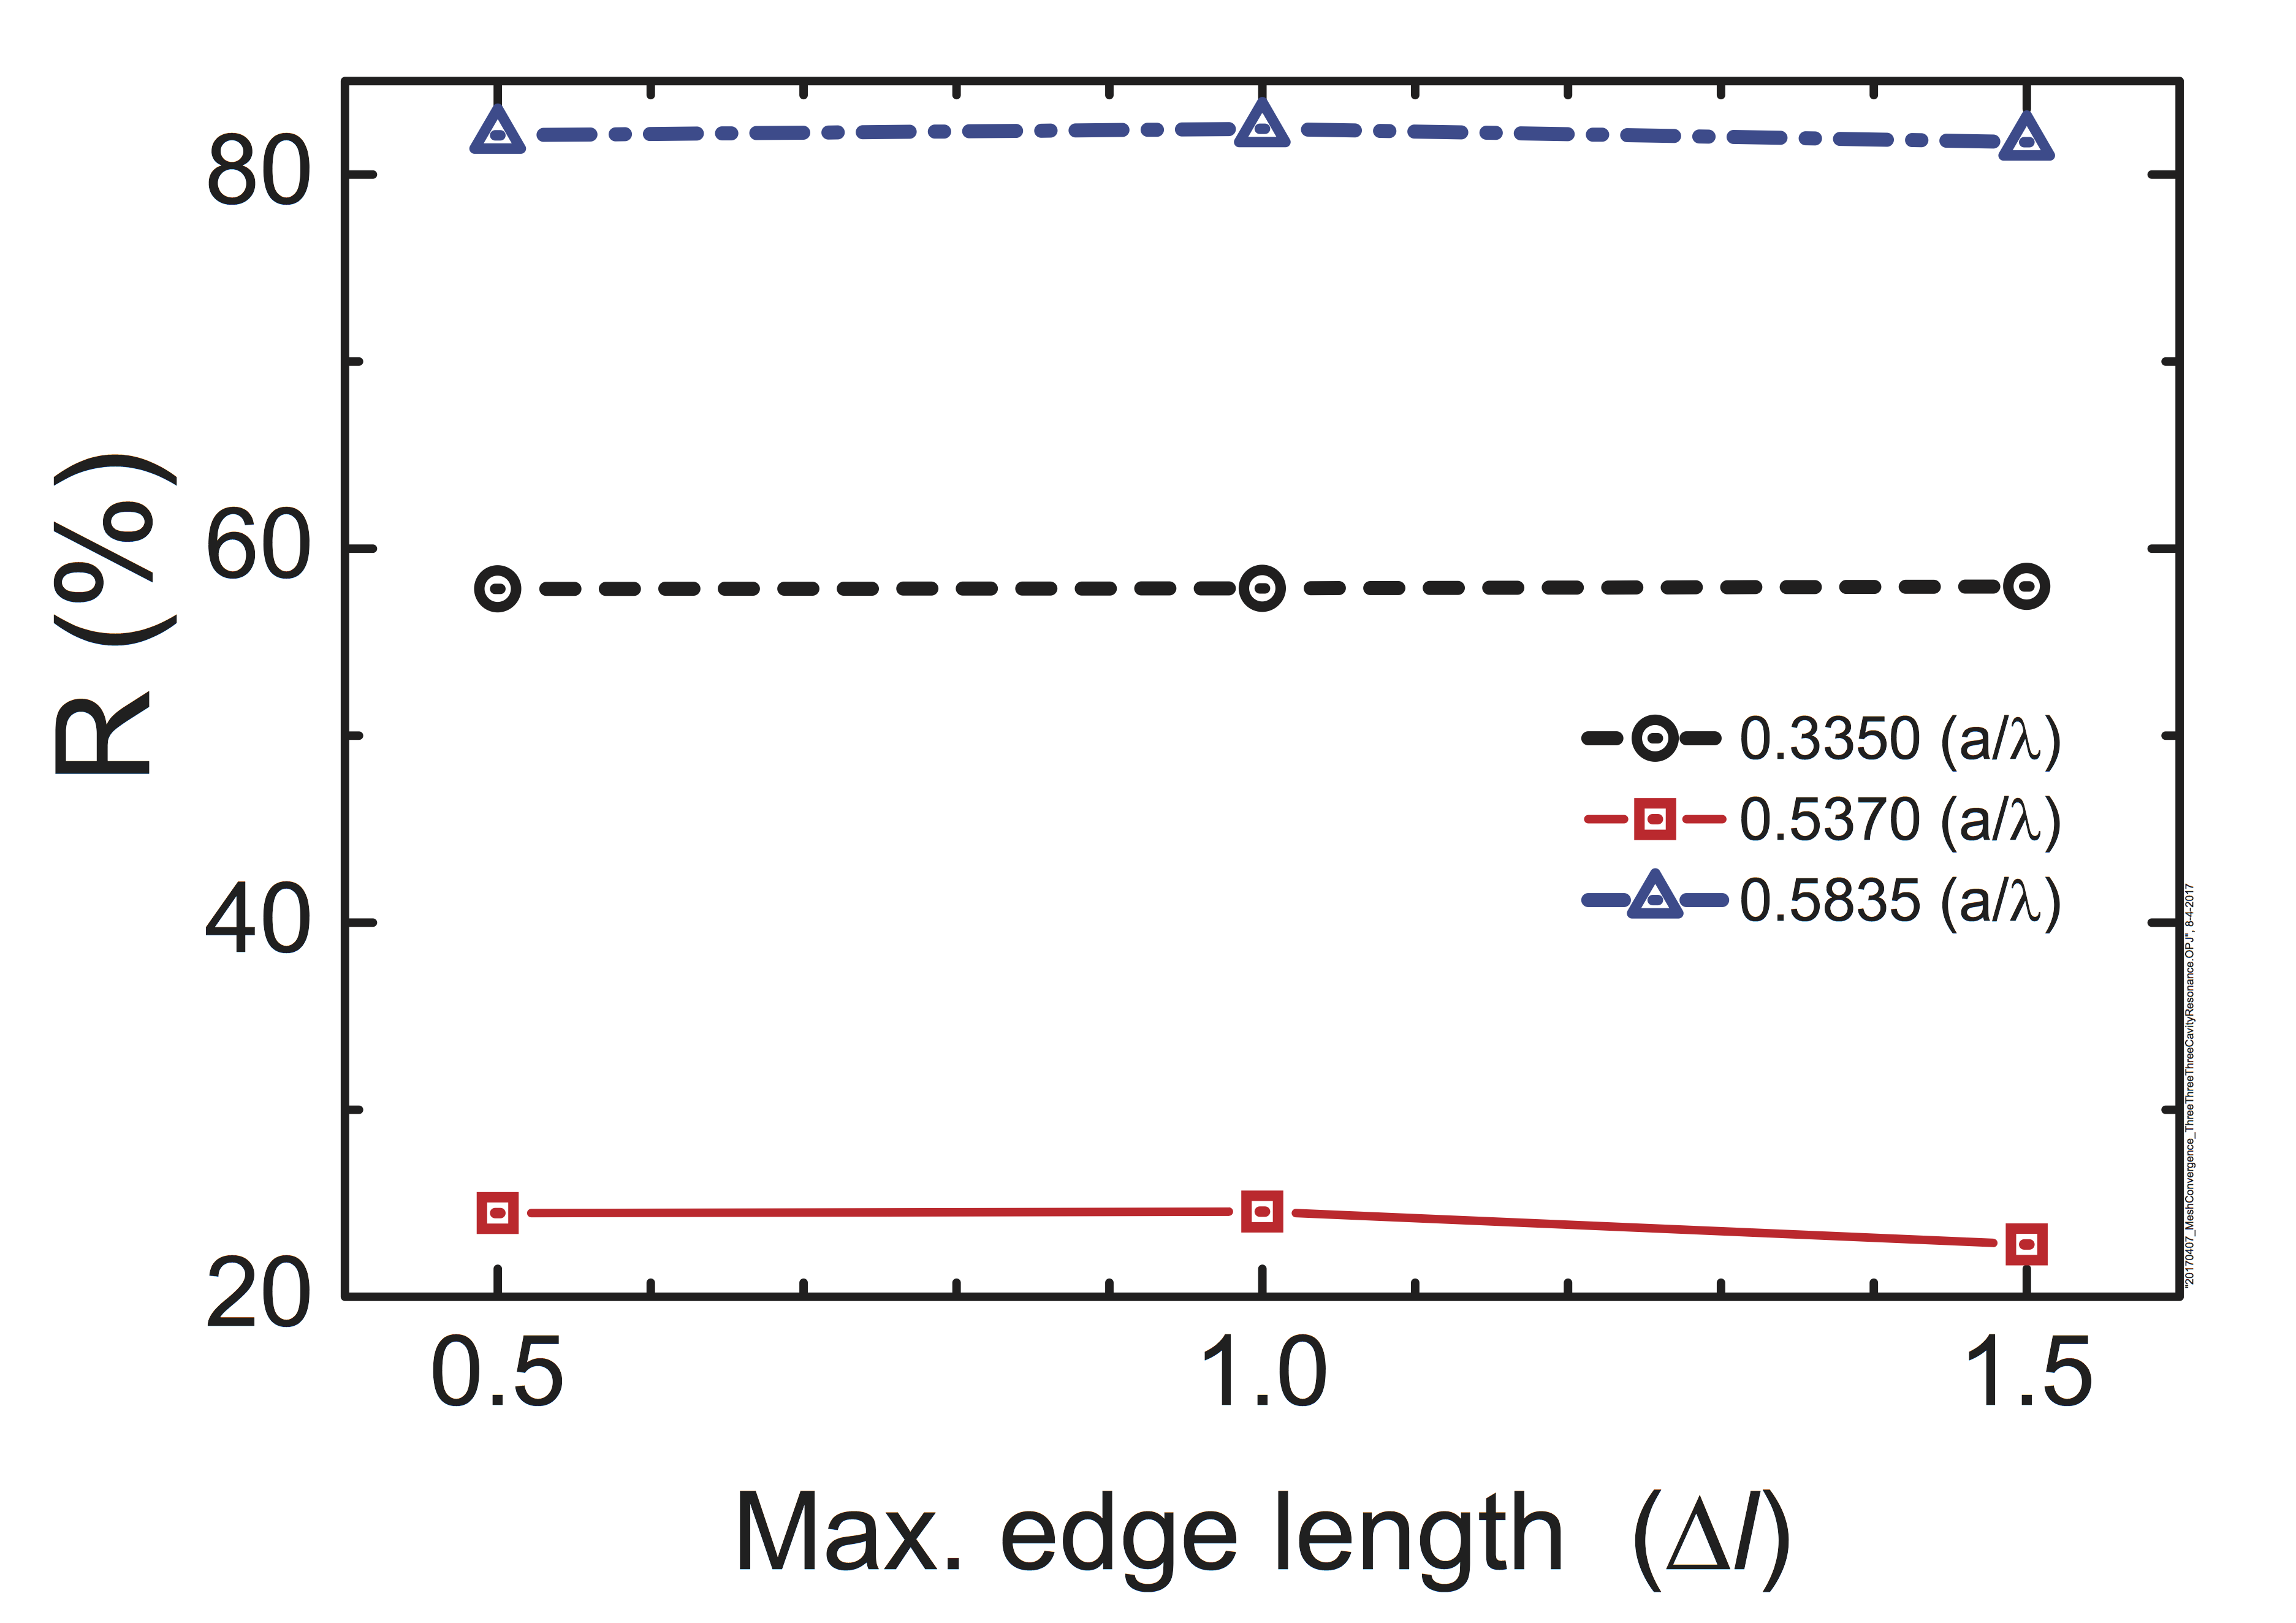
In this study, we use tetrahedra to subdivide the 3D computational domain in the finite element method. To determine the edge length of the tetrahedra to completely mesh the complex geometry, we investigate the mesh convergence of the reflectivity results. We perform reflectivity calculations using upper limits of , , and to the edge length on any tetrahedra, with the shortest wavelength of the incident plane waves in vacuum. Figure 18 shows the reflectivity at frequencies below, inside, and near the upper edge of the 3D band gap. These reflectivity values change less than with the maximum edge length. From the nearly constant results of these three mesh resolutions, we conclude the quantitative convergence of our calculated reflectivity spectra. These three mesh resolutions take 4300 s, 5330 s, and 11020 s computation time on the Serendipity cluster Serendipity . Therefore, to keep the computational time for many frequencies tractable while maintaining the quantitative convergence of the results, we set an upper limit of to the edge length of any tetrahedra used in the finite-element mesh.
Appendix C Frequency convergence
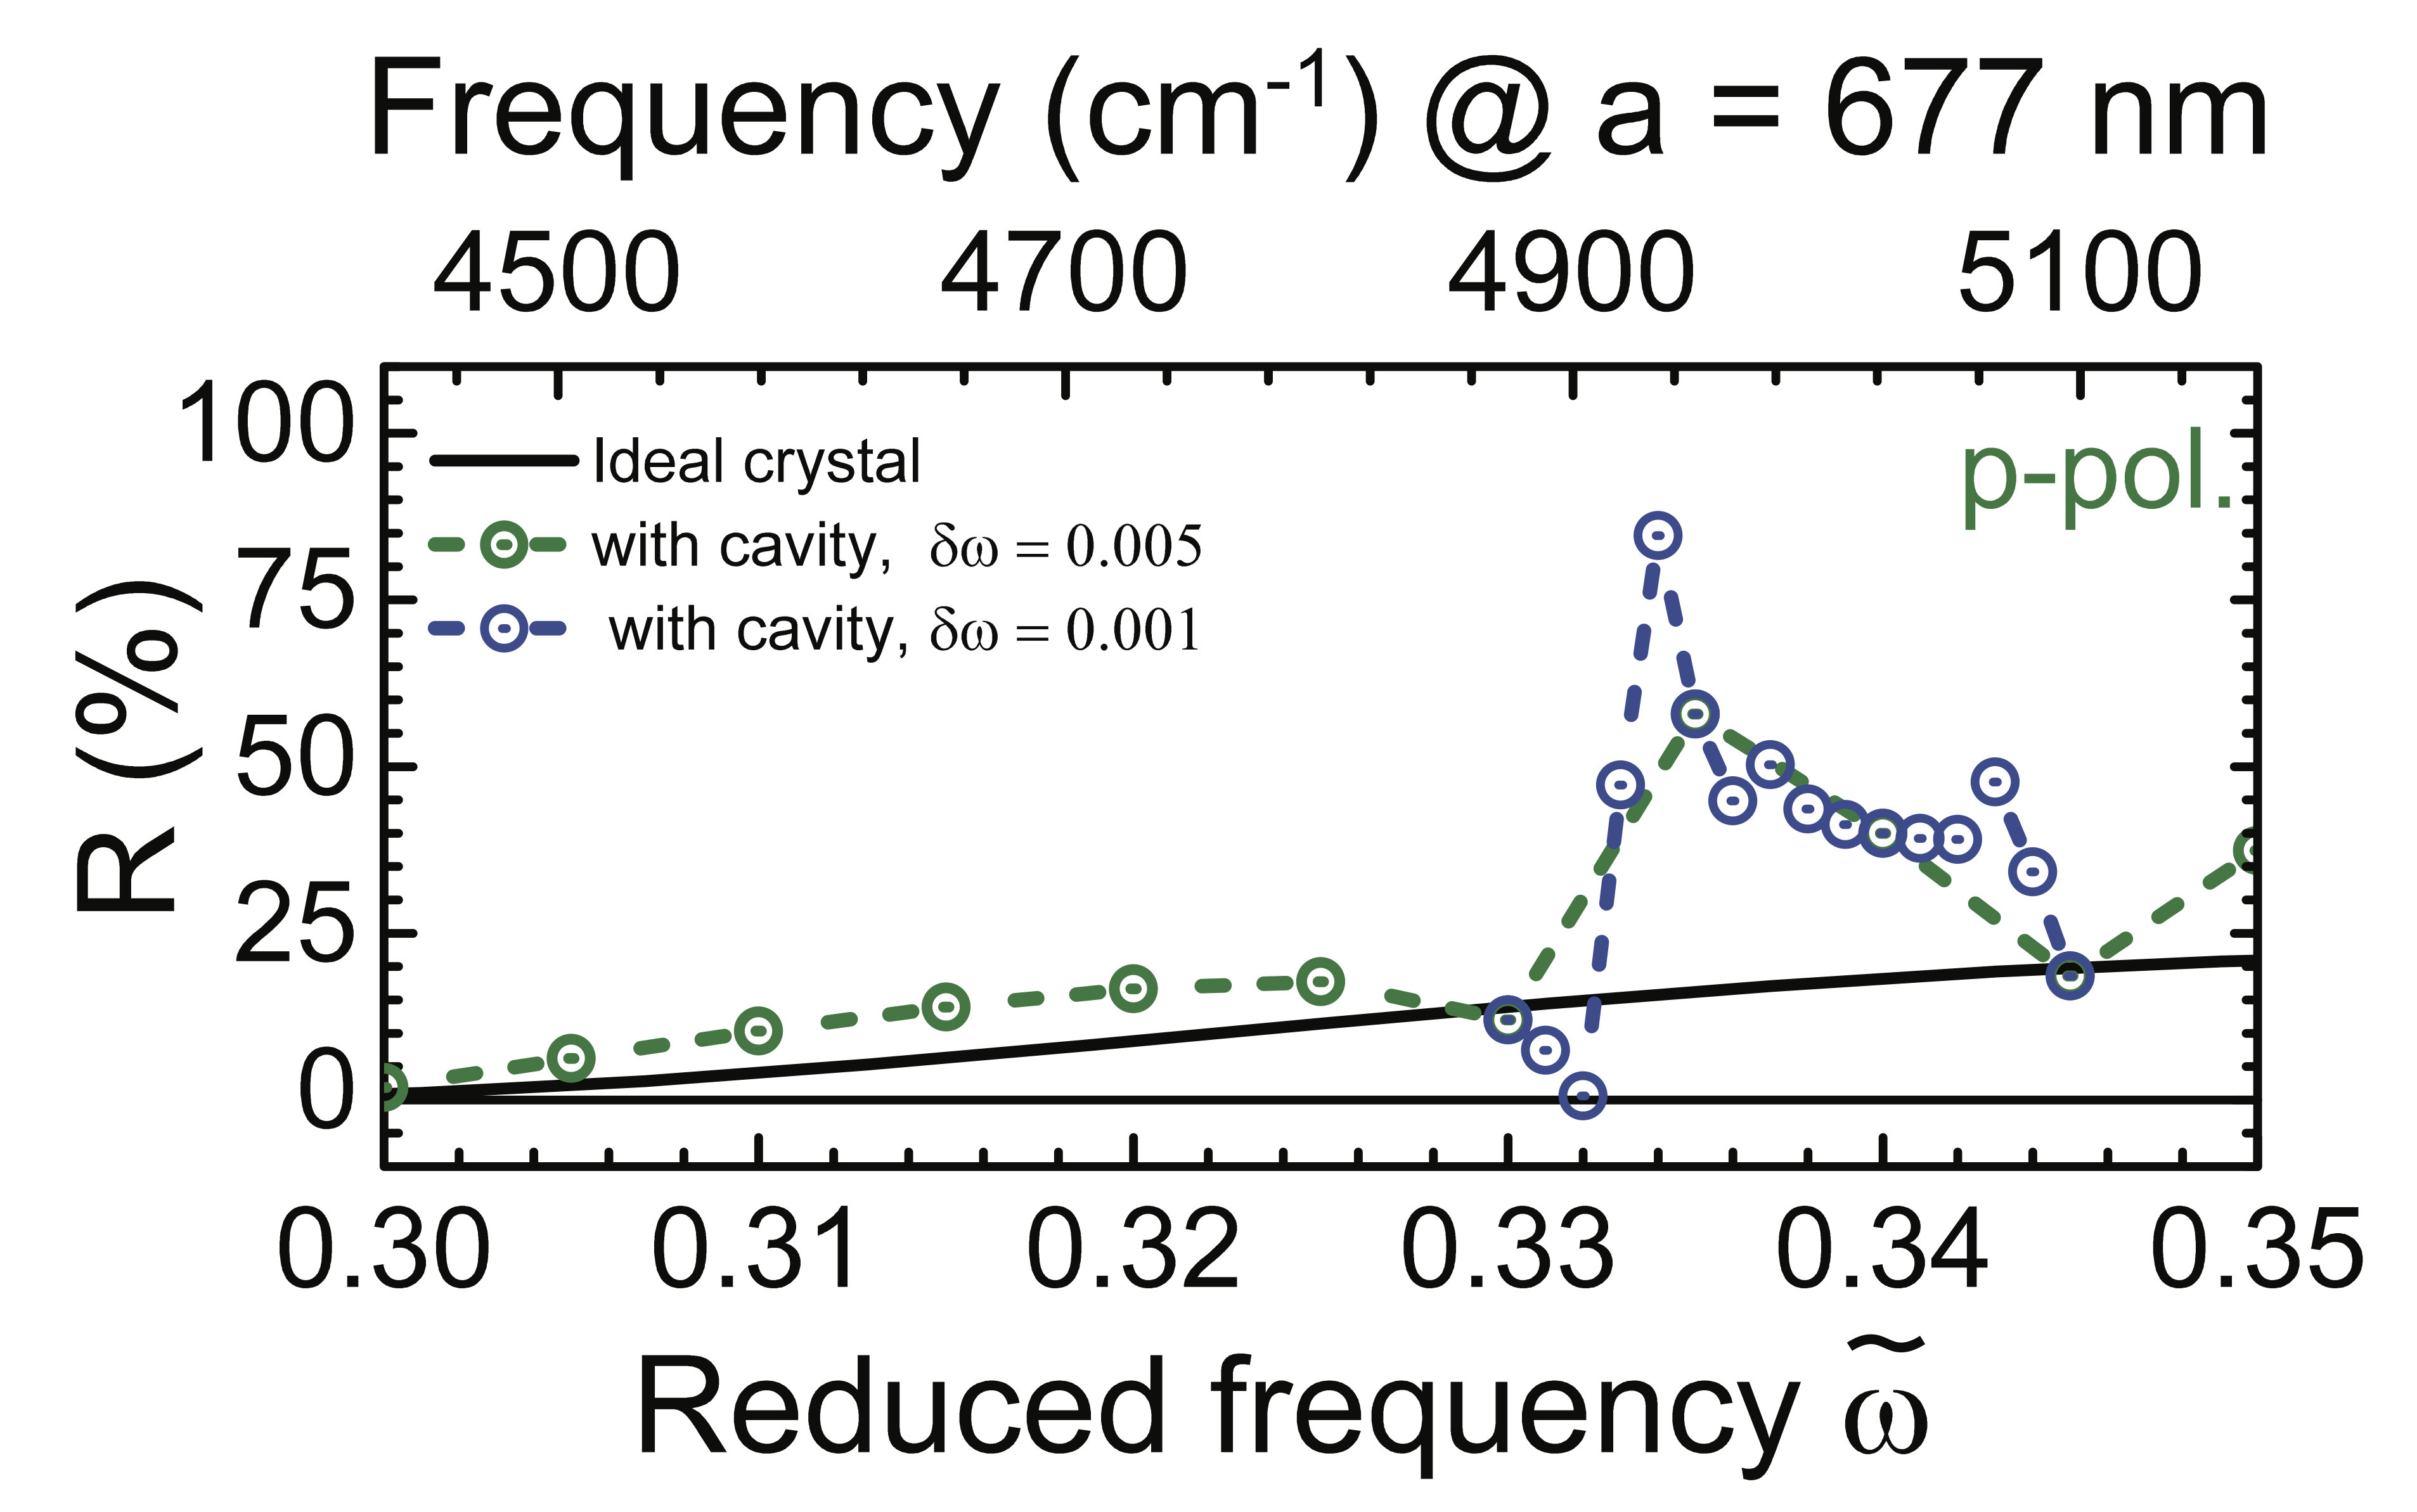
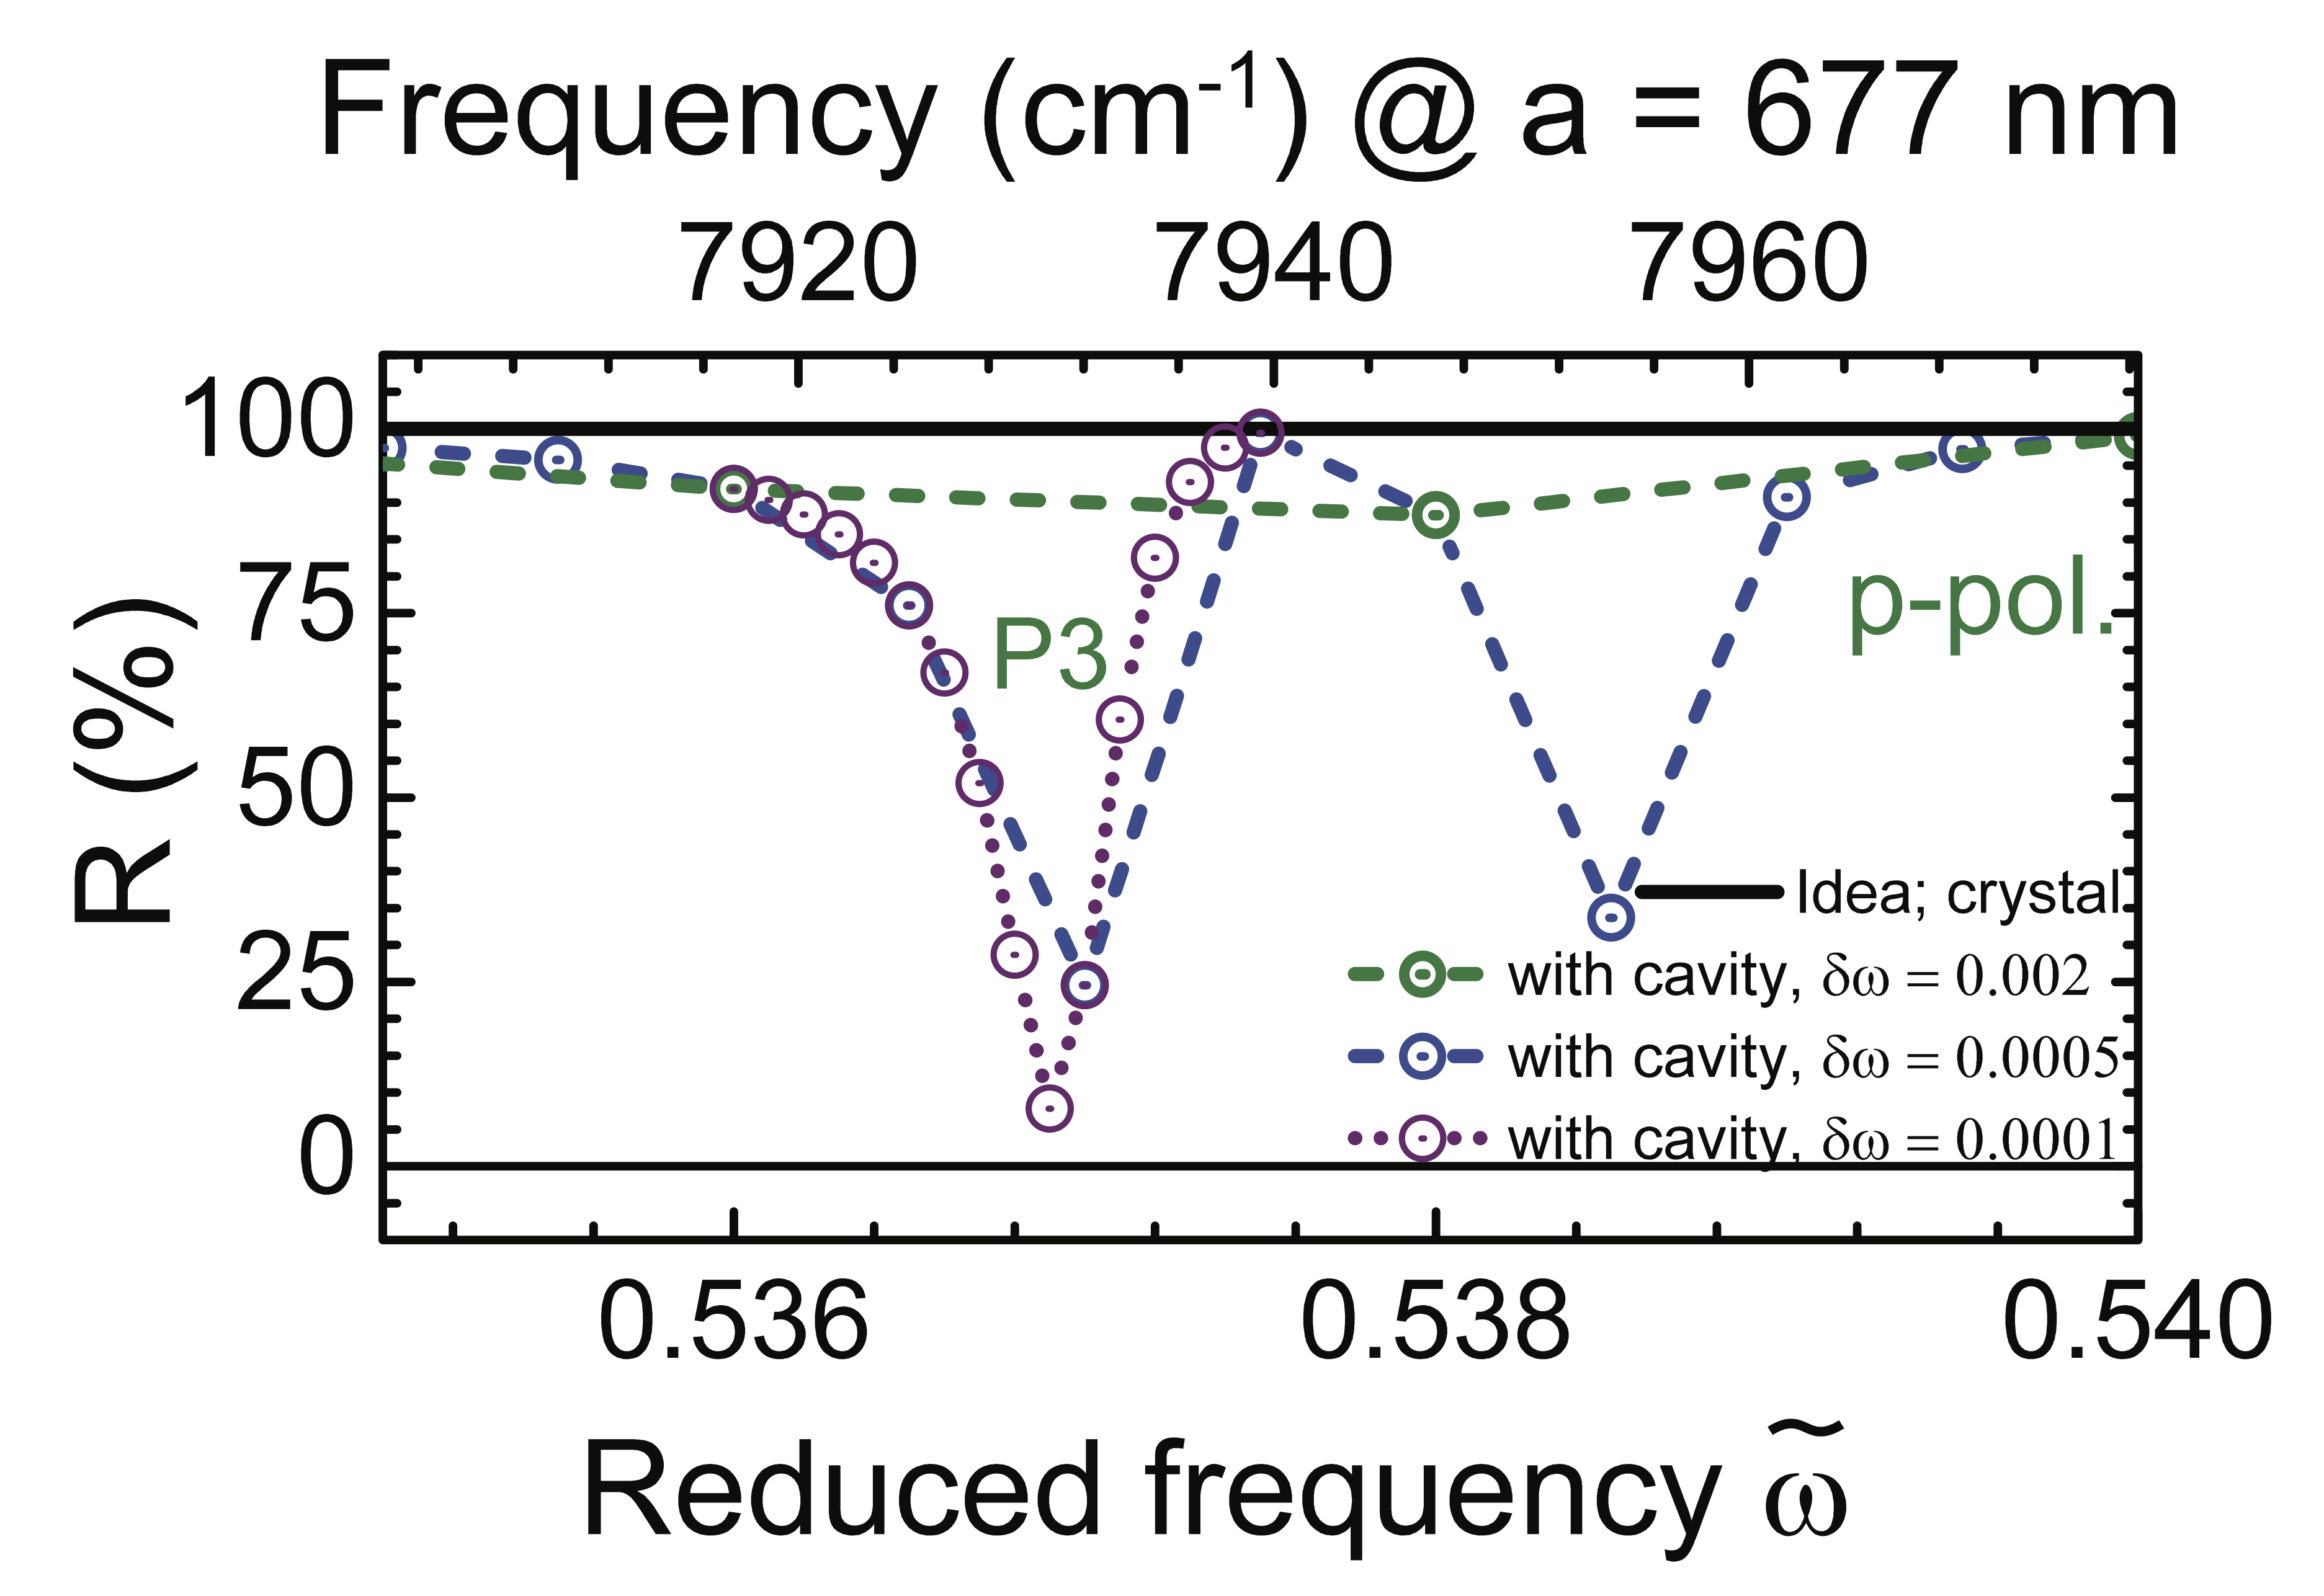
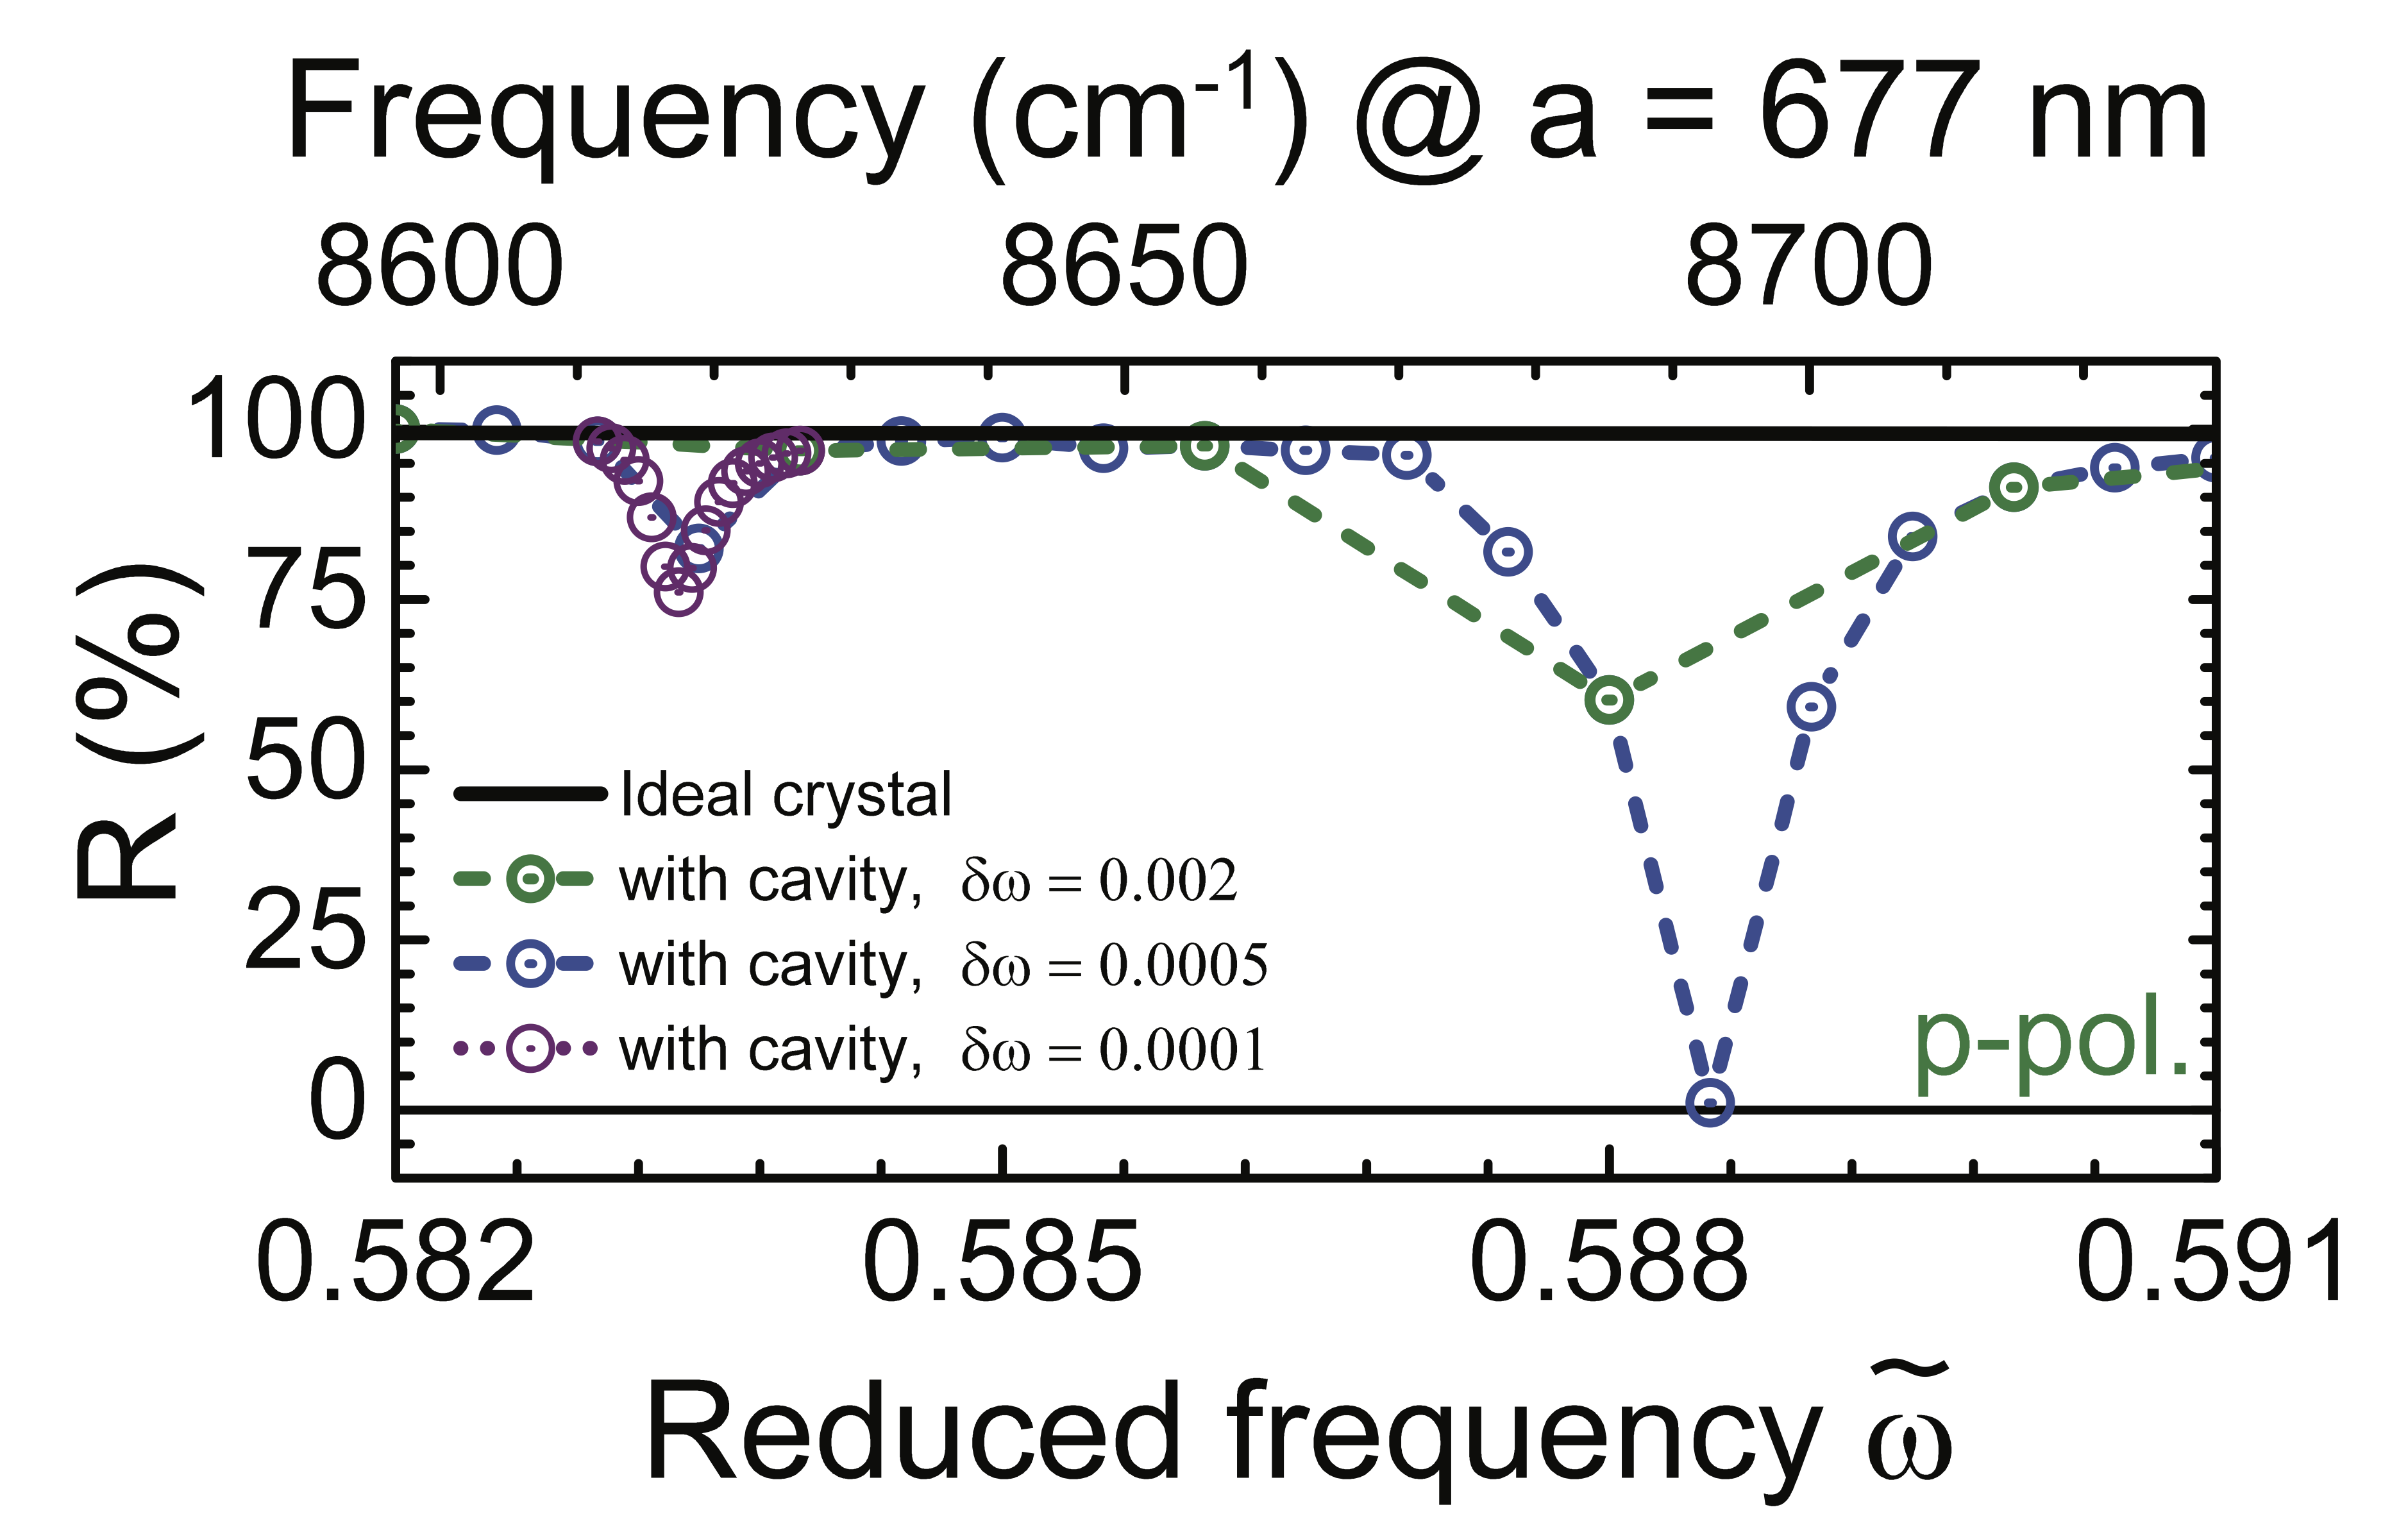
The reflectivity troughs corresponding to the cavity resonances have bandwidths as narrow as . Thus, a calculation performed for an insufficient number of discrete frequencies will not detect these reflectivity resonances. Moreover, the calculation may not show the actual minima of a given trough due to saturation. Therefore, we perform the frequency convergence analysis to determine the appropriate frequency resolution to detect these resonance troughs. We define the frequency resolution as the spacing between two adjacent frequencies. We choose three frequency regimes: below the band gap between and , inside the band gap between and , and near the upper edge of the band gap between and .
Figure 19(a) shows the reflectivity spectra between and below the band gap. A comparison between the spectra for a perfect inverse woodpile and an inverse woodpile with a point defect reveals a Fano resonance at , as previously shown in Section III.4. We observe that the maximum of this Fano resonance increass with frequency resolution. Also, a new Fano resonance appears at at higher frequency resolution. Since we performed calculations using for the frequency range below the 3D band gap, there could be more Fano resonances than the ones shown in Fig. 11.
Figure 19(b) shows the reflectivity spectra inside the band gap between and . We observe that P3 cavity resonance troughs at and are detected only at frequency resolutions and . Since we employed a frequency resolution for all calculations inside the 3D band gap, we have successfully detected all possible troughs. However, we note that the minima of the trough with changes around after increasing the frequency resolution by 5 times. Therefore, the observed cavity resonances may show even lower minimum reflectivity at a higher frequency resolution than our present calculations.
Figure 19(c) shows the reflectivity spectra near the upper edge of the band gap between and . We see two troughs at and . We observe that the trough at is invariant with frequency resolution, whereas the minimum value for the trough at changes. Therefore, we surmise that the trough at is a numerical speckle due to the finite sized calculations whereas the trough at corresponds to one of the resonance bands near the upper edge of the band gap.
Appendix D Quality factor versus crystal thickness
We derive an analytic expression for the quality factor as a function of the thickness of the photonic crystal slab. We invoke a simplified one-dimensional (1D) model for a photonic band gap cavity, that corresponds to a Fabry-Perot microcavity consisting of two Bragg mirrors surrounding a central defect layer (cf. Ref. Gerard2003TAP . For a 1D planar Fabry-Perot microcavity, the finesse is expressed in terms of the transmission of the mirrors as Demtroder000book
| (5) |
where the finesse is equal to the th order resonance times the quality factor . The Bragg mirrors have a photonic stop gap, where the transmission decreases exponentially with thickness
| (6) |
Here, is the characteristic Bragg length that can be expressed in terms of the photonic strength (relative stop gap width (), with the band width and the central frequency of the stop band) as
| (7) |
with the lattice spacing of the Bragg mirrors. Taking Eqs. 5, 6, 7 together, considering that a typical microcavity resonance is of a low order (), and considering that in the stop gap the transmission very small (), we arrive at the expression for the quality factor increasing exponentially with the thickness of the cavity structure
| (8) |
References
- (1) K.J. Vahala, “Optical microcavities,” Nature (London) 424, 839 (2003).
- (2) J.-M. Lourtioz, H. Benisty, V. Berger, J.-M. Gérard, D. Maystre, A. Tchelnokov, D. Pagnoux, “Photonic Crystals: Towards Nanoscale Photonic Devices” (Springer, New York, 2008) 2nd Ed.
- (3) L. Novotny and B. Hecht, “Principles of nano-optics” (Cambridge University Press, Cambridge, 2006).
- (4) M. Ghulinyan and L. Pavesi, Eds., “Light Localisation and Lasing: Random and Pseudorandom Photonic Structures,” (Cambridge Univ. Press, Cambridge, 2015).
- (5) T. Baba, “Slow light in photonic crystals,” Nat. Phot. 2, 465 (2008).
- (6) E. Krioukov, D.J.W. Klunder, A. Driessen, J. Greve, and C. Otto, “Sensor based on an integrated optical microcavity,” Opt. Lett. 27, 512 (2002).
- (7) E.M. Purcell, “Spontaneous emission probabilities at radio frequencies,” Phys. Rev. 69, 681 (1946).
- (8) J.-M. Gérard, B. Sermage, B. Gayral, B. Legrand, E. Costard, and V. Thierry-Mieg, “Enhanced spontaneous emission by quantum boxes in a monolithic optical microcavity,” Phys. Rev. Lett. 81, 1110 (1998).
- (9) R.J. Thompson, G. Rempe, and H.J. Kimble, “Observation of normal-mode splitting for an atom in an optical cavity,” Phys. Rev. Lett. 68, 1132 (1992).
- (10) A. Imamolu, H. Schmidt, G. Woods, and M. Deutsch, “Strongly Interacting Photons in a Nonlinear Cavity,” Phys. Rev. Lett. 79, 1467 (1997).
- (11) J.-M. Gérard, “Solid-state cavity-quantum electrodynamics with self-assembled quantum dots,” In: Single Quantum Dots, Ed. P. Michler, Topics in Applied Physics, vol 90 (Springer, Berlin, 2003), pp. 269-315.
- (12) J.P. Reithmaier, G. Sȩk, A. Löffler, C. Hoffmann, S. Kuhn, S. Reitzenstein, L.V. Keldysh, V.D. Kulakovskii, T.L. Reinecke, and A. Forchel, “Strong coupling in a single quantum dot-semiconductor microcavity system,” Nature (London) 432, 197 (2004).
- (13) T. Yoshie, A. Scherer, J. Hendrickson, G. Khitrova, H.M. Gibbs, G. Rupper, C. Ell, O.B. Shchekin, and D.G. Deppe, “Vacuum Rabi splitting with a single quantum dot in a photonic crystal nanocavity,” Nature (London) 432, 200 (2004).
- (14) E. Peter, P. Senellart, D. Martrou, A. Lemaître, J. Hours, J.-M. Gérard, and J. Bloch, “Exciton-photon strong-coupling regime for a single quantum dot embedded in a microcavity,” Phys. Rev. Lett. 95, 067401 (2005).
- (15) M.L. Gorodetsky, A.A. Savchenkov, and V.S. Ilchenko, “Ultimate Q of optical microsphere resonators,” Opt. Lett. 21, 453 (1996).
- (16) D.W. Vernooy, V.S. Ilchenko, H. Mabuchi, E.W. Streed, and H.J. Kimble, “High-Q measurements of fused-silica microspheres in the near infrared,” Opt. Lett. 23, 247 (1998).
- (17) M. Pelton, J. Vuc̆kovíc, G.S. Solomon, A. Scherer, and Y. Yamamoto, “Three-dimensionally confined modes in micropost microcavities: quality factors and Purcell factors,” IEEE J. Quantum Electron. 38, 170 (2002).
- (18) B. Gayral, J. M. Gérard, A. Lematre, C. Dupuis, L. Manin, and J. L. Pelouard, “High-Q wet-etched GaAs microdisks containing InAs quantum boxes,” Appl. Phys. Lett. 75, 1908 (1999).
- (19) H.T. Miyazaki and Y. Kurokawa, “Squeezing visible light waves into a 3-nm-thick and 55-nm-long plasmon cavity,” Phys. Rev. Lett. 96, 097401 (2006).
- (20) M. Kuttge, F.J.G. de Abajo, and A. Polman, “Ultrasmall mode volume plasmonic nanodisk resonators,” Nano Lett. 10, 1537 (2010).
- (21) R. Chikkaraddy, B. de Nijs, F. Benz, S.J. Barrow, O.A. Scherman, E. Rosta, A. Demetriadou, P. Fox, O. Hess, and J.J. Baumberg, “Single-molecule strong coupling at room temperature in plasmonic nanocavities,” Nature (London) 535, 127 (2016).
- (22) D.K. Armani, T.J. Kippenberg, S.M. Spillane, and K.J. Vahala, “Ultra-high-Q toroid microcavity on a chip,” Nature (London) 421, 925 (2003).
- (23) O. Painter, R.K. Lee, A. Scherer, A. Yariv, J.D. O’Brien, P.D. Dapkus, and I. Kim, “Two-dimensional photonic band-gap defect mode laser,” Science 284, 1819 (1999).
- (24) Y. Akahane, T. Asano, B. S. Song, and S. Noda, “High-Q photonic nanocavity in a two-dimensional photonic crystal,” Nature (London) 425, 944 (2003).
- (25) E. Yablonovitch, “Inhibited spontaneous emission in solid-state physics and electronics,” Phys. Rev. Lett. 58, 2059 (1987).
- (26) S. John, “Strong localization of photons in certain disordered dielectric superlattices,” Phys. Rev. Lett. 58, 2486 (1987).
- (27) K. Busch, S. Lölkes, R.B. Wehrspohn, and H. Föll, Eds., “Photonic crystals: advances in design, fabrication, and characterization” (Wiley, Weinheim, 2004).
- (28) M. Minkov, V. Savona, and D. Gerace, “Photonic crystal slab cavity simultaneously optimized for ultra-high Q/V and vertical radiation coupling,” Appl. Phys. Lett. 111, 131104 (2017)
- (29) P.R. Villeneuve, S. Fan, and J.D. Joannopoulos, “Microcavities in photonic crystals: Mode symmetry, tunability, and coupling efficiency,” Phys. Rev. B 54, 7837 (1996).
- (30) E. Özbay, G. Tuttle, M. Sigalas, C.M. Soukoulis, and K.M. Ho, “Defect structures in a layer-by-layer photonic band-gap crystal,” Phys. Rev. B. 51, 13961 (1995).
- (31) M. Okano, A. Chutinan, and S. Noda, “Analysis and design of single-defect cavities in a three-dimensional photonic crystal,” Phys. Rev. B. 66, 165211 (2002).
- (32) J.D. Joannopoulos, S.G. Johnson, J.N. Winn, and R.D. Meade, “Photonic crystals: Molding the flow of light,” (Princeton University Press, Princeton NJ, 2008).
- (33) M. Maldovan and E.L. Thomas, “Diamond-structured photonic crystals,” Nature Mater. 3, 593 (2004).
- (34) L.A. Woldering, A.P. Mosk, R.W. Tjerkstra, and W.L. Vos, “The influence of fabrication deviations on the photonic band gap of three-dimensional inverse woodpile nanostructures,” J. Appl. Phys. 105, 093108 (2009).
- (35) W.L. Vos and L.A. Woldering, in Ref. Ghulinyan2015Book , Chap. 8, p. 180, also available from http://arxiv.org/abs/1504.06803.
- (36) E. Yablonovitch, T.J. Gmitter, R.D. Meade, A.M. Rappe, K.D. Brommer, and J.D. Joannopoulos, “Donor and acceptor modes in photonic band structure,” Phys. Rev. Lett. 67, 3380 (1991).
- (37) M. Bayindir, B. Temelkuran, and E. Ozbay, “Tight-binding description of the coupled defect modes in three-dimensional photonic crystals,” Phys. Rev. Lett. 84, 2140 (2000).
- (38) M. Bayindir and E. Ozbay, “Heavy photons at coupled-cavity waveguide band edges in a three-dimensional photonic crystal,” Phys. Rev. B 62, R2247 (2000).
- (39) S. Ogawa, M. Imada, S. Yoshimoto, M. Okano, and S. Noda, “Control of light emission by 3D photonic crystals,” Science 305, 227 (2004).
- (40) M. Okano and S. Noda, “Analysis of multimode point-defect cavities in three-dimensional photonic crystals using group theory in frequency and time domains,” Phys. Rev. B. 70, 125105 (2004).
- (41) T. Tajiri, S. Takahashi, Y. Ota, J. Tatebayashi, S. Iwamoto, and Y. Arakawa, “Demonstration of a three-dimensional photonic crystal nanocavity in a 110-layered diamond structure,,” Appl. Phys. Lett. 107, 071102 (2015).
- (42) K.M. Ho, C.T. Chan, C.M. Soukoulis, R. Biswas, and M. Sigalas, “Photonic band gaps in three dimensions: new layer-by-layer periodic structures,” Solid State Commun. 89, 413 (1994).
- (43) J. Schilling, J. White, A. Scherer, G. Stupian, R. Hillebrand and U. Gösele, “Three-dimensional macroporous silicon photonic crystal with large photonic band gap,” Appl. Phys. Lett. 86, 011101 (2005).
- (44) F. García-Santamaría, M. Xu, V. Lousse, S. Fan, P.V. Braun, and J.A. Lewis, “A germanium inverse woodpile structure with a large photonic band gap,” Adv. Mater. 19, 1567 (2007).
- (45) A. Hermatschweiler, A. Ledermann, G.A. Ozin, M. Wegener, and G. von Freymann, “Fabrication of silicon inverse woodpile photonic crystals,” Adv. Funct. Mater. 17, 2273 (2007).
- (46) B. Jia, S. Wu, J. Li, and M. Gu, “Near-infrared high refractive-index three-dimensional inverse woodpile photonic crystals generated by a sol-gel process,” J. Appl. Phys. 102, 096102 (2007).
- (47) R.W. Tjerkstra, L.A. Woldering, J.M. van den Broek, F. Roozeboom, I.D. Setija, and W.L. Vos, “A method to pattern masks in two inclined planes for three-dimensional nano- and microfabrication,” J. Vac. Sci. Tech. B 29, 061604 (2011).
- (48) J.M. van den Broek, L.A. Woldering, R.W. Tjerkstra, F.B. Segerink, I.D. Setija, and W.L. Vos, “Inverse-woodpile photonic band gap crystals with a cubic diamond-like structure made from single-crystalline silicon,” Adv. Func. Mat. 22, 25 (2012).
- (49) D.A. Grishina, C.A.M. Harteveld, L.A. Woldering, and W.L. Vos, “Method to make a single-step etch mask for 3D monolithic nanostructure,” Nanotechnology 26, 505302 (2015).
- (50) L.A. Woldering, A.P. Mosk, and W.L. Vos, “Design of a three-dimensional photonic band gap cavity in a diamondlike inverse woodpile photonic crystal,” Phys. Rev. B. 90, 115140 (2014).
- (51) Ref. Woldering2014PRB also explored greater defect pores in search of acceptor states, but none were found.
- (52) N.W. Ashcroft and N.D. Mermin, “Solid State Physics,” (Saunders, Philadelphia PA, 1976).
- (53) J.D. Jackson, “Classical electrodynamics,” (Wiley, New York NY, 1999), 3rd Ed.
- (54) S. Hack, J.J.W. van der Vegt, and W.L. Vos, “Cartesian light: unconventional propagation of light in a 3D superlattice of coupled cavities within a 3D photonic band gap,” (in preparation, 2018).
- (55) R. Hillebrand, S. Senz, W. Hergert, and U. Gsele, “Macroporous-silicon-based three-dimensional photonic crystal with a large complete band gap,” J. Appl. Phys. 94, 2758 (2003).
- (56) L.A. Woldering, R.W. Tjerkstra, H.V. Jansen, I.D. Setija, and W.L. Vos, “Periodic arrays of deep nanopores made in silicon with reactive ion etching and deep UV lithography,” Nanotechnology 19, 145304 (2008).
- (57) S.G. Johnson and J.D. Joannopoulos, “Block-iterative frequency-domain methods for Maxwell’s equations in a planewave basis,” Opt. Express 8, 3 (2001).
- (58) S.R. Huisman, R.V. Nair, L.A. Woldering, M.D. Leistikow, A.P. Mosk, and W.L. Vos, “Signature of a three-dimensional photonic band gap observed with silicon inverse woodpile photonic crystals,” Phys. Rev. B 83, 205313 (2011).
- (59) M.D. Leistikow, A.P. Mosk, E. Yeganegi, S.R. Huisman, A. Lagendijk, and W.L. Vos, “Inhibited spontaneous emission of quantum dots observed in a 3D photonic band gap,” Phys. Rev. Lett. 107, 193903 (2011).
- (60) D. Devashish, S.B. Hasan, J.J.W. van der Vegt, and W.L. Vos, “Reflectivity calculated for a three-dimensional silicon photonic band gap crystal with finite support,” Phys. Rev. B 95, 155141 (2017).
- (61) “COMSOL Multiphysics® v. 5.2. www.comsol.com, COMSOL AB, Stockholm, Sweden”.
- (62) J.M. Jin, “The finite element method in electromagnetics” (Wiley-IEEE Press, New York, 2000).
- (63) In this paper, we express frequency as a reduced frequency , with the frequency, the lattice parameter, the speed of light (not to be confused with the lattice parameter ). In this definition, the reduced frequency equals .
- (64) ”Serendipity” is a high performance computing cluster whose main features are 16 Dell Power edge R430 servers with each 2x Intel Xeon E5-2698 processors at 2.2GHz, with in total 640 cores and about 3.6 terabyte memory, connected through Infiniband. The head node is a Dell Power Edge R730.
- (65) In Ref. Hack2018 , the dispersion of the defect bands is studied in a superlattice of cavities and interpreted in terms of coupling between many cavities.
- (66) Since the spatial distribution of the electric field is computational memory intensive, the norm of electric field is employed for the correlation calculation.
- (67) D.J. Griffiths, “Introduction to electrodynamics,” (Prentice Hall, Upper Saddle River NJ, 1999).
- (68) M. Burresi, D. van Oosten, T. Kampfrath, H. Schoenmaker, R. Heideman, A. Leinse, and L. Kuipers, “Probing the magnetic field of light at optical frequencies,” Science 326, 550 (2009).
- (69) R. Feynman, R. Leighton, and M. Sands, The Feynman Lectures on Physics, (Addison Wesley, New York, 1964).
- (70) Since the double reflectivity resonance may be the result of a (currently) unknown coupling, it is uncertain whether the widths of either resonance can be attributed to a true resonance width and thus a quality factor. In absence of further information, we derive the bandwidths of P3- and P+ reflectivity resonances to be and .
- (71) S. Datta, C.T. Chan, K.M. Ho, and C.M. Soukoulis, “Effective dielectric constant of periodic composite structures,” Phys. Rev. B 48, 14936 (1993).
- (72) K.L. Chopra, P. D. Paulson, and V. Dutta. “Thin-film solar cells: an overview,” Progr. Photovoltaics: Research and Applications 12, 69 (2004)
- (73) M.A. Green, “Thin-film solar cells: review of materials, technologies and commercial status,” J. Mater. Sci. 18, 15 (2007)
- (74) M.A. Green, “Self-consistent optical parameters of intrinsic silicon at 300K including temperature coefficient,” Sol. Energy Mat. Sol. Cells, 92, 1305 (2008).
- (75) Devashish, “3D periodic photonic nanostructures with disrupted symmetries” (PhD thesis, Univ. of Twente, 2017), see Chapter 1, available from www.photonicbandgaps.com.
- (76) J. Pankove, “Optical processes in semiconductors” (Dover Publications, New York NY, 2001).
- (77) U. Fano, “Effects of configuration interaction on intensities and phase shifts,” Phys. Rev. 124, 1866 (1961).
- (78) B. Luk’yanchuk, N.I. Zheludev, S.A. Maier, N.J. Halas, P. Nordlander, H. Giessen, and C.T. Chong, “The Fano resonance in plasmonic nanostructures and materials,” Nat. Mater., 9, 707 (2010).
- (79) S. Fan and J.D. Joannopoulos, “Analysis of guided resonances in photonic crystal slab,” Phys. Rev. B. 65, 235112 (2002).
- (80) J.P. Vasco, H. Vinck-Posada, P.T. Valentim, and P.S.S. Guimaraes, “Modeling of Fano resonances in the reflectivity of photonic crystal cavities with finite spot size excitation,” Opt. Express 21, 31336 (2013).
-
(81)
In order to interpret reflectivity data with the Fano resonance model, we employ the following line shape Lukyanchuk2010NatMater
where and denote the center frequency and width of the resonance, respectively, and is the Fano parameter that describes the asymmetry. In the models in Fig. 14 for and polarization, the adjusted parameters are , and respectively, , and , and and . The -polarized resonance model is more asymmetric than the -resonance, where we note that the -polarized data are even more asymmetric (beyond what the model captures).(9) - (82) We verified that Z-point in our coordinate system is in the same direction as the K-point in the conventional cubic reciprocal lattice. The modulus of the Z-point is , whereas the modulus of the K-point is , corresponding to of , in good mutual agreement.
- (83) P. M. Chaikin and T. C. Lubensky, “Principles of Condensed Matter Physics,” (Cambridge University Press, Cambridge, 1995).
- (84) M.P.C. Taverne, Y.-L. D. Ho, and J.G. Rarity, “Investigation of defect cavities formed in three-dimensional woodpile photonic crystals,” J. Opt. Soc. Am. B 32, 639 (2015).
- (85) For the inverse woodpile structure, unit cells correspond to lattice planes, see e.g. Ref. Devashish2017PRB .
- (86) E.N. Economou and M.M. Sigalas, “Classical wave propagation in periodic structures: Cermet versus network topology,” Phys. Rev. B 48, 13434 (1993).
- (87) W. Demtröder, “Laser spectroscopy: basic concepts and instrumentation,” (Springer, Berlin-Heidelberg, 2009).