SF2A 2018
Multi-scale three-dimensional visualization of emission, scattering and absorption in active galactic nuclei using Virtual Observatories tools
Abstract
Whether aimed for the study of the planetary systems, the distribution of the stars in the galaxies or the formation of the large-scale structures in the Universe, the sizes of numerical simulations are becoming increasingly important in terms of their virtual volumes and computer memories. The visualization of the data becomes more complicated with the requirement of the exposition of the large number of data points. In order to lighten such burden, Virtual Observatories (VO) have been developed and are now essential tools in astronomy to share existing data, for visualization and for data analysis. Using a software, currently being developed at the Centre de Données de Strasbourg (CDS) jointly with the Astronomical Observatory of Strasbourg, we show how three-dimensional radiative transfer simulations of active galactic nuclei (AGN) can be visualized in order to extract new information. The ability to zoom over ten orders of magnitude and to journey inside/between the multiple scattering regions allows to identify where emission, scattering, and absorption truly take place. Among all the new possibilities offered by the software, it is possible to test the single-scattering hypothesis or evaluate the impact of fragmentation onto the propagation of light echoes within the broad line region (BLR) or the circumnuclear region (torus).
keywords:
Galaxies: active, Galaxies: Seyfert, Polarization, Radiative transfer, Scattering, Virtual observatory tools1 Introduction
In the center of each massive galaxy lies a supermassive black hole (see, e.g., Silk & Rees 1998), but most of those monsters are quiescent. Due to the lack of neighboring stars, gas and dust material they are not actively fed, which results in very low light emission. However, when accretion onsets and matter spirals downward the potential well, the tremendous near-infrared, optical and ultraviolet bolometric luminosity emitted by the system often outshines starlight emission from the host galaxy (Pringle & Rees 1972; Shakura & Sunyaev 1973). The supermassive black hole becomes active and the object is called an active galactic nuclei (AGN). What is truly fascinating is that this object that has the size of a solar system can in effect have a profound impact on the galaxy it resides in (George et al. 2018). This involves more than ten orders of magnitudes, ranging from the Scharzschild radius (a few 10-6 pc for a 108 solar masses black hole) to the extent of the polar outflows (the narrow line region, NLR) that can reach several kilo-parsecs.
If we want to simulate the radiative transfer of photons from the accretion disk to a distant observer, it implies to simulate a variety of environments, from the highly ionized broad line region (BLR) clouds to the dusty circumnuclear torus, involving continuous or fragmented/filamentary structures. This demands heavy numerical calculations that are both time consuming and computationally expensive. Still, several softwares are now able to handle such large scale simulations (see, e.g., Goosmann & Gaskell 2007; Baes et al. 2011; Grosset et al. 2018). What is less mastered, however, is the display of the results. We usually rely on two-dimensional projections that can suffer from projection effects such as aberrations and deformations. Three-dimensional visualizations are usually hampered by the large volume of data that must be loaded and stored in the computer.
In this conference proceedings we present a new software that is currently being developed in Strasbourg as part of the global Virtual Observatory (VO). This tool is meant for displaying large simulations in both degraded and full resolution. The software allows the user to freely journey inside the simulation, isolate a given volume and create videos from several snapshots.
2 3D visualization of AGN simulations
2.1 The radiative transfer code
We first create a numerical model based on the usual morphology and composition of a radio-quiet AGN. To do so, we create an isotropic, punctual, unpolarized radiation source at the center of the model that emits a continuous flux of = 5510 Å photons. This is representative of the central supermassive black hole and its accretion disk. Around the disk we include a flared electron medium that flows from the torus. It’s optical depth is set at unity and it’s half-opening angle from the equatorial plane is 20∘. We also include the BLR by adding 2000 ionized clouds in Keplerian rotation. The optical depth per cloud is also fixed at unity and the BLR sustains the same half-opening angle than the electron flow. The volume filling factor is 25%. Finally, around the BLR, we set an optically-thick, fragmented dusty torus with half-opening angle 30∘ from the equatorial plane. Each of its 2000 clouds has an optical depth of 50 in the V-band. The torus onsets at the dust sublimation radius and ends around 5 pc from the center of the model. Finally we add a pair of collimated winds that flow from 0.01 pc to 1000 pc, using solely electrons at the wind base (optical thickness = 0.1) and a mixture of dust and electrons after the first 30 pc ( = 0.01). The polar bi-conical structure has an half-opening angle of 45∘. This is a simple yet representative model of AGN based on the physical constraints presented in, e.g., Marin (2016).
To simulate the radiative transfer of photons in this complex and multi-scale environment we use the three-dimensional Monte Carlo radiative transfer code stokes***www.stokes-program.info. (Goosmann & Gaskell 2007; Marin et al. 2012, 2015; Rojas Lobos et al. 2018; Marin 2018). We emitted 107 photons and recorded each individual photon’s position, polarization and timing in a binary file that represents 320 Mo (several Go in a text file).
2.2 The visualization tool
The jasmine application is a software created by the Centre de Données de Strasbourg (CDS) to allow 3D visualization of astronomical simulations directly from web navigators (Schaaff et al. 2017). The software is essentially split into two parts: the client architecture, that is used for displaying data, and the server. To load a dataset in the client architecture, a reader has to be written by the user and can be added directly from the interface, while the dataset itself must takes the form of a collection of 3D points (x,y,z) which can possess any number of fields (mass, velocity, temperature, polarization …). The client can perfom various operations on the data, such as changing the coordinate system, displaying multiple dataset in the same window, applying filters on a given field, or creating animations by chaining datasets. Zooms can also be performed on specific parts of the data for more precises operations.
The navigator capacities limit the possibilities offered by the client alone, in regards of the input dataset size. The role of the server is to bypass this limitation by allowing the user to create a database based on the simulation files, given a reader is created and two data-related structures are correctly filled (one for the 3D point structure and one for the simulation boundaries). The created database consists of two trees†††In computer science, a tree is a widely used abstract data type that simulates a hierarchical tree structure, with a root value and subtrees of children (leafs) with a parent node, represented as a set of linked nodes.. The first tree leafs contain the data points, and the second is a degraded representation, whose nodes and leafs consists only of averaged values of the 3D points contained in the first tree.
A huge (terabytes) simulation can be visualized this way by loading its whole degraded representation in the client, and by zooming on regions of interest. Recursive zooms can be performed on very dense areas since the loaded data are also represented by their degraded versions if the residuals points are too numerous. The server side implementation has been successfully tested on one snapshot of the 40963 particles and cells CoDa simulation (Ocvirk et al. 2016), the resulting databases weighting respectively 1.9 Tb (full resolution) and 510 Mb (degraded version). Note that if the client side can be used without the server side, the opposite is also possible by using the server-side only to perform queries on the created database.
2.3 Results
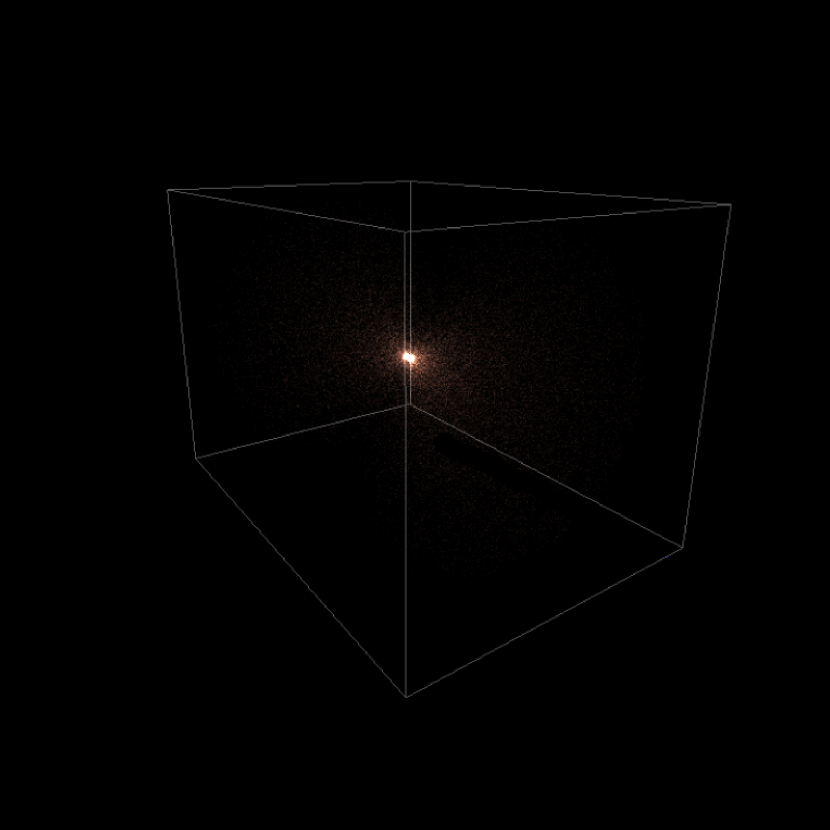
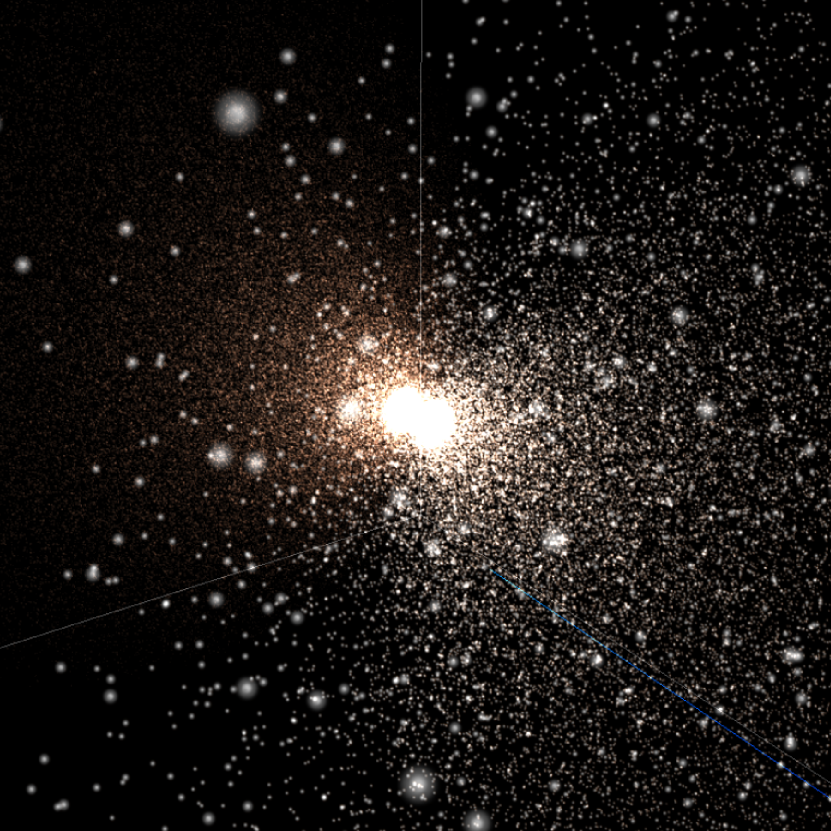
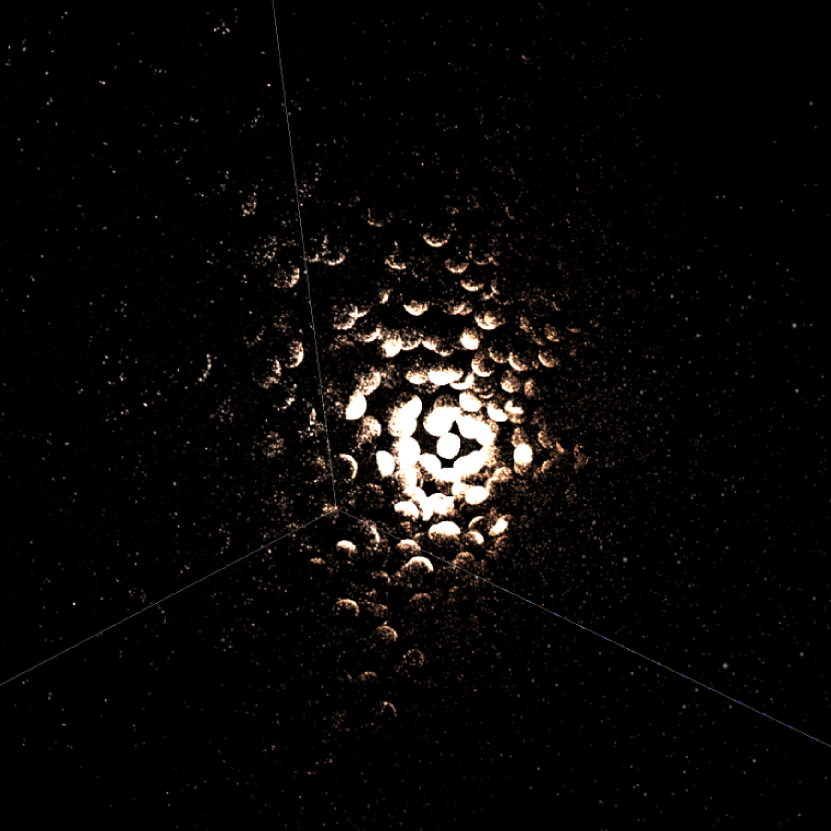
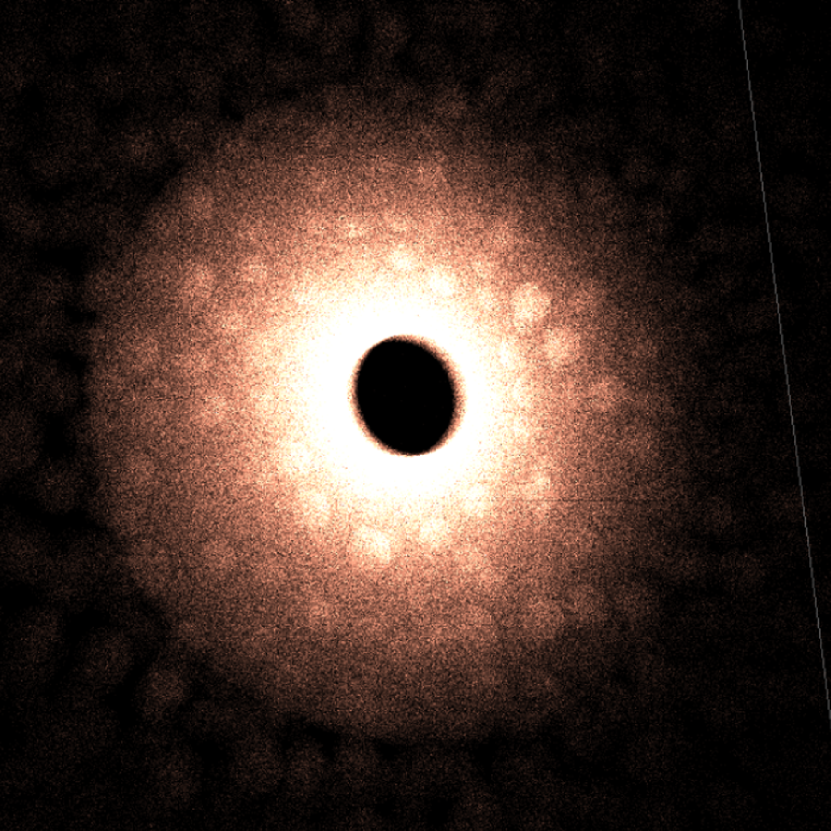
We show in Fig. 1 the results of our AGN simulation using full resolution images from the client side of jasmine. We fixed the inclination of the observer to a typical type-1 viewing angle (i.e., 30∘ from the symmetry axis of the system) that gives us a direct view of the central engine. We located the numerical camera at a distance of about 50 kpc from the center of the model (where the supermassive black hole resides) and highlighted in white the three-dimensional localization of each scattering event. For this proceedings we do not show emission and absorption events but they can easily be highlighted as well. The whiter the dots, the more scattering events are happening. We see from Fig. 1 (a) that at a large distance from the AGN, only a point-like, quasi-stellar source in optical light is visible. Zooming in by a factor of 100 results in Fig. 1 (b) where the observer is located directly inside the polar outflowing wind. Scattering happens sporadically due to the optical thickness of the medium ( = 0.01) and we see that the center of the AGN clearly outshines the rest of the system. The opposite polar wind (whose velocity vector is opposite to the direction of the observer) appears in orange, meaning that there is less scattering events than in the polar outflow directed towards the observer. If we zoom in by a factor of 1000, we see in Fig. 1 (c) the inner regions of the dusty circumnuclear region. The fragmented media are easily visible and the spherical clouds appear to be brighter in the center of the model. The nest-like appearance of the AGN center (Gaskell 2009) creates a hierarchical temperature dependence of the clouds, the ones closer to the central engine being more ionized (hence warmer) than the clouds further away (Almeyda et al. 2017). In addition it appears that each individual cloud has a local temperature/ionization gradient due to self obscuration. Finally, zooming by a factor of 10 and looking at Fig. 1 (d), we can observe the hot flow that connects the central accretion disk (not shown, due to the lack of relativistic effects in the code) and the BLR clouds surrounding it. The central part of the flow is very bright, indicating a strong ionizing flux and many scattering events, which naturally explains the presence of both low and highly ionized lines in the BLR (Rowan-Robinson 1977; Osterbrock 1978). The stokes code does not include strong gravity effects yet, which explains the absence of the typical relativistically warped disk at the center of the image. We detect a gradient of scattering within the electron flow and reveal the impact of scattering onto the BLR clouds.
3 Conclusions
In this contribution we have shown a proof of concept regarding the visualization of huge radiative transfer simulations using VO tools. We focused on the three-dimensional representation of scattering events in AGN using the client side of the jasmine software. The numerical tool allows the observer to circulate within the simulation itself, examine where emission, scattering or absorption take place, and test various scenarios. For example, it is possible to simulate the disruption of a star by the central supermassive black hole (a tidal disruption event) and follow the resulting light echo as it propagates within the AGN. Several theories, such as the bird’s nest appearance of the BLR, can be tested this way. The importance of multiple scattering is also naturally highlighted here. We intend to develop the combined use of jasmine and stokes in various situations, such as AGN variability to be probed in polarized light (Rojas Lobos et al. 2018), demonstrating the growing importance of VO tools in the future of astronomical visualization of large simulations.
Acknowledgements.
This work was supported by the Centre national d’études spatiales (CNES) who funded this project through to the post-doctoral grant “Probing the geometry and physics of active galactic nuclei with ultraviolet and X-ray polarized radiative transfer”.References
- Almeyda et al. (2017) Almeyda, T., Robinson, A., Richmond, M., Vazquez, B., & Nikutta, R. 2017, ApJ, 843, 3
- Baes et al. (2011) Baes, M., Verstappen, J., De Looze, I., et al. 2011, ApJS, 196, 22
- Gaskell (2009) Gaskell, C. M. 2009, New A Rev., 53, 140
- George et al. (2018) George, K., Joseph, P., Mondal, C., et al. 2018, A&A, 613, L9
- Goosmann & Gaskell (2007) Goosmann, R. W. & Gaskell, C. M. 2007, A&A, 465, 129
- Grosset et al. (2018) Grosset, L., Rouan, D., Gratadour, D., et al. 2018, A&A, 612, A69
- Marin (2016) Marin, F. 2016, MNRAS, 460, 3679
- Marin (2018) Marin, F. 2018, ArXiv e-prints
- Marin et al. (2015) Marin, F., Goosmann, R. W., & Gaskell, C. M. 2015, A&A, 577, A66
- Marin et al. (2012) Marin, F., Goosmann, R. W., Gaskell, C. M., Porquet, D., & Dovčiak, M. 2012, A&A, 548, A121
- Ocvirk et al. (2016) Ocvirk, P., Gillet, N., Shapiro, P. R., et al. 2016, MNRAS, 463, 1462
- Osterbrock (1978) Osterbrock, D. E. 1978, Proceedings of the National Academy of Science, 75, 540
- Pringle & Rees (1972) Pringle, J. E. & Rees, M. J. 1972, A&A, 21, 1
- Rojas Lobos et al. (2018) Rojas Lobos, P. A., Goosmann, R. W., Marin, F., & Savić, D. 2018, A&A, 611, A39
- Rowan-Robinson (1977) Rowan-Robinson, M. 1977, ApJ, 213, 635
- Schaaff et al. (2017) Schaaff, A., Deparis, N., Gillet, N., et al. 2017, ASP Conference Series, 512, 503
- Shakura & Sunyaev (1973) Shakura, N. I. & Sunyaev, R. A. 1973, A&A, 24, 337
- Silk & Rees (1998) Silk, J. & Rees, M. J. 1998, A&A, 331, L1