On the radial metallicity gradient and radial migration effect of the Galactic disk
Abstract
We study the radial metallicity gradient as a function of [Mg/Fe] and with the help of a guiding radius based on the Apache Point Observatory Galactic Evolution Experiment and Gaia and then analyze the radial migration effect on the radial metallicity gradient and metallicity-rotation gradient between the Galactic thin and thick disks. The derived trend of gradient versus [Mg/Fe] shows a transition at [Mg/Fe] dex, below which the gradient is negative and varies a little as [Mg/Fe] increases; however, it changes sharply in [Mg/Fe] ranges of 0.16-0.18, above which the gradient increases linearly with increasing [Mg/Fe], being a positive value at [Mg/Fe] dex. These positive gradients in the high-[Mg/Fe] populations are found at kpc, and there are nearly no gradients toward higher . By comparing the metallicity distributions, the radial metallicity gradients and the metallicity-rotation gradients between the total sample and kpc subsample (or kpc subsample), we find that, for the thick disk, blurring flattens the gradient and favors metal-poor high-eccentricity stars. These stars are responsible for the measured positive metallicity-rotation gradient of the thick disk.
1 INTRODUCTION
The Milky Way disk has been suggested to host a thick disk, in addition to its thin disk, based on tje results of geometric decomposition works (e.g. Gilmore & Reid, 1983; Jurić et al., 2008; Jia et al., 2014). Generally, the thick disk is thought to be old as the thin disk (e.g. Bensby et al., 2005; Yoachim & Dalcanton, 2008). Other age-related properties, such as -element abundances (e.g. Fuhrmann, 1998; Bensby et al., 2003, 2005; Reddy et al., 2006; Haywood, 2008; Adibekyan et al., 2011) and kinematics (Chiba & Beers, 2000; Gilmore et al., 2002; Yoachim & Dalcanton, 2005), are also found to be different from the thin disk. Although the formation mechanism of the thick disk is still debated, four kinds of scenarios are widely known so far: heating (e.g. Quinn et al., 1993), accretion (e.g. Abadi et al., 2003), gas-rich mergers (e.g. Brook et al., 2004; Brournaud et al., 2009), and radial migration (e.g. Schönrich & Binney, 2009). In particular, the last one has attracted much attention because it could be triggered by the well-known non-axisymmetric structures of the Milky Way disk (such as spiral arms and bars). On the other hand, radial migration would alter the disk structure and chemical composition through churning (stars changing angular momentum) and blurring (stars conserving their angular momentum, Schönrich & Binney, 2009), which makes the interpretation of the observational results complicated. In this respect, the study on the radial metallicity gradient, which records the enrichment history of stellar abundances at a given radial location, provides a good way to disentangle the radial migration effect on the chemical evolution of the Galactic disk.
The radial metallicity gradient has been well studied in previous works based on a variety of stellar tracers. Önal Tas et al. (2016) gave a detailed summary in their Table 1, where the thin disk has a negative gradient and the thick disk shows a flat or even positive gradient. Moreover, the overall disk gradient was found to gradually flattens toward high , which is proposed to be driven mainly by radial migration (Schönrich & McMillan, 2017). Interestingly, the metallicity-rotation gradient is also found to be negative for the thin disk but positive for the thick disk (e.g. Adibekyan et al., 2013; Allende Prieto et al., 2016), which is also linked with the radial metallicity gradient. It has been suggested that the negative (positive) metallicity-rotation gradients is driven by the negative (positive) radial metallicity gradient for thin (thick) disk stars due to blurring effect (Vera-Ciro et al., 2014; Allende Prieto et al., 2016; Schönrich & McMillan, 2017). In this case, a thick disk star born in the inner disk with epicyclic motion would tend to be metal poor due to the positive radial metallicity gradient. Meanwhile, its current location in the solar neighborhood is near the orbit’s apo-center and thus tends to rotate slower. This naturally results in a positive metallicity-rotation gradient for thick disk stars. Supporting this scenario, Toyouchi & Chiba (2014) reported that the measured radial metallicity gradients for -enhanced (thick disk) populations are positive.
Note that Toyouchi & Chiba (2014) adopted the guiding radius , instead of current Galactocentric distance , since the gradient, if measured with , likely suffers from the radial migration effect and the usage of the guiding radius can diminish the blurring effect. However, the elemental abundances in Toyouchi & Chiba (2014) are based on low-resolution spectra of the Sloan Digital Sky Survey (SDSS), and distances are based on photometric methods. These can be greatly improved using recently released high-quality data. Investigating the radial metallicity gradient by taking into account the guiding radius and the metallicity-rotation gradients based on accurate elemental abundances and radial velocity from high-resolution spectra provided by the Apache Point Observatory Galactic Evolution Experiment (APOGEE, Majewski et al., 2017) survey is of much interest. Additionally, the wealth astrometric information from Gaia (Gaia Collaboration et al., 2016) enables us to perform a statistical analysis on the radial metallicity gradient with the aid of the guiding radius. Specifically, we aim to derive the radial metallicity gradient as a function of [Mg/Fe] and and analyze the effect of radial migration on the radial metallicity gradient and metallicity-rotation gradient between the Galactic thin and thick disks.
2 Data
APOGEE is a high-resolution (), near-infrared H-band (1.5-1.7 µm) spectroscopic survey targeting on red giants selected with a cut of (Zasowski et al., 2013). It provides precise radial velocities, stellar parameters, and elemental abundances through self-designed pipelines (Nidever et al., 2015; Holtzman et al., 2015; García Pérez et al., 2016). Recently, the second Gaia data release (DR2, Gaia Collaboration et al., 2018) provides parallaxes (distances) and proper motions for billions of stars, which contains most stars in the APOGEE/SDSS DR14 survey (Abolfathi et al., 2018). Our sample of stars is selected by cross-matching between APOGEE DR14 and Gaia DR2.
The distances in Galactic cylindrical coordinates and are calculated using parallaxes from Gaia DR2, and we adopt the solar position of 8.0 kpc (Reid, 1993). The spatial velocities (,,) in left-hand Cartesian coordinates are calculated from radial velocities from APOGEE DR14, with the distances and proper motions from Gaia DR2. In the calculation, we restrict stars with the relative error of parallax less than 20%, which leads to the error of proper motion less than 1 for most stars. We correct the solar motion with respect to the local standard of rest of = (-10.00, +5.25, +7.17) (Dehnen & Binney, 1998) and adopt coordinate transformation to obtain the cylindrical coordinate velocities and . The orbital parameters, peri-center (), apo-center (), and eccentricity () are calculated with the galpy (Bovy, 2015) under the potential of MWPotential2014. Then, the guiding radius (), at which the minimum of effective potential occurs, is calculated under this potential through the following equation:
| (1) |
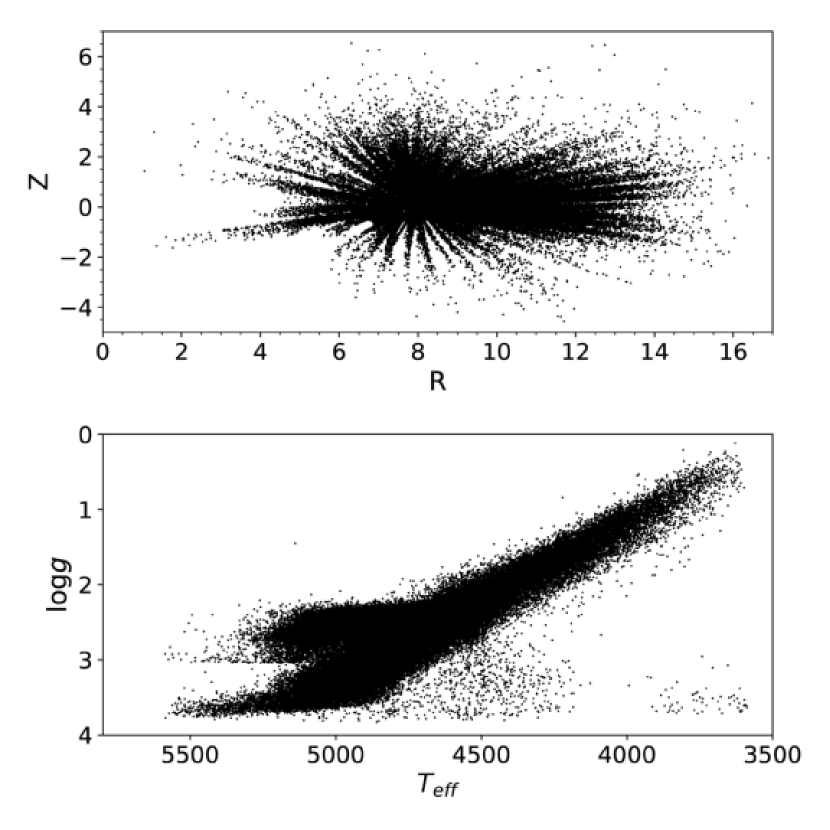
where is the circular velocity in this potential and is the angular momentum, which is a constant of motion in axis symmetric potential. The guiding radius identifies the radius of the circular orbit with an angular momentum of . From the probability point of view, this radius better represents the Galactocentric distance at which a star was born than since many stars do not have circular orbits (Boeche et al., 2013). We then expect that a star with () has moved outward (inward) to the current location after it was born. In addition, we exclude stars with [M/H] of less than dex and stars with a total velocity of more than 150 to diminish the contamination from the halo. We also exclude stars at the fields of (, ) (10∘, 10∘) to remove bulge stars. Finally, we have stars for the following analysis. The versus plane and the versus log diagram of the sample are shown in Fig. 1. This sample comprises giants with effective temperature in the range of 3500-5600 K, and it covers a wide spatial range of kpc and kpc.
3 Analysis and Results
3.1 Radial metallicity gradient as a function of [Mg/Fe]
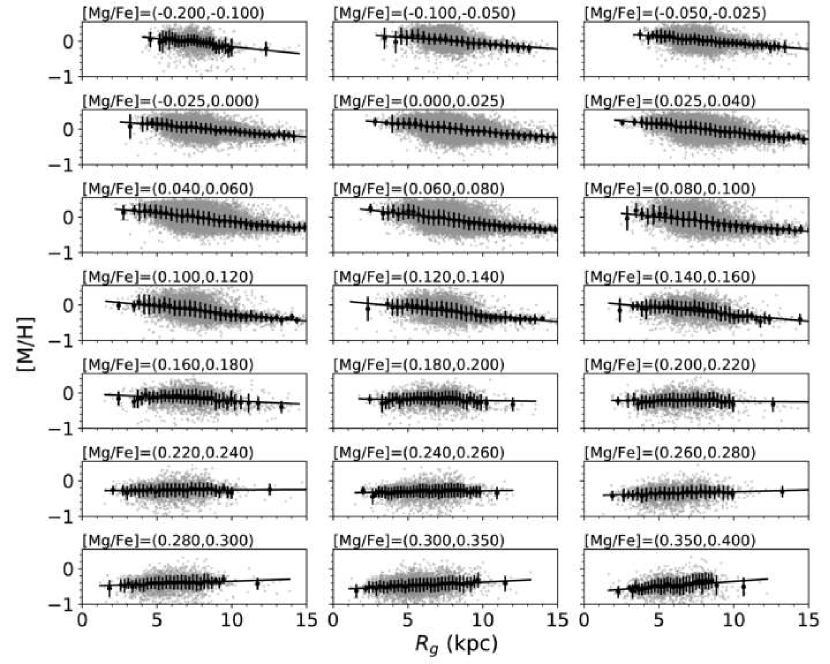
In order to investigate the variation of metallicity gradient with [Mg/Fe], we illustrate the versus [M/H] diagrams for 21 [Mg/Fe] bins in Fig. 2. The bin size is arbitrarily set so that enough stars can be used for the statistical analysis. In every [Mg/Fe] bin, we first divide into 50 equal-length intervals and then adjust adjacent intervals to ensure the number of stars in every final interval is larger than 20. In Fig. 2, black dots indicate the means of metallicities, and the corresponding error bars represent the standard deviations of the means. Then, we adopt a linear regression to the dots in every [Mg/Fe] bin and obtain the radial metallicity gradient. The resulting gradient varies from dex/kpc to dex/kpc as [Mg/Fe] increases from to dex, which is illustrated in Fig. 3. Fig. 3 shows that the gradient for low-[Mg/Fe] population with [Mg/Fe] below dex is negative and varies slightly as [Mg/Fe] increases. Then, the gradient changes sharply at [Mg/Fe] around 0.18 dex, after which the gradient for the high-[Mg/Fe] population rises steadily and becomes positive at [Mg/Fe]. The absolute values of Pearson correlation coefficients are larger than 0.67 with the values less than 0.001 for bins of [Mg/Fe] dex and bins of [Mg/Fe] dex, indicating strong evidence of correlations between metallicity and . For the middle [Mg/Fe] bin of 0.24-0.26 dex, the coefficient is of 0.39 with a value of 0.017, indicating evidence of correlation between metallicity and . However, for the [Mg/Fe] bins of 0.18-0.24 dex, the coefficients are in the range of 0.16-0.22 with the values larger than 0.1, indicating no significant evidence for such correlations. Note that the blue arrow in Fig. 3 indicates a transition of the radial metallicity gradient at [Mg/Fe]. In light of the fact that [Mg/Fe] is a proxy for age, this transition implies the separation between the thick disk and the thin disk because the former is typically older than the latter. In short, the thick disk that is represented by stars with [Mg/Fe] has a linear trend in the gradient versus the [Mg/Fe] plane, and the thin disk characterized by [Mg/Fe]0.18 appears to be relatively complicated. This difference indicates that the thin disk and the thick disk are distinct stellar populations.
Our data is consistent with the results summarized in Table 1 of Önal Tas et al. (2016) in which the thin disk has a negative radial metallicity gradient, whereas the thick disk has a flat or positive gradient. But the measured values of radial metallicity gradients for thick disk stars are very different in the literature, varying from a positive gradient (Casagrande et al., 2012; Carrell et al., 2012; Önal Tas et al., 2016), to nearly no gradient (Cheng et al., 2012; Boeche et al., 2013, 2014; Mikolaitis et al., 2014; Xiang et al., 2015; Plevne et al., 2015; Anders et al., 2017), and even a negative gradient (Hayden et al., 2014). These discrepancies may be caused by the sample biases. As pointed out in Anders et al. (2017), the gradient could depend on, e.g. the sample’s spatial location, age distributions, insufficient statistics, and selection biases. These factors are hardly to qualify among the works, and thus it is not easy to compare our results with other observational works based on a different data sample and different tracers. Instead, we prefer to compare our results with theoretical works. In this respect, Kawata et al. (2018) performed -body simulations to the APOGEE data and found that the initial radial metallicity gradient of the thick disk progenitor should not be negative, but should be either flat or even positive. Moreover, some Galactic chemical evolution models (e.g. Chiappini et al., 2001; Schönrich & McMillan, 2017) suggest that the inside-out formation of the Galaxy gives a positive radial gradient for thick disk stars. Our results support these theoretical works by providing evidence that the radial metallicity gradient of the Galactic disk depends on the [Mg/Fe] ratio, and the thick disk has a flat or positive radial metallicity gradient.

3.2 The radial metallicity gradients at different intervals
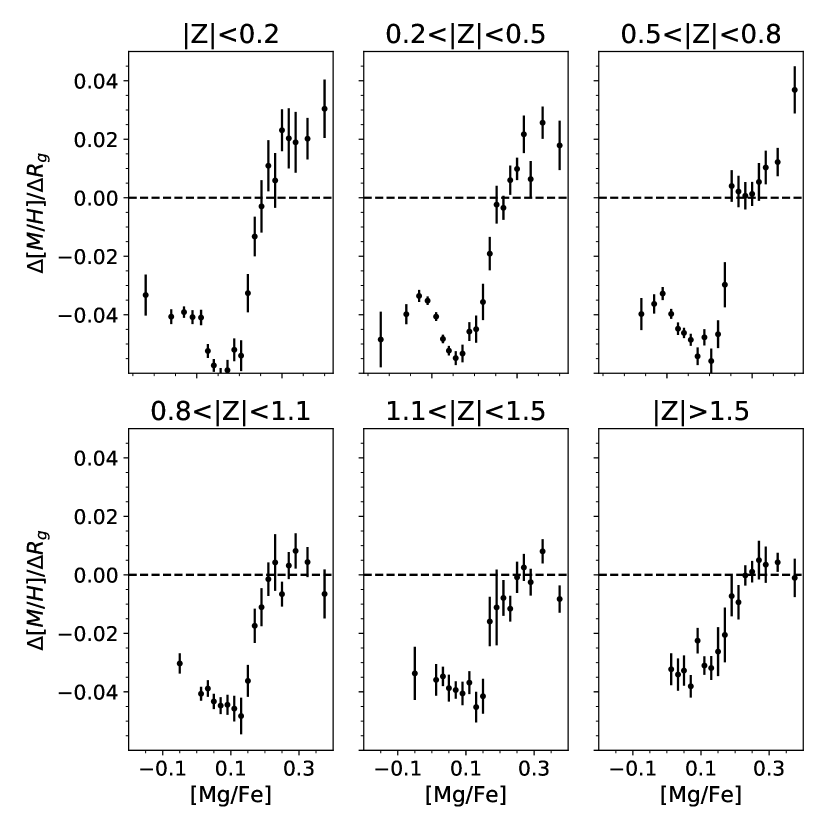
It is interesting to investigate the dependence of the relation between the radial metallicity gradient and the [Mg/Fe] ratio on in light of the fact that the thin and thick disks dominate at different ranges. For this purpose, we split into six bins: kpc, kpc, kpc, kpc, kpc and kpc. The relations of radial metallicity gradients versus [Mg/Fe] ratios at different bins are presented in Fig. 4. It shows that the negative gradient for the low-[Mg/Fe] sequence remains in all bins, while the positive radial metallicity gradient of the high-[Mg/Fe] sequence with [Mg/Fe] dex only exists at kpc, and there is nearly no gradient in larger bins. It should be noted that this trend disagrees with the result in Toyouchi & Chiba (2014), who found that the positive gradient is nearly unchanged as increases (see their Fig. 4).
3.3 Radial metallicity gradient between the thin and the thick disks
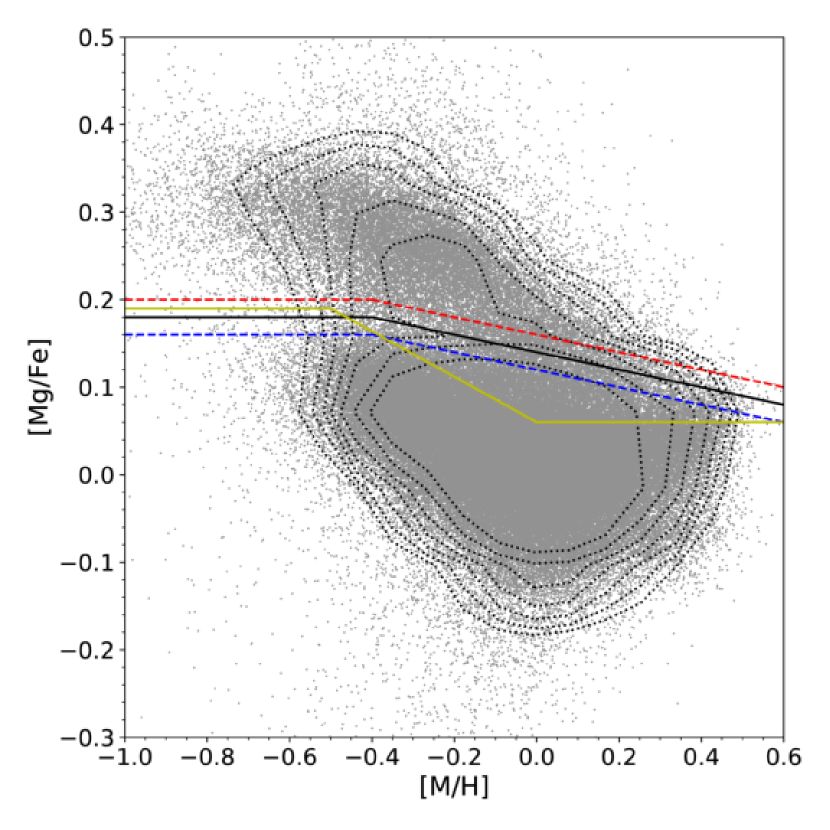
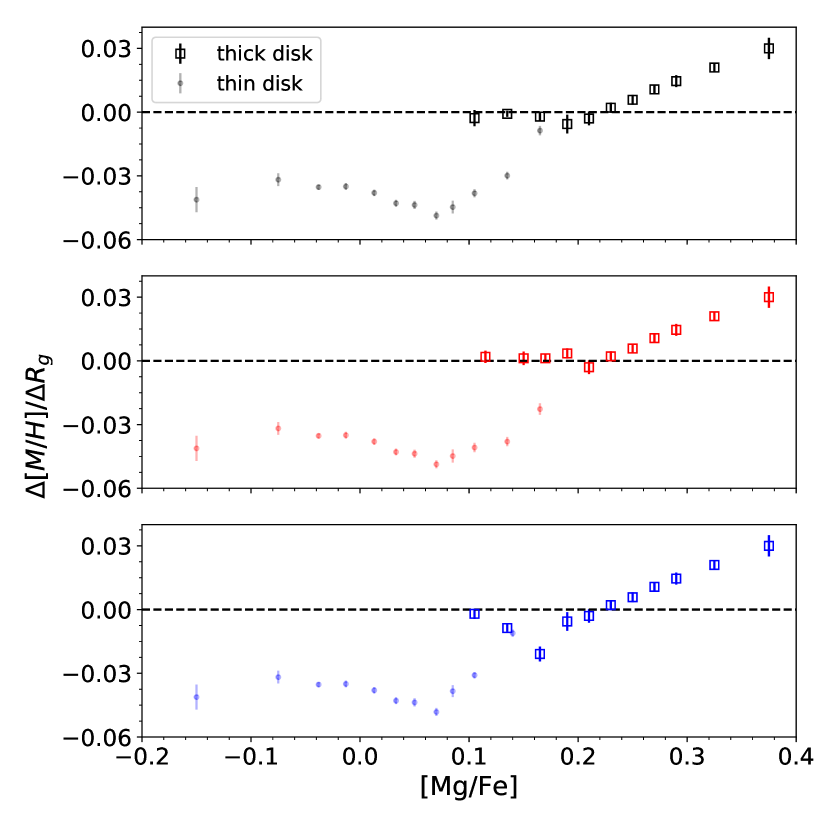
It may be too simple to separate the thin disk and the thick disk based on the [Mg/Fe] ratio at 0.18 dex only. We adopt a conventional way to divide them in the chemical plane, as shown in Fig. 5. A separation that adopted in the high-resolution study by Adibekyan et al. (2011) is illustrated by the yellow line. It is clear that this separation is inappropriate for this work. Instead, we adopt a varying [Mg/Fe] ratio as a function of [M/H] by passing the three points of (-1.0, 0.18), (-0.4, 0.18), and (0.6, 0.8) in the [M/H] versus [Mg/Fe] diagram, which is presented by a black solid line in Fig. 5. We shift this line by 0.02 dex in [Mg/Fe] upward (red dash line) and downward (blue dash line) in order to examine if the derived result depends on the separation criterion between the thin and thick disk. Note that the red line defines a relatively clean thick disk star population, and the blue line separates a relatively clean thin disk star population.
Based on the new separations, similar procedures are adopted to derived the radial metallicity gradient as functions of [Mg/Fe] for the thin disk and the thick disk populations in Fig. 6. From the top panel to the bottom panel, the results correspond to the separations that represented by the black, red, and blue lines, respectively. Compared with Fig. 3, a prominent feature of the top panel of this figure is that the thick disk presents a flat gradient at the low-[Mg/Fe] end and then subsequently rises linearly to the high-[Mg/Fe] end. Similar features also hold in the middle panel that correspond to a separation containing a relatively clean sample of thick disk stars. However, the bottom panel shows that the flat gradients in the [Mg/Fe] range of 0.12-0.18 dex for the thick disk have been affected by pollution of thin disk stars and appear negative at [Mg/Fe] dex. This suggests that adopting an improper chemical definition of the thick disk would affect the derived radial metallicity gradient. Besides, we notice an interesting feature, which is that the gradient of the thin disk seems to transit continuously into the thick disk by following the linearly rising trend. This feature somewhat coincides with the finding that the structural parameters smoothly transit in the chemical plane (Bovy et al., 2012, 2016).
3.4 Radial migration effect
One superiority of using the guiding radius to derive radial metallicity gradient is that it can diminish the blurring effect as it conserves the angular momentum. We expect that the quantity of could somewhat reflect the radial migration effect, and this quantity would be a simple and first approximation to help us disentangle how the radial migration affect the observation results. We assume that a subsample of stars with kpc would suffer little from the radial migration effect (blurring), and the remaining subsample with kpc is supposed to include the migration stars. In light of this, we expect that the footprint of the radial migration effect can be traced by comparing the results derived from the kpc subsample (or kpc subsample) and the total sample. we note that the stars with kpc are tend to move on highly eccentric orbit.
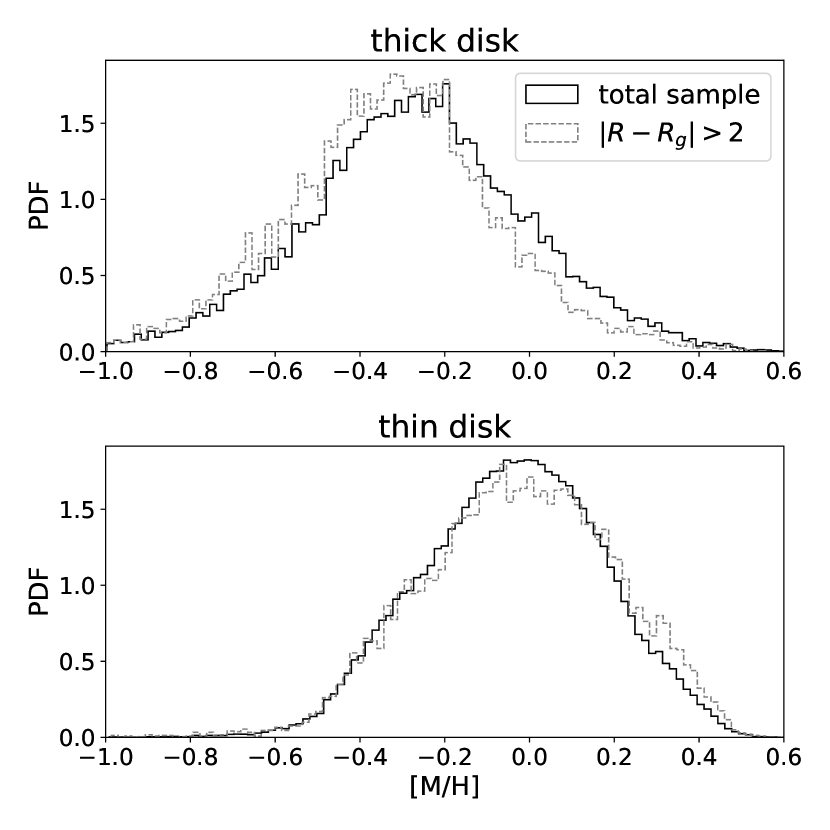
We first investigate the differences in the metallicity distributions between the subsample of kpc and the total sample for the thin disk and the thick disk in Fig. 7. In the top panel of this figure, metal-poor stars are over-populated in the kpc sample as compared to the total sample. This implies that the migration favors the metal-poor for thick disk population, while the bottom panel shows that the metallicity distributions are similar between these two samples, which means that the migration does not play a significant role in shaping the thin disk’s metallicity distribution.
Second, we compare the radial metallicity gradients between the kpc subsample and the total sample by using Galactocentric distance . We find that the thin disk gives a similar negative gradient between these two samples. However, the gradient in the thick disk becomes flat, changing from dex/kpc to dex/kpc when moving from the kpc subsample to the total sample. Considering the total sample contains migration stars with kpc, this is an evidence that radial migration flattens the radial metallicity gradient .
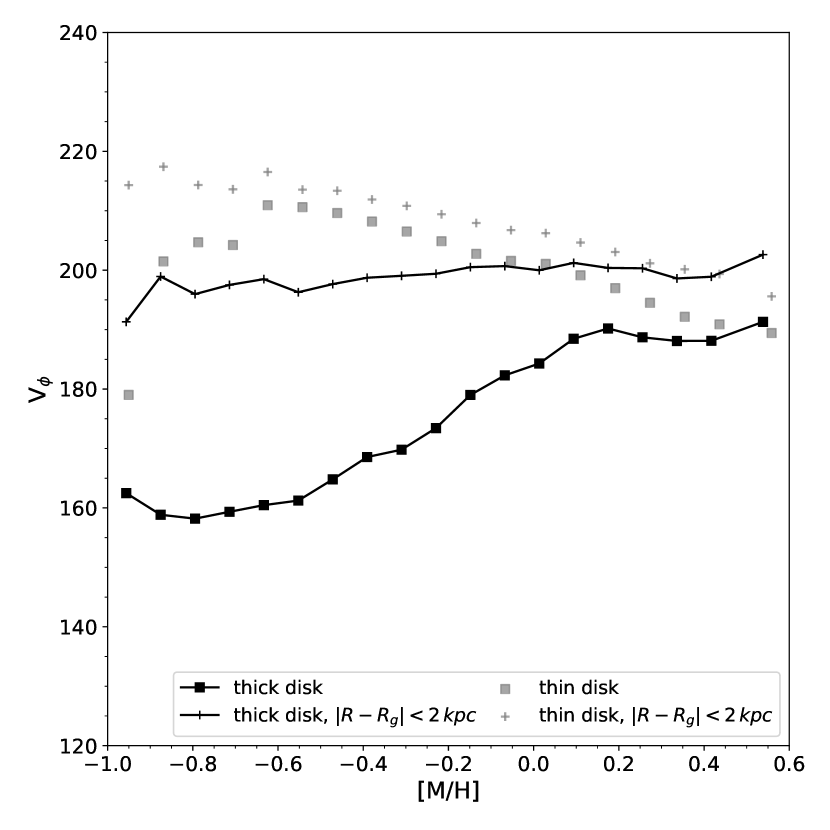
Finally, we investigate the differences in the metallicity-rotation gradients between the kpc subsample and the total sample in Fig. 8. The total sample gives a positive gradient of 26.5 and a negative gradient of -6.4 for thick disk and thin disk, respectively. However, the gradient changes from 26.5 to 3.8 when using kpc subsample for the thick disk, which is close to the gradient of -6.4 for the thin disk. Note that the only difference between these two samples is the absence of some metal-poor stars with high eccentricity in the kpc subsample. Therefore, the change in the metallicity-rotation gradient for the thick disk implies that the metal-poor high-eccentricity stars are responsible for the thick disk’s positive . This is an observational signature in which blurring contributes to the positive metallicity-rotation gradient of the thick disk.
4 Implications on the formation and evolution of the disk
Before we discuss the implications of our results on the formation and evolution of the disk, we note that the usage of the guiding radius, rather than the Galactocentric distance , may introduce a bias against metal-rich inner disk stars that move on nearly circular orbits, as proposed by Boeche et al. (2013). This bias arises only when the eccentricity of the star is not well-sampled at small . Due to the large sample size in our work provided by APOGEE and Gaia, the eccentricities are well-sampled at kpc, and even at smaller , a fraction of low-eccentricity stars still exist. In view of this, we expect this bias would not affect much on our measured radial metallicity gradients. Moreover, in the small region, the potential missing stars are supposed to be, on average, metal-rich (Boeche et al., 2013) and should have relatively low-[Mg/Fe] ratios, thus we consider this bias in particular has less effect on the thick disk (high-[Mg/Fe] star population).
The variations of the radial metallicity gradient with [Mg/Fe] and provide a way to infer the star formation history of the disk. As shown in Fig. 3 and Fig. 6, the thin disk shows negative radial metallicity gradient, whereas the thick disk presents flat and positive gradients. The negative gradient of the thin disk is usually understood as a natural result of the inside-out formation scenario (e.g. Chiappini et al., 2001), i.e. the star formation rate is higher in the inner disk than the outer disk. The positive gradient of the thick disk can also be achieved in this scenario under reasonable assumptions, which was recently suggested by Schönrich & McMillan (2017). They showed an example of the achieved positive radial metallicity gradient for star-forming gas by adopting high central gas-loss rates and re-accretion of one quarter of the lost enriched material in conjunction with the inside-out formation.
However, the results presented in Sect. 3.2 suggest that the positive radial metallicity gradients of the thick disk only exist in kpc, and the gradients are found to be flattened at larger intervals complicates this formation scenario. These features seems to be reconciled with the upside-down disk formation fashion (e.g. Bird et al., 2013), i.e. stars first forming in a geometrically thick layer and then in thinner layers. A recent work from Kawata et al. (2018) suggested that the thick disk forming in an upside-down fashion could have a different initial radial metallicity gradient, even including a negative one, and then the effect of the inside-out formation produced an overall flat or positive gradient when the formation was completed. Another work by Fragkoudi et al. (2017) supports this argument. They suggested that the inner disk star populations arose from an interstellar medium that has a mostly flat radial metallicity gradient forming in an upside-down fashion. These works support a picture where the Galactic disk formed in an inside-out and upside-down fashion, in which stars first formed in the thick layer (or larger ) had flat radial metallicity gradients, and the subsequently formed stars in the thin layer (smaller ) obtained their positive gradients through the inside-out formation fashion, thus the gradients are positive at low and flat at larger . Therefore, our results can be understood from the inside-out and upside-down disk formation scenario.
5 Summary and Conclusions
In this work, we investigate the radial metallicity gradient between the thin and thick disks, with the help of the guiding radius, and analyze the effect of radial migration on the derived radial metallicity gradient and the metallicity-rotation gradient based on a large and high precision data from Gaia and APOGEE. To infer the Galactic disk formation history, we derive the radial metallicity gradient as a function of [Mg/Fe] and . We find that the radial metallicity gradient of low-[Mg/Fe] population ([Mg/Fe]0.16 dex) is negative and has small variations with [Mg/Fe], and this gradient changes sharply until [Mg/Fe] reaches 0.18 dex, after which the gradient rises linearly and becomes positive at [Mg/Fe]. The positive gradients in the high-[Mg/Fe] population are found to limit at kpc only, and there is nearly no gradient toward higher . The above results imply that the Galactic disk formed in an inside-out and upside-down fashion. Moreover, the different trends of versus [Mg/Fe] between the thick disk and thin disk, which are characterized by the high-[Mg/Fe] population ([Mg/Fe]0.18 dex) and the low-[Mg/Fe] population ([Mg/Fe]0.18 dex), respectively, indicate that the transition between them occurs at [Mg/Fe]0.18 dex. With a more specific division of the thin and thick disks in the chemical plane, we still find that the trends of versus [Mg/Fe] are rather different between the thin and thick disks, which indicates that the thin disk and thick disk are two distinct star populations. In the meantime, the thick disk clearly presented a flat or positive gradients depending on the [Mg/Fe] ratio.
In order to study the radial migration effect, we adopt a quantity, , to reflect the blurring effect since blurring does not change on but does on . A subsample with kpc is thought to not suffer from the blurring effect, and the remaining subsample with kpc is considered to contain migration stars. By comparing the metallicity distributions, the radial metallicity gradients , and the metallicity-rotation gradients between the total sample and the alternative two above subsamples, we find that blurring process flattens the gradient and favors metal-poor high-eccentricity stars for the thick disk. These stars are responsible for the measured positive metallicity-rotation gradient in the thick disk.
ACKNOWLEDGMENTS
We would like to thank the referee for their constructive comments that significantly improve this paper. This work is supported by the National Natural Science Foundation of China under grant No. 11625313, 11573035, and 11390371; the Astronomical Big Data Joint Research Center; and co-founded by the National Astronomical Observatories, Chinese Academy of Sciences, and the Alibaba Cloud. X.-X Xue thanks the ”Recruitment Program of Global Youth Experts” of China.
Funding for the Sloan Digital Sky Survey IV has been provided by the Alfred P. Sloan Foundation, the U.S. Department of Energy Office of Science, and the Participating Institutions. SDSS-IV acknowledges support and resources from the Center for High-Performance Computing at the University of Utah. The SDSS web site is www.sdss.org.
SDSS-IV is managed by the Astrophysical Research Consortium for the Participating Institutions of the SDSS Collaboration including the Brazilian Participation Group, the Carnegie Institution for Science, Carnegie Mellon University, the Chilean Participation Group, the French Participation Group, Harvard-Smithsonian Center for Astrophysics, Instituto de Astrofísica de Canarias, The Johns Hopkins University, Kavli Institute for the Physics and Mathematics of the Universe (IPMU) / University of Tokyo, Lawrence Berkeley National Laboratory, Leibniz Institut für Astrophysik Potsdam (AIP), Max-Planck-Institut für Astronomie (MPIA Heidelberg), Max-Planck-Institut für Astrophysik (MPA Garching), Max-Planck-Institut für Extraterrestrische Physik (MPE), National Astronomical Observatories of China, New Mexico State University, New York University, University of Notre Dame, Observatário Nacional / MCTI, The Ohio State University, Pennsylvania State University, Shanghai Astronomical Observatory, United Kingdom Participation Group, Universidad Nacional Autónoma de México, University of Arizona, University of Colorado Boulder, University of Oxford, University of Portsmouth, University of Utah, University of Virginia, University of Washington, University of Wisconsin, Vanderbilt University, and Yale University.
This work has made use of data from the European Space Agency (ESA) mission Gaia (https://www.cosmos.esa.int/gaia), processed by the Gaia Data Processing and Analysis Consortium (DPAC, https://www.cosmos.esa.int/web/gaia/dpac/consortium). Funding for the DPAC has been provided by national institutions, in particular the institutions participating in the Gaia Multilateral Agreement.
References
- Abadi et al. (2003) Abadi, M. G., Navarro, J. F., Steinmetz, M., & Eke, V. R. 2003, ApJ, 597, 21
- Abolfathi et al. (2018) Abolfathi, B., Aguado, D. S., Aguilar, G., et al. 2018, ApJS, 235, 42
- Adibekyan et al. (2013) Adibekyan, V. Z., Figueira, P., Santos, N. C., et al. 2013, A&A, 554, A44
- Adibekyan et al. (2011) Adibekyan, V. Z., Santos, N. C., G., S. S., & G., I. 2011, A&A, 535, L11
- Allende Prieto et al. (2016) Allende Prieto, C., Kawata, D., & Cropper, M. 2016, A&A, 596, A98
- Anders et al. (2017) Anders, F., Chiappini, C., Minchev, I., et al. 2017, A&A, 600, A70
- Bensby et al. (2003) Bensby, T., Feltzing, S., & Lundström, I. 2003, A&A, 410, 527
- Bensby et al. (2005) Bensby, T., Feltzing, S., Lundström, I., & Ilyin, I. 2005, A&A, 433, 185
- Bird et al. (2013) Bird, J. C., Kazantzidis, S., Weinberg, D. H., et al. 2013, ApJ, 773, 43
- Boeche et al. (2013) Boeche, C., Siebert, A., Piffl, T., et al. 2013, A&A, 559, A59
- Boeche et al. (2014) —. 2014, A&A, 568, A71
- Bovy (2015) Bovy, J. 2015, ApJS, 216, 29
- Bovy et al. (2012) Bovy, J., Rix, H.-W., Liu, C., et al. 2012, ApJ, 753, 148
- Bovy et al. (2016) Bovy, J., Rix, H.-W., Schlafly, E. F., Nidever, D. L., & Holtzman, J. A. 2016, ApJ, 823, 30
- Brook et al. (2004) Brook, C. B., Kawata, D., Gibson, B. K., & Freeman, K. C. 2004, ApJ, 612, 894
- Brournaud et al. (2009) Brournaud, F., Elmegreen, B. G., & Martig, M. 2009, ApJ, 707, L1
- Carrell et al. (2012) Carrell, K., Chen, Y. Q., & Zhao, G. 2012, AJ, 144, 185
- Casagrande et al. (2012) Casagrande, L., Schönrich, R., Asplund, M., et al. 2012, A&A, 548, A127
- Cheng et al. (2012) Cheng, J. Y., Rockosi, C. M., Morrison, H. L., et al. 2012, ApJ, 746, 149
- Chiappini et al. (2001) Chiappini, C., Matteucci, F., & Romano, D. 2001, ApJ, 554, 1044
- Chiba & Beers (2000) Chiba, M., & Beers, T. C. 2000, AJ, 119, 2843
- Dehnen & Binney (1998) Dehnen, W., & Binney, J. J. 1998, MNRAS, 298, 387
- Fragkoudi et al. (2017) Fragkoudi, F., Di Matteo, P., Haywood, M., et al. 2017, A&A, 607, L4
- Fuhrmann (1998) Fuhrmann, K. 1998, A&A, 338, 161
- Gaia Collaboration et al. (2018) Gaia Collaboration, Brown, A. G. A., Vallenari, A., et al. 2018, arXiv:1804.09365
- Gaia Collaboration et al. (2016) Gaia Collaboration, et al. 2016, A&A, 595, A1
- García Pérez et al. (2016) García Pérez, A. E., Allende Prieto, C., Holtzman, J. A., et al. 2016, AJ, 151, 144
- Gilmore & Reid (1983) Gilmore, G., & Reid, N. 1983, MNRAS, 202, 1025
- Gilmore et al. (2002) Gilmore, G., Wyse, R. F. G., & Norris, J. E. 2002, ApJ, 574, 39
- Hayden et al. (2014) Hayden, M. R., Holtzman, J. A., Bovy, J., et al. 2014, AJ, 147, 116
- Haywood (2008) Haywood, M. 2008, MNRAS, 388, 1175
- Holtzman et al. (2015) Holtzman, J. A., Shetrone, M., Johnson, J. A., et al. 2015, AJ, 150, 148
- Jia et al. (2014) Jia, Y. P., Du, C. H., Wu, Z. Y., et al. 2014, MNRAS, 441, 503
- Jurić et al. (2008) Jurić, M., Ivezić, v., Brooks, A., et al. 2008, ApJ, 673, 864
- Kawata et al. (2018) Kawata, D., Allende Prieto, C., Brook, C. B., et al. 2018, MNRAS, 473, 867
- Majewski et al. (2017) Majewski, S. R., Schiavon, R. P., Frinchaboy, P. M., et al. 2017, AJ, 154, 94
- Mikolaitis et al. (2014) Mikolaitis, v., Hill, V., Recio-Blanco, A., et al. 2014, A&A, 572, A33
- Nidever et al. (2015) Nidever, D. L., Holtzman, J. A., Allende Prieto, C., et al. 2015, AJ, 150, 173
- Önal Tas et al. (2016) Önal Tas, O., Bilir, S., Seabroke, G. M., et al. 2016, PASA, 33, 44
- Plevne et al. (2015) Plevne, O., Ak, T., Karaali, S., et al. 2015, PASA, 32, 43
- Quinn et al. (1993) Quinn, P. J., Hernquist, L., & Fullagar, D. P. 1993, ApJ, 403, 74
- Reddy et al. (2006) Reddy, B. E., Lambert, D. L., & Allende Prieto, C. 2006, MNRAS, 367, 1329
- Reid (1993) Reid, M. J. 1993, ARA&A, 31, 345
- Schönrich & Binney (2009) Schönrich, R., & Binney, J. 2009, MNRAS, 396, 203
- Schönrich & McMillan (2017) Schönrich, R., & McMillan, P. J. 2017, MNRAS, 467, 1154
- Toyouchi & Chiba (2014) Toyouchi, D., & Chiba, M. 2014, ApJ, 788, 89
- Vera-Ciro et al. (2014) Vera-Ciro, C., D’Onghia, E., Navarro, J., & Abadi, M. 2014, ApJ, 794, 173
- Xiang et al. (2015) Xiang, M. S., Liu, X. W., Yuan, H. B., et al. 2015, RAA, 15, 1209
- Yoachim & Dalcanton (2005) Yoachim, P., & Dalcanton, J. J. 2005, ApJ, 624, 701
- Yoachim & Dalcanton (2008) —. 2008, ApJ, 683, 707
- Zasowski et al. (2013) Zasowski, G., Johnson, J. A., Frinchaboy, P. M., et al. 2013, AJ, 146, 81