Disorder-sensitive node-like small gap in FeSe
Abstract
We investigate the band structure, nematic state and superconducting gap structure of two selected FeSe single crystals containing different amount of disorder. Transport and angle-resolved photoemission spectroscopy measurements show that the small amount of disorder has little effect to the band structure and the nematic state of FeSe. However, temperature and magnetic field dependencies of specific heat for the two samples are quite different. Wave-vector-dependent gap structure are obtained from the three dimensional field-angle-resolved specific heat measurements. A small gap with two vertical-line nodes or gap minima along the direction is found only in the sample with higher quality. Such symmetry-unprotected nodes or gap minima are found to be smeared out by small amount of disorder, and the gap becomes isotropic in the sample of lower quality. Our study reveals that the reported controversy on the gap structure of FeSe is due to the disorder-sensitive node-like small gap.
Among iron-based superconductors (IBSs), FeSe composed of only Fe-Se layers Hsu et al. (2008) has the simplest crystal structure, and is usually regarded as the parent compound. It also manifests very intriguing properties including a nematic state without long-range magnetic order McQueen et al. (2009), crossover from Bardeen-Cooper-Schrieffer (BCS) to Bose-Einstein-condensation (BEC) Kasahara et al. (2014), and a Dirac-cone-like state Zhang et al. (2016); Onari et al. (2016); Sun et al. (2016). Recently, an unexpected high with a sign of superconductivity over 100 K observed in monolayered FeSe Wang et al. (2012); Ge et al. (2015) makes this system a promising candidate for achieving high-temperature superconductivity and probing the mechanism of superconductivity.
To understand these intriguing properties and the unexpected high in FeSe system, it is crucial to know the gap structure, which is unfortunately still under debate. Both the presence of nodes Song et al. (2011); Kasahara et al. (2014) or nodeless but deep minima Lin et al. (2011, 2017); Bourgeois-Hope et al. (2016); Abdel-Hafiez et al. (2013) have been proposed. Even with the same technique, different groups reported different results. In the scanning tunneling microscopy (STM), both the V-shape Song et al. (2011); Kasahara et al. (2014) and U-shape spectrum (finite energy range) Lin et al. (2017); Sprau et al. (2016) were reported. For the thermal conductivity, the difference in the residual reported by different groups are more than 20 times Kasahara et al. (2014); Dong et al. (2009); Bourgeois-Hope et al. (2016). For the electronic specific heat at low temperatures, a linear decrease Lin et al. (2011), a humplike behavior Lin et al. (2017); Sun et al. (2017a), and even a second jump Chen et al. (2017) were observed in previous reports. Such controversy may come from the difference in sample quality since the possible nodes are not symmetry protected as proposed by the theoretical calculation Kreisel et al. (2015). Experimentally, the change of by disorder has already been confirmed by comparing different crystals Böhmer et al. (2016); Rößler et al. (2018) and particle-irradiation effects Teknowijoyo et al. (2016); Sun et al. (2017b, c). Therefore, comparison of the gap structure of samples containing different amount of disorder is promising to solve the controversy in gap structure.
A pioneering research using thermal conductivity indeed observed some differences in samples with different qualities Bourgeois-Hope et al. (2016). Unfortunately, the multigap structure as well as the existence of a very small gap hinder to reveal gap-structure change by traditional temperature or field dependence of quasiparticles (QPs) Bourgeois-Hope et al. (2016). Similar difficulty also happens in specific heat. Fitting of the temperature dependent electronic specific heat in previous reports concluded different gap structures because too many variables are included by the multigap structure Lin et al. (2011, 2017); Sun et al. (2017a); Chen et al. (2017). To solve this issue and directly observe the changes in gap structure, a technique capable of probing QPs excitations with angular resolution is needed. Field-angle-resolved specific heat (ARSH) measurement is an ideal tool for probing the density of states (DOS) of QPs, and it is angle resolved because the low-lying QP excitations near the gap nodes (minima) are field-orientation dependent Sakakibara et al. (2016).
In this report, we investigate the band structure, nematic state, and superconducting gap structure of two selected FeSe single crystals containing different amount of disorder. A small amount of disorders was found to have little effect on the band structure and nematic state. On the other hand, the ARSH measurements reveal that the high-quality sample contains a small gap with two vertical-line nodes or gap minima. However, such nodes or gap minima are smeared out by disorder in the lower-quality sample.
FeSe single crystals were grown by the vapor transport method Sun et al. (2015, 2016). Two kinds of crystals labeled sample A and sample B were selected from two different batches. Structure of the samples was characterized by means of X-ray diffraction (XRD) with Cu-K radiation. Chemical compositions were determined by using a scanning electron microscope (SEM) equipped with EDX. Magnetization measurements were performed using a commercial SQUID magnetometer (MPMS-XL5, Quantum Design). Transport measurements were made by using the six-lead method with the applied field parallel to -axis and perpendicular to the applied current in a physical-property-measurement system (PPMS). The ARPES measurements were performed on a spectrometer with a VG-Scienta R4000WAL electron analyzer and a laser delivering 6.994 eV photons. The energy resolution of the system was set to 5 meV. All measurements were done in ultra high vacuum better that 510-11 Torr. The temperature dependence of the specific heat was also measured by using PPMS. The magnetic-field dependence of the specific heat was measured in a dilution refrigerator under fields up to 14.7 T. The field-orientation dependence of the specific heat was measured in an 8 T split-pair superconducting magnet with a 3He refrigerator. The refrigerator can be continuously rotated by a motor on top of the Dewar with an angular resolution better than 0.01∘. More details about the calibration and the validity of the measurement system were presented in our review paper Sakakibara et al. (2016).
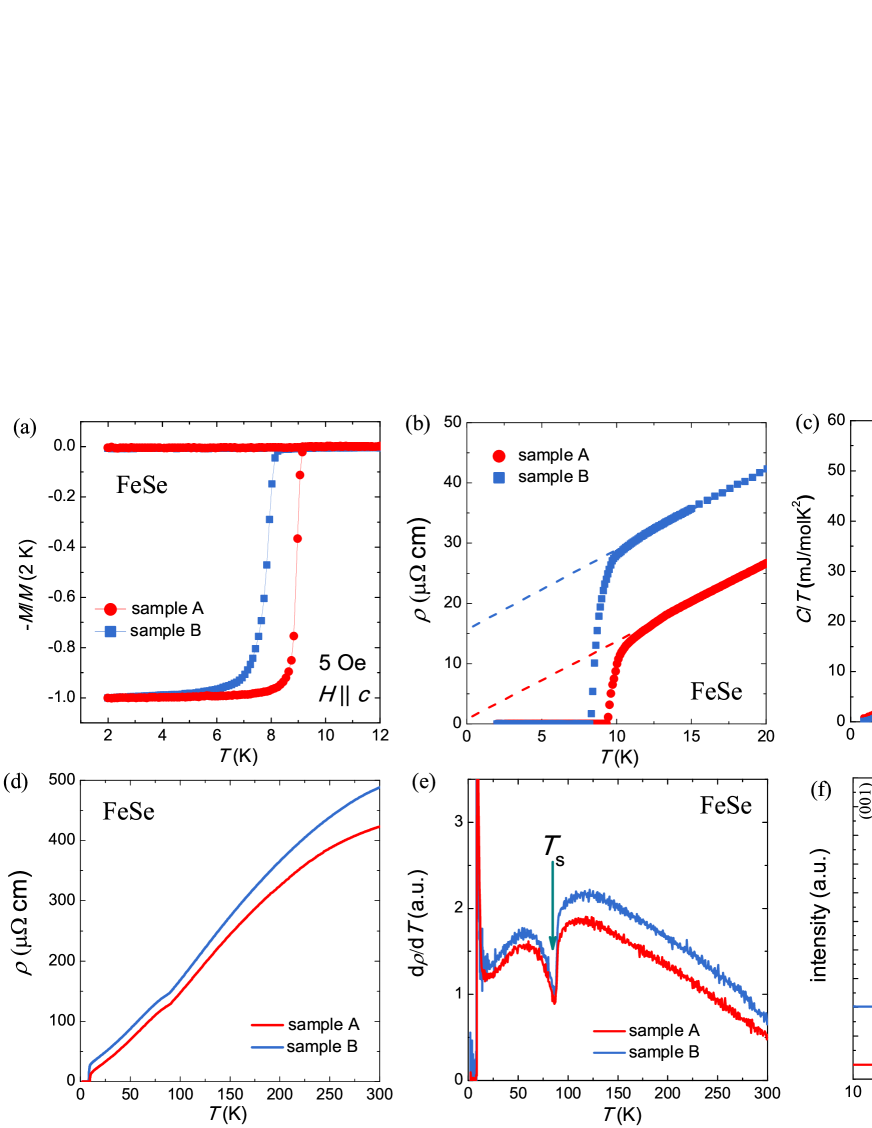
Figure 1(a) shows the temperature dependence of the normalized magnetization at 5 Oe for the two samples A and B. Sample A displays 9.2 K, which is slightly higher than that of 8.3 K observed in sample B. The small difference in can be also witnessed in the temperature dependences of resistivity (Fig. 1(b)) and specific heat (Fig. 1(c)). From the low-temperature curves in Fig. 1(b), we can obtain the residual resistivity, , which is directly related to the amount of disorders. for the two samples were estimated by linearly extrapolating the normal state data above to = 0 K as shown by the dashed lines in Fig. 1(b). The for sample A is only 1 cm, which is the smallest among all the reported values Kasahara et al. (2014); Lin et al. (2017); Bourgeois-Hope et al. (2016). Such extremely small confirms the small amount of disorder as well as the high quality of our sample A. On the other hand, the for sample B is 16 cm. (The simple linear extrapolation may cause some error up to 1 cm. However, it will not affect the magnitude relation in of the two samples.) Together with the resistivity values at 300 K (Fig. 1(d)), the residual resistivity ratio RRR, defined as (300 K)/, is estimated as 425 for sample A, and 30 for sample B, respectively. The increase in and the decrease in RRR indicate more disorder in sample B, which is consistent with the slightly lower . Although the sample B contains more disorder, both samples manifest relatively sharp superconducting transition width in the magnetization, resistivity, and specific heat (Figs. 1(a) - (c)), which indicates the homogeneous distribution of disorder in sample B. In addition to the difference in , the specific heat at 2 K are also different for the two samples, which will be discussed in detail later.
Figure 1(d) compares the temperature dependence of resistivity for the two samples up to 300 K. An obvious kink-like behavior below 100 K is observed in both samples, which is related to the structural transition from tetragonal to orthorhombic structure McQueen et al. (2009). It can be seen more clearly in the first derivative of the temperature-dependent resistivity d/d as shown in Fig. 1(e). Obviously, the structural transition temperatures, , are very close for the two samples (86.4 0.5 K for sample A, and 86.1 0.5 K for sample B). Since the structural transition is believed to be driven by the nematic order Nakayama et al. (2014); Watson et al. (2015, 2016); Coldea and Watson (2018); Fedorov et al. (2016), the similar in samples A and B suggests that such small amount of disorder affects little the nematic order of FeSe. More evidence for the robust nematic order provided by the ARPES measurements will be discussed below.
To get more information about the disorder in both samples, we performed structural and compositional analyses. Fig. 1(f) shows the single crystal XRD pattern for the two samples. Only the (00) peaks can be identified for both samples. Compared to sample A, the positions of peaks are found to be slightly shifted to higher angle in sample B, which can be seen more clearly in the enlarged (004) peaks in the inset. To obtain the lattice constant /, we measured (103) and (104) peaks by scanning the crystal angle independently of 2 (angle between incident and scattered X-rays). The lattice constants are estimated as = (5.5240.002) Å, = (3.7770.002) Å for sample A, and = (5.5210.002) Å, = (3.7650.002) Å for sample B. Both and decrease in sample B, indicating shrinkage of the lattice. The EDX result shows that the molar ratio of Fe : Se in sample A is 1 : 1.005, which is roughly the stoichiometric FeSe. In the sample B, the ratio is 1 : 1.074, which means the amount of Fe is less than Se. Such changes in the structure and composition with increasing the amount of disorder have also been confirmed in three more kinds of FeSe single crystals with different quality. The shrinkage of lattice and the less amount of Fe suggest that the disorders in sample B could be Fe vacancies, which has been reported by recent STM measurements Jiao et al. (2017).
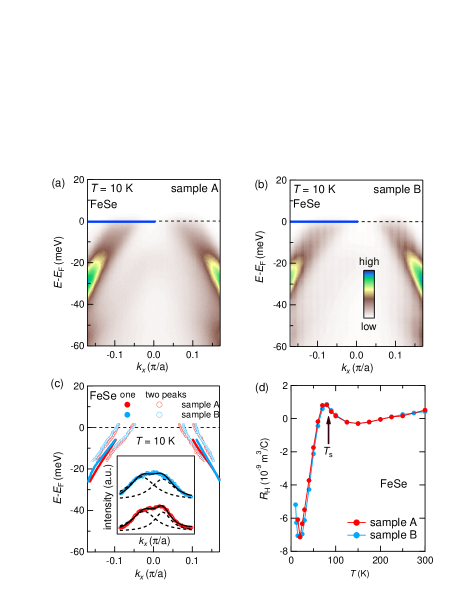
Figures 2(a) and (b) show the ARPES intensity plots around -point for sample A and B at 10 K, respectively. The band splitting due to the nematic electronic order is observed in both samples similar to previous reports Nakayama et al. (2014); Watson et al. (2015, 2016); Coldea and Watson (2018); Fedorov et al. (2016). As a result of the energy splitting, the band structure was extracted from the momentum distribution curves (MDCs) with the function of four-Lorentzian peaks (MDCs in the range of -18 meV - 0 meV) and that of two-Lorentzian peaks (MDCs in the range of -25 meV - -10 meV). The details of the Lorentzian fitting of the MDCs indicated by the blue solid lines are displayed in Fig. 2(c), where the linewidth of sample B is slightly broader than that of sample A, and its band splitting also becomes obscured. The broader linewidth and the obscured band splitting all suggest that the sample B contains more disorder than sample A, which is consistent with the composition and resistivity results. On the other hand, the change in linewidth is very small, indicating only slightly more disorder in sample B. The obtained band structures of the two samples are compared in Fig. 2(c), which are very similar despite the different degrees of disorder. The ARPES results confirm that the nematic order is little affected, consistent with the unchanged .
Figure 2(d) shows the temperature dependences of Hall coefficients () for the two samples, which is determined by the linear part of at small field as described in our previous publication Sun et al. (2016). of the two samples are almost identical at temperatures above , while they are slightly different at low temperatures. At temperatures above , the value of are very small, and close to zero, which can be easily understood by considering a simply compensated two-band model containing equal numbers of electron- and hole-typed charge carriers with similar mobility Sun et al. (2016). Thus, the almost identical for the two samples indicates that the electron- and hole-typed bands are compensated in both samples, which is consistent with the similar band structures observed by ARPES. At temperatures below , decreases quickly with temperature, and shows a large negative values, which indicates that the electron-typed charge carriers become dominant. It may come from the increase of mobility of the electron-typed band Sun et al. (2016). The small difference in at low temperatures represents the different amount of disorders of the two samples.
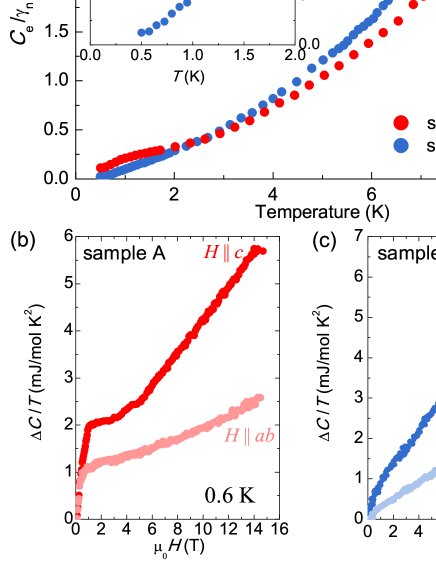
To get insight into the effect of disorder on the gap structure, we compare the temperature dependence of zero-field electronic specific heat of the two samples. As shown in Fig. 3(a), a hump-like behavior below 2 K is observed in sample A, which is typical of multi-gap superconductors like MgB2 and Lu2Fe3Si5 Bouquet et al. (2002); *NakajimaRuFeSitwogapPhysRevLett.100.157001. However, such hump-like behavior is strongly suppressed in sample B, which can be seen more clearly in the enlarged low part in the inset. A similar result has recently been reported in Ref. Rößler et al. (2018). Both hump-like and linear behavior have been observed in previous reports Lin et al. (2011, 2017); Sun et al. (2017a); Rößler et al. (2018); Hardy et al. (2018). Our results here directly prove that such controversy originates from the sample-dependent disorder. Besides, the large divergence in at low between the two samples indicates the differences in their gap structure.
More information about the gap structure can be obtained from the magnetic field dependence of the specific heat, vs , which reflects QP excitations across the SC gap. Changes in the specific heat, / ( = () - (0 T)), of the two samples at 0.6 K for and are shown in Figs. 3(b) and (c), respectively. For sample A, / first increases rapidly with the same slope for both and up to 1 mJ/molK2, which indicates the presence of a small gap with little out-of-plane anisotropy in the small gap. As further increases, / changes with different slopes for and . The even changes slopes twice indicating the multigap-structure, which has been discussed in detail in our previous report Sun et al. (2017a). On the other hand, the slope of / is almost constant at higher fields, but with different values depending on the field direction in sample B, which indicates that the larger gap has an appreciable anisotropy. The initial steeper increase of / at low fields also depends on the field direction, which indicates that the smaller gap is also anisotropic. Similar behavior of vs to that in sample B has also been reported in previous publications Lin et al. (2011); Sato et al. (2017). The large differences in temperature and magnetic field dependences of specific heat of the two samples suggest that the superconducting gap structure is very sensitive to the disorder although the band structure and nematic state are little affected.
To resolve the differences in gap structures of the two samples, we turn to the measurements of the specific heat under magnetic field with angle resolution. Due to the Doppler shift, ( is the electron mass, is the Fermi velocity, and is the local superfluid velocity perpendicular to the field) Volovik (1993), the zero-energy DOS in the vortex core in superconductors with nodes (or minima) depends on the direction of the field with respect to the nodal position. When node, it shows minima because in the case of , while, it turns to maxima when node because becomes maximal in the situation of . Therefore, the specific heat shows symmetric oscillation under the rotating magnetic field. By contrast, for superconductors with isotropic gap, the specific heat should be independent of the field direction.
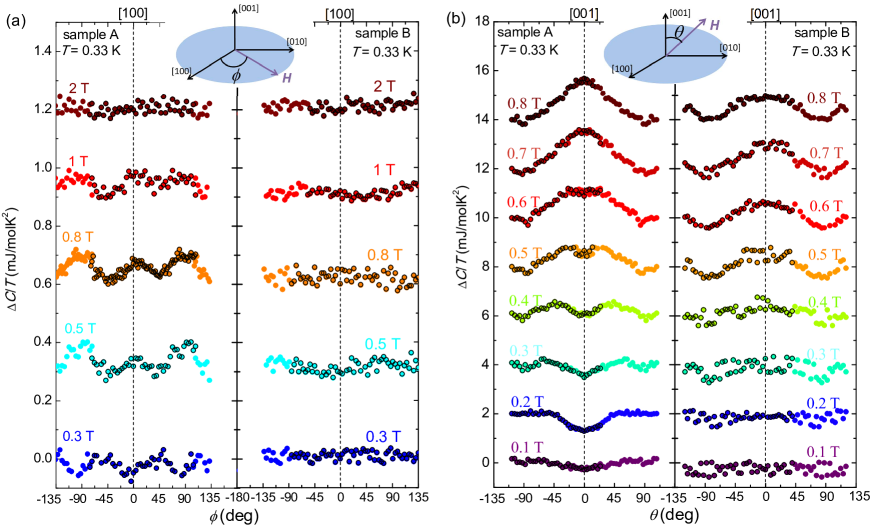
Figure 4(a) compares the azimuthal angle-resolved at 0.33 K for samples A (left panel) and B (right panel). For sample A, manifests an obvious four-fold symmetry. Below 0.5 T, shows minima for and ( and ) and maxima for the (). At 0.5 T, becomes maxima for the and , but minima for the . Such sign-change behavior in the oscillation is due to the strong enhancement of QP scattering under relatively large magnetic field. In this case, a much higher finite-energy DOS around the nodal position will be excited for nodes. When the finite-energy DOS overcomes the zero-energy DOS, the oscillation switches signs Vorontsov and Vekhter (2006); Hiragi et al. (2010). Such a sign change is commonly observed in superconductors with nodes An et al. (2010); Kittaka et al. (2016) or gap minima Kittaka et al. (2013). Thus, the four-fold symmetric observed in sample A demonstrates the existence of nodes or gap minima. On the other hand, the for sample B shows no oscillation, which indicates that the gap is almost isotropic in the measured temperature and field range.
The difference in gap structure can be witnessed in the polar-angle dependence of the specific heat as shown in Fig. 4(b). For sample A, first shows minima in the [001] direction () with two shoulders under small fields. With increasing field, the minima gradually increase, and the two shoulders move towards the [001] direction. Finally, the minima at [001] turn to maxima at 0.8 T. The anisotropy-inverted can also be explained by the competition between the zero-energy and finite-energy DOSs based on the Doppler shift. In the case of vertical-line nodes (or gap minima), in the small-field region because of Fermi-surface warping along -direction. At higher fields, the scattering of QPs is largely enhanced for nodal (or gap minima) lines, making . Considering the existence of twin boundaries in the orthorhombic phase of FeSe, the oscillations observed in the azimuthal and polar angle-resolved specific heat results in sample A have been proved to originate from a small gap ( 0.39 meV) with two vertical-line nodes or gap minima along the direction Sun et al. (2017a) (Schematic gap structure is shown in Fig. 3(d) of Ref. Sun et al. (2017a)). The existence of a very small gap has also been reported in other specific heat Lin et al. (2011, 2017) or thermal conductivity measurements of QPs Bourgeois-Hope et al. (2016). On the other hand, of sample B only shows a two-fold symmetry without shape change, which simply reflects the out-of-plane anisotropy of . It again confirms the almost in-plane isotropic gap structure at low temperatures in sample B.
The above comparison of the 3D ARSH for the two samples clearly proves that the nodes or gap minima in the small gap of sample A has been smeared and turns to be almost isotropic in sample B. Although the amount of disorders is too small to affect the band structure and nematic order, it dramatically changes the gap structure. It is due to the symmetry-unprotected nature of the nodes (or gap minima) as well as the small size of the gap ( 0.39 meV), which are sensitive to disorder. Therefore, the reported controversy on the gap structure of FeSe by different groups on different samples now can be understood by the presence of disorder-sensitive node-like small gap. In the clean sample similar to the sample A, the node-like small gap will contribute more QPs at low temperatures under small field, which causes the larger value of (inset of Fig. 3(a)) and the faster increase in vs (Fig. 3(b)). On the other hand, in a slightly dirtier sample like the sample B, the nodes or gap minima in the small gap will be suppressed by averaging of gap values due to disorder. It will make the excitations of QPs at low temperatures and/or low fields more difficult, leading to the suppression of the value of and reduction of the field-induced change in . Together with the smearing of the nodes or gap minima, size of the gap should be also reduced, which is supported by the slightly lower in sample B. The above discussion is also consistent with the report on the H+-irradiation effect in FeSe Sun et al. (2017b). Since the size of the node-like gap is very small, we cannot exclude the extreme possibility that it has been totally suppressed in sample B. Considering the small gap may come from a tiny band, it could not be observed in ARPES measurement because of the limit of resolution. On the other hand, the anisotropic larger gap in FeSe as reported by the STM Sprau et al. (2016) is hard to be smeared by such a small amount of disorder. Thus, the whole gap structure of sample B is still anisotropic, and only the small gap becomes isotropic.
In summary, we systematically studied the structure, composition, superconductivity, transport, band structure, nematic order, and the gap structure of two selected FeSe single crystals containing different amounts of disorder. Small amount of disorder has been proved to affect little the band structure, and the nematic order. However, the temperature and magnetic field dependences of specific heat of the two samples have been found to be quite different. 3D ARSH measurements demonstrate the presence of a small gap with two vertical-line nodes or gap minima along the direction in the sample with higher quality. Such symmetry-unprotected nodes or gap minima are smeared by disorder and the gap becomes almost isotropic in the sample with lower quality. Our study clearly reveals that the reported controversy on the gap structure of FeSe is due to the presence of the disorder-sensitive node-like small gap.
T. N. is supported by RIKEN Special Postdoctoral Researchers Program. The present work was supported by a Grant-in-Aid for Scientific Research on Innovative Areas “J-Physics” (15H05883) from MEXT, and KAKENHI (17K05553, 15K05158, and 17H01141) from JSPS.
References
- Hsu et al. (2008) F. C. Hsu, J. Y. Luo, K. W. Yeh, T. K. Chen, T. W. Huang, P. M. Wu, Y. C. Lee, Y.-L. Huang, Y.-Y. Chu, D. C. Yan, and M. K. Wu, Proc. Nat. Acad. Sci. 105, 14262 (2008).
- McQueen et al. (2009) T. M. McQueen, A. J. Williams, P. W. Stephens, J. Tao, Y. Zhu, V. Ksenofontov, F. Casper, C. Felser, and R. J. Cava, Phys. Rev. Lett. 103, 057002 (2009).
- Kasahara et al. (2014) S. Kasahara, T. Watashige, T. Hanaguri, Y. Kohsaka, T. Yamashita, Y. Shimoyama, Y. Mizukami, R. Endo, H. Ikeda, K. Aoyama, T. Terashima, S. Uji, T. Wolf, H. von Löhneysen, T. Shibauchi, and Y. Matsuda, Proc. Nat. Acad. Sci. 111, 16309 (2014).
- Zhang et al. (2016) Y. Zhang, M. Yi, Z. K. Liu, W. Li, J. J. Lee, R. G. Moore, M. Hashimoto, M. Nakajima, H. Eisaki, S. K. Mo, Z. Hussain, T. P. Devereaux, Z. X. Shen, and D. H. Lu, Phys. Rev. B 94, 115153 (2016).
- Onari et al. (2016) S. Onari, Y. Yamakawa, and H. Kontani, Phys. Rev. Lett. 116, 227001 (2016).
- Sun et al. (2016) Y. Sun, S. Pyon, and T. Tamegai, Phys. Rev. B 93, 104502 (2016).
- Wang et al. (2012) Q. Y. Wang, Z. Li, W. H. Zhang, Z. C. Zhang, J. S. Zhang, W. Li, H. Ding, Y. B. Ou, P. Deng, K. Chang, J. Wen, C. L. Song, K. He, J. F. Jia, S. H. Ji, Y. Y. Wang, L. L. Wang, X. Chen, X. C. Ma, and Q. K. Xue, Chin. Phys. Lett. 29, 037402 (2012).
- Ge et al. (2015) J. F. Ge, Z. L. Liu, C. Liu, C. L. Gao, D. Qian, Q. K. Xue, Y. Liu, and J. F. Jia, Nat. Mater. 14, 285 (2015).
- Song et al. (2011) C.-L. Song, Y.-L. Wang, P. Cheng, Y.-P. Jiang, W. Li, T. Zhang, Z. Li, K. He, L. Wang, J.-F. Jia, H.-H. Hung, C. Wu, X. Ma, X. Chen, and Q.-K. Xue, Science 332, 1410 (2011).
- Lin et al. (2011) J. Y. Lin, Y. S. Hsieh, D. A. Chareev, A. N. Vasiliev, Y. Parsons, and H. D. Yang, Phys. Rev. B 84, 220507 (2011).
- Lin et al. (2017) J. Lin, C. Huang, S. Rößler, C. Koz, U. K. Rößler, U. Schwarz, and S. Wirth, Sci. Rep. 7, 44024 (2017).
- Bourgeois-Hope et al. (2016) P. Bourgeois-Hope, S. Chi, D. A. Bonn, R. Liang, W. N. Hardy, T. Wolf, C. Meingast, N. Doiron-Leyraud, and L. Taillefer, Phys. Rev. Lett. 117, 097003 (2016).
- Abdel-Hafiez et al. (2013) M. Abdel-Hafiez, J. Ge, A. N. Vasiliev, D. A. Chareev, J. Van de Vondel, V. V. Moshchalkov, and A. V. Silhanek, Phys. Rev. B 88, 174512 (2013).
- Sprau et al. (2016) P. O. Sprau, A. Kostin, A. Kreisel, A. E. Böhmer, V. Taufour, P. C. Canfield, S. Mukherjee, P. J. Hirschfeld, B. M. Andersen, and J. C. S. Davis, Science 357, 75 (2016).
- Dong et al. (2009) J. K. Dong, T. Y. Guan, S. Y. Zhou, X. Qiu, L. Ding, C. Zhang, U. Patel, Z. L. Xiao, and S. Y. Li, Phys. Rev. B 80, 024518 (2009).
- Sun et al. (2017a) Y. Sun, S. Kittaka, S. Nakamura, T. Sakakibara, K. Irie, T. Nomoto, K. Machida, J. Chen, and T. Tamegai, Phys. Rev. B 96, 220505 (2017a).
- Chen et al. (2017) G.-Y. Chen, X. Zhu, H. Yang, and H.-H. Wen, Phys. Rev. B 96, 064524 (2017).
- Kreisel et al. (2015) A. Kreisel, S. Mukherjee, P. J. Hirschfeld, and B. M. Andersen, Phys. Rev. B 92, 224515 (2015).
- Böhmer et al. (2016) A. E. Böhmer, V. Taufour, W. E. Straszheim, T. Wolf, and P. C. Canfield, Phys. Rev. B 94, 024526 (2016).
- Rößler et al. (2018) S. Rößler, C.-L. Huang, L. Jiao, C. Koz, U. Schwarz, and S. Wirth, Phys. Rev. B 97, 094503 (2018).
- Teknowijoyo et al. (2016) S. Teknowijoyo, K. Cho, M. A. Tanatar, J. Gonzales, A. E. Böhmer, O. Cavani, V. Mishra, P. J. Hirschfeld, S. L. Bud’ko, P. C. Canfield, and R. Prozorov, Phys. Rev. B 94, 064521 (2016).
- Sun et al. (2017b) Y. Sun, A. Park, S. Pyon, T. Tamegai, and H. Kitamura, Phys. Rev. B 96, 140505 (2017b).
- Sun et al. (2017c) Y. Sun, A. Park, S. Pyon, T. Tamegai, T. Kambara, and A. Ichinose, Phys. Rev. B 95, 104514 (2017c).
- Sakakibara et al. (2016) T. Sakakibara, S. Kittaka, and K. Machida, Rep. Prog. Phys. 79, 094002 (2016).
- Sun et al. (2015) Y. Sun, S. Pyon, T. Tamegai, R. Kobayashi, T. Watashige, S. Kasahara, Y. Matsuda, and T. Shibauchi, Phys. Rev. B 92, 144509 (2015).
- Nakayama et al. (2014) K. Nakayama, Y. Miyata, G. N. Phan, T. Sato, Y. Tanabe, T. Urata, K. Tanigaki, and T. Takahashi, Phys. Rev. Lett. 113, 237001 (2014).
- Watson et al. (2015) M. D. Watson, T. K. Kim, A. A. Haghighirad, S. F. Blake, N. R. Davies, M. Hoesch, T. Wolf, and A. I. Coldea, Phys. Rev. B 92, 121108 (2015).
- Watson et al. (2016) M. D. Watson, T. K. Kim, L. C. Rhodes, M. Eschrig, M. Hoesch, A. A. Haghighirad, and A. I. Coldea, Phys. Rev. B 94, 201107 (2016).
- Coldea and Watson (2018) A. I. Coldea and M. D. Watson, Annu. Rev. Condens. Matter Phys. 9, 125 (2018).
- Fedorov et al. (2016) A. Fedorov, A. Yaresko, T. K. Kim, Y. Kushnirenko, E. Haubold, T. Wolf, M. Hoesch, A. Grüneis, B. Büchner, and S. V. Borisenko, Sci. Rep. 6, 36834 (2016).
- Jiao et al. (2017) L. Jiao, S. Rößler, C. Koz, U. Schwarz, D. Kasinathan, U. K. Rößler, and S. Wirth, Phys. Rev. B 96, 094504 (2017).
- Hashimoto et al. (2018) T. Hashimoto, Y. Ota, H. Q. Yamamoto, Y. Suzuki, T. Shimojima, S. Watanabe, C. Chen, S. Kasahara, Y. Matsuda, T. Shibauchi, K. Okazaki, and S. Shin, Nat. Commun. 9, 282 (2018).
- Bouquet et al. (2002) F. Bouquet, Y. Wang, I. Sheikin, T. Plackowski, A. Junod, S. Lee, and S. Tajima, Phys. Rev. Lett. 89, 257001 (2002).
- Nakajima et al. (2008) Y. Nakajima, T. Nakagawa, T. Tamegai, and H. Harima, Phys. Rev. Lett. 100, 157001 (2008).
- Hardy et al. (2018) F. Hardy, M. He, L. Wang, T. Wolf, P. Schweiss, M. Merz, M. Barth, P. Adelmann, R. Eder, A.-A. Haghighirad, and C. Meingast, arXiv:1807.07907 (2018).
- Sato et al. (2017) Y. Sato, S. Kasahara, T. Taniguchi, X. Xing, Y. Kasahara, Y. Tokiwa, Y. Yamakawa, H. Kontani, T. Shibauchi, and Y. Matsuda, arXiv:1705.09074 (2017).
- Volovik (1993) G. E. Volovik, JETP Lett. 58, 469 (1993).
- Vorontsov and Vekhter (2006) A. Vorontsov and I. Vekhter, Phys. Rev. Lett. 96, 237001 (2006).
- Hiragi et al. (2010) M. Hiragi, K. M. Suzuki, M. Ichioka, and K. Machida, J. Phys. Soc. Jpn. 79, 094709 (2010).
- An et al. (2010) K. An, T. Sakakibara, R. Settai, Y. Onuki, M. Hiragi, M. Ichioka, and K. Machida, Phys. Rev. Lett. 104, 037002 (2010).
- Kittaka et al. (2016) S. Kittaka, Y. Shimizu, T. Sakakibara, Y. Haga, E. Yamamoto, Y. Ōnuki, Y. Tsutsumi, T. Nomoto, H. Ikeda, and K. Machida, J. Phys. Soc. Jpn. 85, 033704 (2016).
- Kittaka et al. (2013) S. Kittaka, T. Sakakibara, M. Hedo, Y. Ōnuki, and K. Machida, J. Phys. Soc. Jpn. 82, 123706 (2013).