Insight-HXMT observations of the New Black Hole Candidate MAXI J1535-571: timing analysis
Abstract
We present the X-ray timing results of the new black hole candidate (BHC) MAXI J1535-571 during its 2017 outburst from Hard X-ray Modulation Telescope (Insight-HXMT) observations taken from 2017 September 6 to 23. Following the definitions given by Belloni (2010), we find that the source exhibits state transitions from Low/Hard state (LHS) to Hard Intermediate state (HIMS) and eventually to Soft Intermediate state (SIMS). Quasi-periodic oscillations (QPOs) are found in the intermediate states, which suggest different types of QPOs. With the large effective area of Insight-HXMT at high energies, we are able to present the energy dependence of the QPO amplitude and centroid frequency up to 100 keV which is rarely explored by previous satellites. We also find that the phase lag at the type-C QPOs centroid frequency is negative (soft lags) and strongly correlated with the centroid frequency. By assuming a geometrical origin of type-C QPOs, the source is consistent with being a high inclination system.
Subject headings:
starts: individual (MAXI J1535-571) — X-rays: binaries — black hole physics1. Introduction
Black hole transients (BHTs) spend most of their lives in quiescence, and are detected during outbursts in which their spectral and timing properties change with time. During a typical outburst, they go through the low hard state (LHS), the hard and soft intermediate states (HIMS, SIMS), high soft state (HSS), then again through the intermediate states and back to the LHS, following the classification given in Belloni (2010, and see Remillard and McClintock 2006 for an alternative classification, and Motta et al. 2009 for a comparison). In the LHS, the X-ray spectrum can be approximately described by a power-law with a spectral index of 1.6 (2-20 keV band), and an exponential cutoff at 100 keV. This hard X-ray emission is thought to arise from the Comptonization of soft disk photons in a hot corona. The corresponding power density spectrum (PDS) shows strong (30% rms) band-limited noise, and sometimes low-frequency quasi-periodic oscillations (LFQPOs). While the X-ray spectrum in the HSS is dominated by a soft thermal component, modeled with a multi-temperature disk-blackbody with a typical temperature of 1 keV at inner disk radius, its PDS shows weak (down to few percent fractional rms) power-law noise.
Compared to the two main states, which show consistent behaviors, other states are complex and more difficult to classify and to interpret; both disk and power-law components are clearly present in the energy spectra, and the main feature of PDS is LFQPOs with centroid frequency ranging from a few mHz to 30 Hz. Several types of LFQPOs have been identified and classified into type A, B, C (Remillard et al., 2002; Casella et al., 2005). The study of LFQPOs is essential to our understanding of the accretion flow around black holes, though their origin is still in debate. One of the promising models for type-C QPO is that the oscillations are produced by the Lense-Thirring precession of the inner accretion flow (Ingram et al., 2009). Evidence in support of such scenario is inferred from the modulation of the reflected iron line equivalent width (Ingram and van der Klis, 2015) and the centroid energy (Ingram et al., 2016) during a QPO cycle by using phase-resolved spectroscopy of type-C QPO, the inclination dependence of QPO phase lags (van den Eijnden et al., 2017) and absolute variability amplitude (Motta et al., 2015). In addition, it is also important to consider the energy dependence of the QPO properties, such as fractional rms, centroid frequency and time-lag (Tomsick and Kaaret, 2001; Rodriguez et al., 2004; Qu et al., 2010; Yadav et al., 2016). It can bridge over the energy spectra and the timing variability.
The new X-ray transient, MAXI J1535-571, was independently discovered by MAXI/GSC (Negoro et al., 2017a)and Swift/BAT (Barthelmy et al., 2017; Kennea et al., 2017) on September 02, 2017 (MJD 57998). The radio (Russell et al., 2017), sub-millimetres (Dincer, 2017), near-infrared (Dincer, 2017) and optical (Scaringi and ASTR211 Students, 2017) counterparts were detected soon after the discovery of the source. MAXI/GSC and the ATCA follow-up observations indicate the source as a BHC, judging from its X-ray spectral shape and rapid X-ray variability (Negoro et al., 2017b), as well as the radio versus X-ray luminosity ratio (Russell et al., 2017). Later MAXI/GSC and Swift observation suggested that the source was undergoing a hard-to-soft state transition (Nakahira et al., 2017; Kennea, 2017; Palmer et al., 2017; Tao et al., 2017). LFQPOs have been detected by Swift/XRT and NICER (Mereminskiy and Grebenev, 2017; Gendreau et al., 2017). Using NICER data, Miller et al. (2018) analyzed the spectrum of MAXI J1535-571 observed on September 13. Their results gave a spin of , and a inclination angle of ∘. Xu et al. (2018) performed spectral fits of NuSTAR observation using a relativistic reflection models, and estimate a black hole spin and a high inclination angle: ∘ and ∘.
In this paper, we study the temporal variation of the source using Insight-HXMT observations. In Section 2, we describe Insight-HXMT observations and data reductions methods. The results are presented in Section 3. Discussions and Conclusions follow in Section 4 and 5.
2. Observations and Data Analysis
Following MAXI/GSC and Swift/BAT discovery of MAXI J1535-571, we triggered Insight-HXMT Target of Opportunity (ToO) observations. Our follow-up observations started on September 6, 2017 and ended on September 23, 2017, when the source was unobservable due to the Sun constraint of the satellite. During this period, the detectors were switched off from September 07 to 12 due to the X9.3 Solar flare 111https://www.solarmonitor.org/goes_pop.php?date=20170906&type=xray. Our sample contains 31 pointed observations, with each observation covering several satellite orbits. The observation log is shown in Table 1.
| ObsIDaa105: P011453500NNN, NNN=105 | Start Date | MJD | obs time | HE rate | ME rate | LE rate | StatebbFollows definitions in Belloni (2010). |
|---|---|---|---|---|---|---|---|
| (ks) | (cts s-1) | (cts s-1) | (cts s-1) | ||||
| ( keV) | ( keV) | ( keV) | |||||
| 105 | 2017-09-06 | 58002.317 | 13 | -ccHE detector was operated in the GRB mode, where the high voltage of PMT was reduced. | LHS | ||
| 106 | 58002.469 | 11 | -ccHE detector was operated in the GRB mode, where the high voltage of PMT was reduced. | LHS | |||
| 107 | 58002.601 | 11 | -ccHE detector was operated in the GRB mode, where the high voltage of PMT was reduced. | LHS | |||
| 108 | 58002.734 | 11 | LHS | ||||
| 119 | 2017-09-12 | 58008.443 | 12 | HIMS | |||
| 120 | 58008.583 | 38 | HIMS | ||||
| 121 | 2017-09-13 | 58009.029 | 10 | -ddLE detector was saturated through this observation. | HIMS | ||
| 122 | 58009.156 | 17 | -ddLE detector was saturated through this observation. | HIMS | |||
| 201 | 2017-09-14 | 58010.205 | 11 | -ddLE detector was saturated through this observation. | HIMS | ||
| 301 | 2017-09-15 | 58011.200 | 11 | HIMS | |||
| 401 | 2017-09-16 | 58012.260 | 11 | HIMS | |||
| 501 | 2017-09-17 | 58013.255 | 11 | HIMS | |||
| 601 | 2017-09-18 | 58014.117 | 11 | HIMS | |||
| 701 | 2017-09-19 | 58015.974 | 12 | SIMS | |||
| 902 | 2017-09-21 | 58017.250 | 12 | SIMS | |||
| 903 | 58017.389 | 12 | SIMS | ||||
| 904 | 58017.529 | 32 | SIMS | ||||
| 905 | 58017.902 | 11 | SIMS | ||||
| 906 | 2017-09-22 | 58018.032 | 12 | SIMS | |||
| 907 | 58018.173 | 12 | SIMS | ||||
| 908 | 58018.314 | 12 | SIMS | ||||
| 909 | 58018.453 | 32 | SIMS | ||||
| 910 | 58018.832 | 10 | SIMS | ||||
| 911 | 58018.958 | 11 | SIMS | ||||
| 912 | 2017-09-23 | 58019.093 | 12 | SIMS | |||
| 913 | 58019.238 | 12 | SIMS | ||||
| 914 | 58019.377 | 12 | SIMS | ||||
| 915 | 58019.517 | 12 | SIMS | ||||
| 916 | 58019.657 | 11 | SIMS | ||||
| 917 | 58019.789 | 11 | SIMS | ||||
| 918 | 58019.921 | 9 | SIMS |
The Hard X-ray Modulation Telescope (HXMT, also dubbed as Insight-HXMT)(Zhang et al., 2014), the first Chinese X-ray astronomical satellite, consists of three slat-collimated instruments: the High Energy X-ray Telescope (HE), the Medium Energy X-ray Telescope (ME), and the Low Energy X-ray Telescope (LE). HE contains 18 cylindrical NaI(Tl)/CsI(Na) phoswich detectors which are sensitive in the 20-250 keV with a total detection area of about 5000 cm2; ME is composed of 1728 Si-PIN detectors which are sensitive in the 5-30 keV with a total detection area of 952 cm2; and LE uses Swept Charge Device (SCD) which is sensitive in 1-15 keV range with a total detection area of 384 cm2. There are three types of Field of View (FoV) : (FWHM,full-width half-maximum) (also called the small FoV), (the large FoV), and the blind FoV used to estimate the particle induced instrumental background. Since its launch, Insight-HXMT went through a series of performance verification tests by observing blank sky, standard sources and sources of interest. These tests showed that the entire satellite works smoothly and healthily, and have allowed for the calibration and estimation of the instruments background.
We use the Insight-HXMT Data Analysis software (HXMTDAS) v2.0222http://www.hxmt.org/index.php/dataan to analyze all the data, filtering the data with the following criteria: (1) pointing offset angle ; (2) elevation angle ; (3) the value of the geomagnetic cutoff rigidity . We only select events that belong to the small FoV. Since LE detector can be saturated due to the bright earth and local particles, we need to create the good time intervals (GTIs) manually. For some observations there is no GTI for LE detector. Since the detailed background model is still in progress, we use the blind FoV detectors to estimate the Insight-HXMT background, with a systematic error of . We derive the background as , where is the background counts rate of the small FoV in a given energy band, is the ratio of number of the small FoV detectors to that of the blind FoV detectors, and stands for the blind FoV detectors count rate in the same energy band as . Using blank sky observations, we tested the reliability of this method.
To study the variability, we produce the PDS from 64s data intervals with time resolution of 1/128s for each observation; in a few cases, an inspection of the PDS show significant variations in the QPO frequency between different orbits, which were therefore split. The PDS is applied Miyamoto normalisation (Miyamoto et al., 1991) after subtracting the Possion noise. PDS is fitted with a combination of Lorentzians (Nowak, 2000; Belloni et al., 2002) using the XSPEC v12.9.1 between 0.01 Hz and 32 Hz. The best-fit reduced values are less than 1.5 (for a degree-of-freedom of 138 ), with a typical value of 1.2. We estimate the total fractional variability (rms of PDS) in the range of 0.1 to 32 Hz.
We also produce 16s cross spectrum between the 1-3 keV and 3-7 keV light curves of Insight-HXMT/LE (defined as , where and are the complex Fourier coefficients for the two energy bands at a frequency and is the complex conjugate of ), and calculate average cross spectrum vectors for each observation. The phase lag at frequency is . The error in is computed from the observed variance of in the real and imaginary directions. For phase lag spectra, positive lag values mean that the hard photons are lagging the soft ones. To quantify the phase-lag behaviour of the QPOs, we compute their phase lags in a range centered at the QPO centroid frequency and spread over the width of the QPO (Reig et al., 2000).
No application of dead time correction is given in the PDS and the cross spectrum, since dead time should not be an issue in our analysis. In Insight-HXMT, dead time () is around 20 us for HE and LE; 250 us for ME, thus the frequency range commonly analyzed in BHC is well below .
3. Results
3.1. Fundamental diagrams

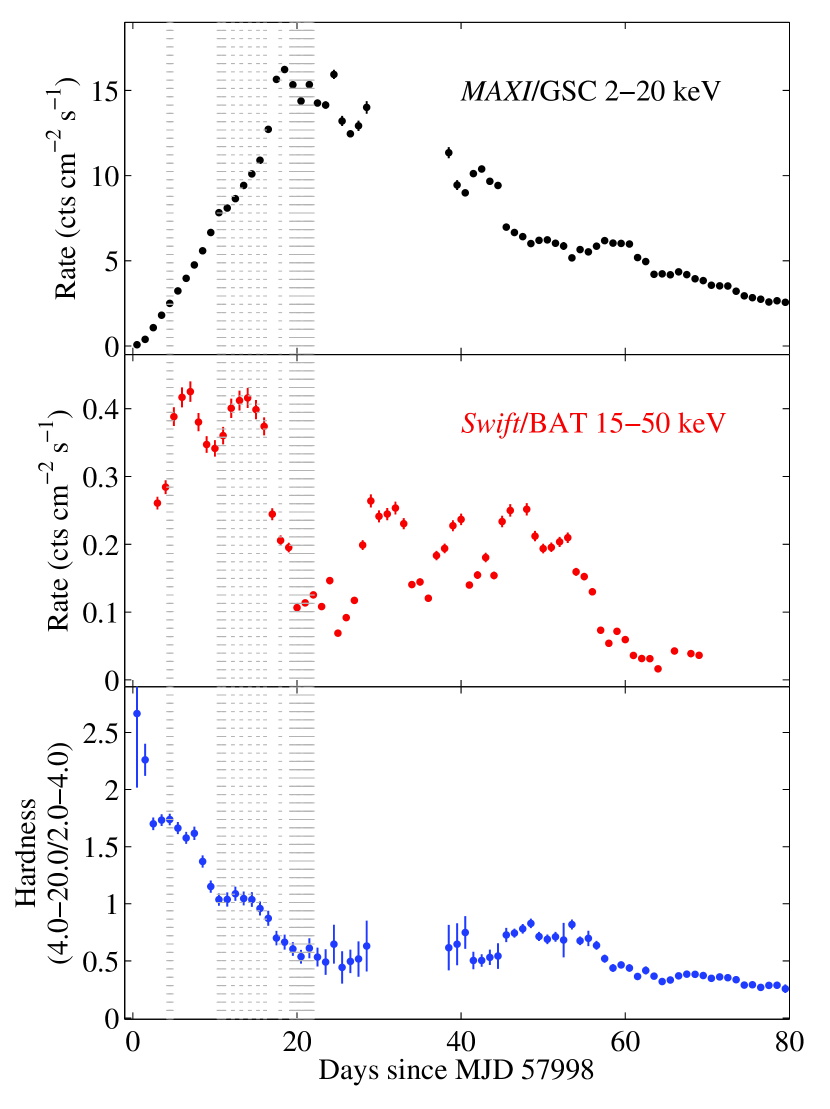
We plot the diagrams commonly used for the study of BHT in Figs.1 and 2. To make a comparison, we also show the MAXI/GSC333http://maxi.riken.jp/star_data/J1535-572/J1535-572.html and Swift/BAT444https://swift.gsfc.nasa.gov/results/transients/weak/MAXIJ1535-571/ results taken from the web sites for each instrument.
The background-subtracted and dead time corrected Insight-HXMT light curves and hardness of MAXI J1535-571 are shown in Fig.1 (left panel). The LE count rate (1-12 keV) slowly rose from the beginning, reached its peak of 3212 cts s-1 on MJD 58015, and then stayed stable at that level. The ME count rate (6-38 keV) increased from 355 cts s-1 on MJD 58002 to 820 cts s-1 on MJD 58014, and decreased abruptly to 522 cts s-1 on MJD 58015, followed by several rises and falls. The HE count rate (26-100 keV) showed a decrease in the early phase, then is similar to the ME. The hardness defined as the count rate in the 3-12 keV energy band divided by the count rate in the 1-3 keV energy band. We found that the hardness remained the same (2.1) in the first several exposures around MJD 58002, but suddenly decreased to 1.5 on MJD 58008, and then slowly decreased to a low level. The trend of light curves and hardness observed by Insight-HXMT, MAXI/GSC and Swift/BAT are consistent with each other.
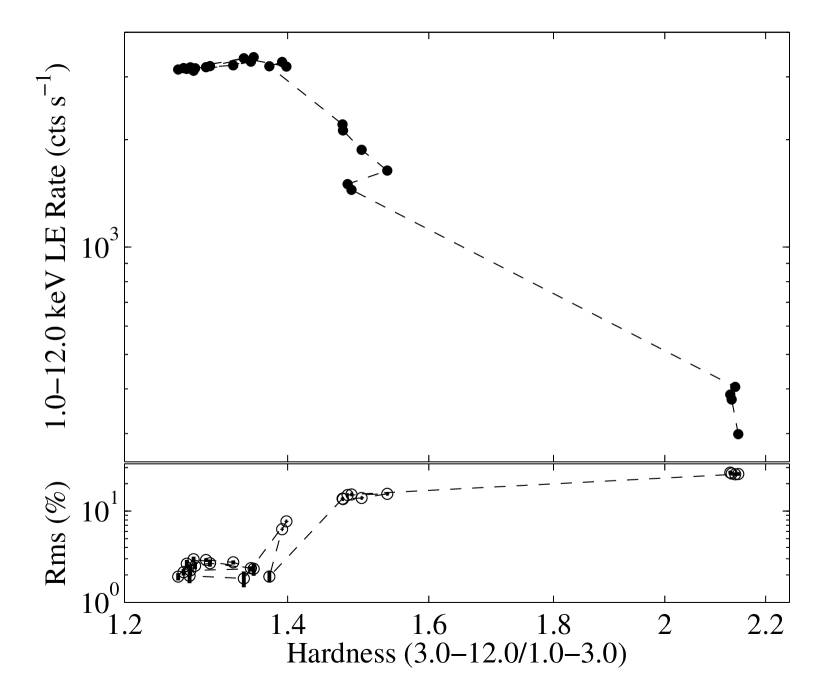
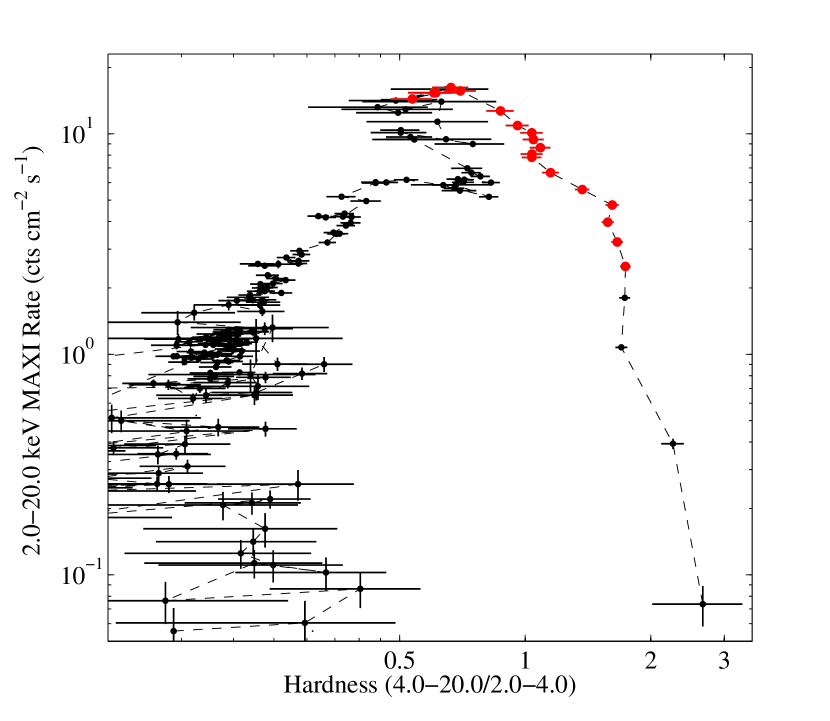
The hardness-intensity diagram (HID) and the hardness-rms diagram (HRD) are shown in the left panel of Fig.2. Because only the rising part of the outburst was observed by the Insight-HXMT, the source exhibited part of the standard q-shaped pattern. A relatively complete pattern is described by MAXI data in the right panel, with Insight-HXMT observations marked with red points. The outburst starts at the lower right of the figure, corresponding to the LHS, where the fractional rms remains at 26%. When the intensity increases, the source on the HID starts moving to the upper left, and the fractional rms drops to 15% on MJD 58008. In the corresponding PDS, strong type-C QPOs are detected (see §3.2), indicating that the system is in the HIMS. It is not possible to decide the precise transition position from the Insight-HXMT observations, as the instruments were switched off during that period. After several days in the HIMS, the fractional rms suddenly decreases to 1.9% on MJD 58015, and type-B QPOs (see §3.2) are seen in the PDS, indicating the system is in the SIMS. Then, the source moved irregularly in the HID but remained in the upper left. The fractional rms increases to 7.7%, then decreases to 2%.
3.2. Power Density Spectra
Fig.3-6 show results of the PDS. In Table 2, we present a summary of the results on LFQPO parameters, i.e., the centroid frequency (), the coherence parameter and the rms of the QPOs, is the FWHM of the QPO.
| ObsIDaa105: P011453500NNN, NNN=105 | Type | QPO bbQPO centroid frequency, Q and amplitude were computed from ME detector in energy band 6-38 keV. | QbbQPO centroid frequency, Q and amplitude were computed from ME detector in energy band 6-38 keV. | rmsbbQPO centroid frequency, Q and amplitude were computed from ME detector in energy band 6-38 keV. |
|---|---|---|---|---|
| (Hz) | (%) | |||
| 119 | C | |||
| 120 | C | |||
| 121 | C | |||
| 122 | C | |||
| 201 | C | |||
| 301 | C | |||
| 401 | C | |||
| 501 | C | |||
| 601 | C | |||
| 701 | B | |||
| 902 | C | |||
| 903_a | C | |||
| 903_b | C | |||
| 904_a | C | |||
| 904_b | A | |||
| 904_c | A | |||
| 905 | A | |||
| 906 | A | |||
| 907 | A | |||
| 908 | A | |||
| 909 | A | |||
| 910 | A | |||
| 911 | A | |||
| 912 | A | |||
| 913 | A | |||
| 914 | A | |||
| 915 | A | |||
| 916 | A | |||
| 917 | A | |||
| 918 | A |
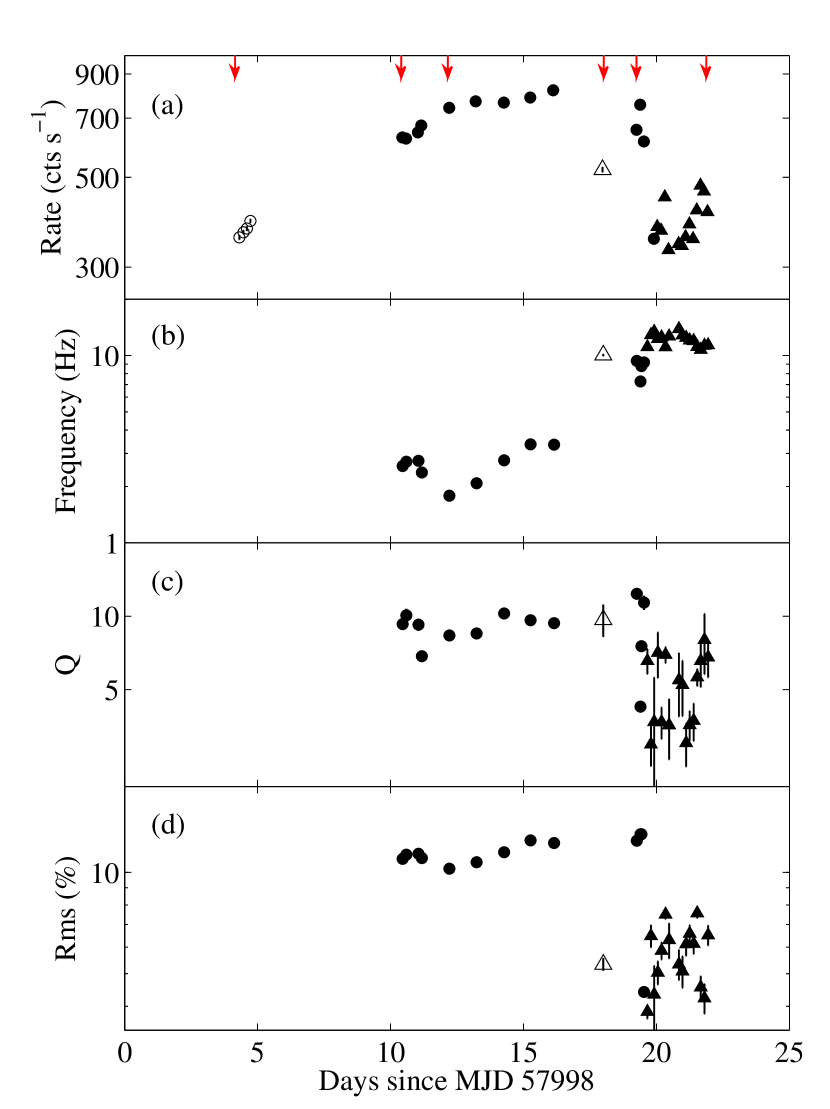
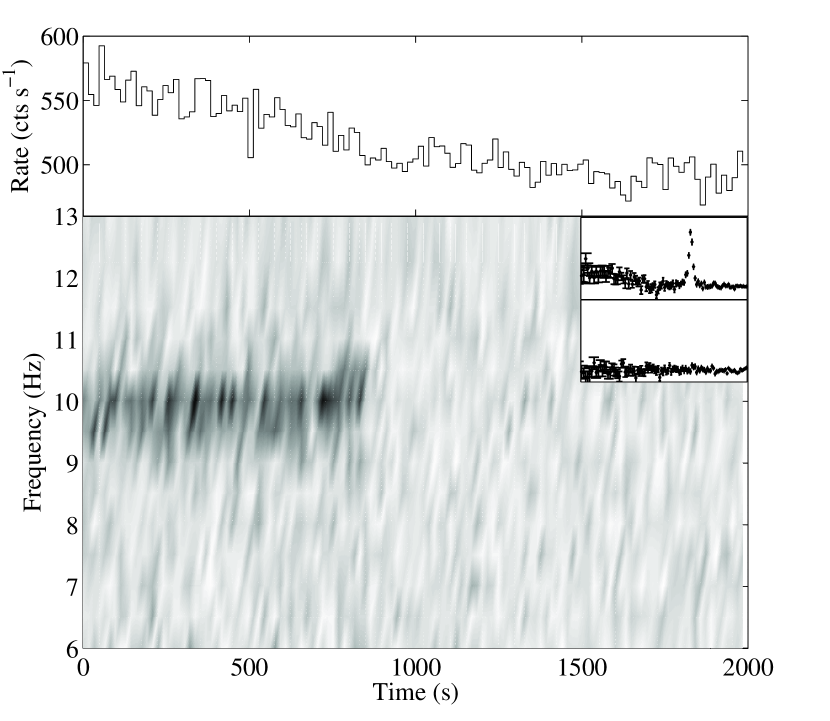
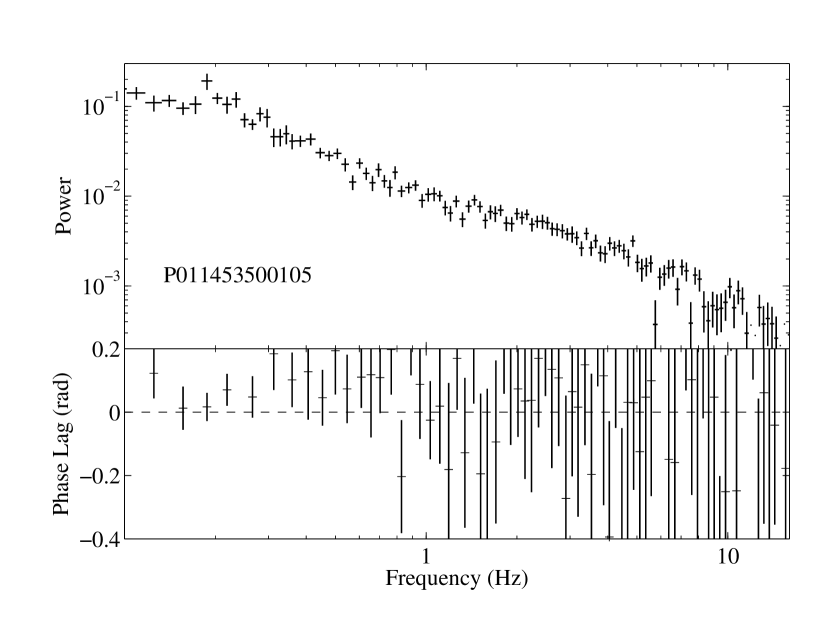
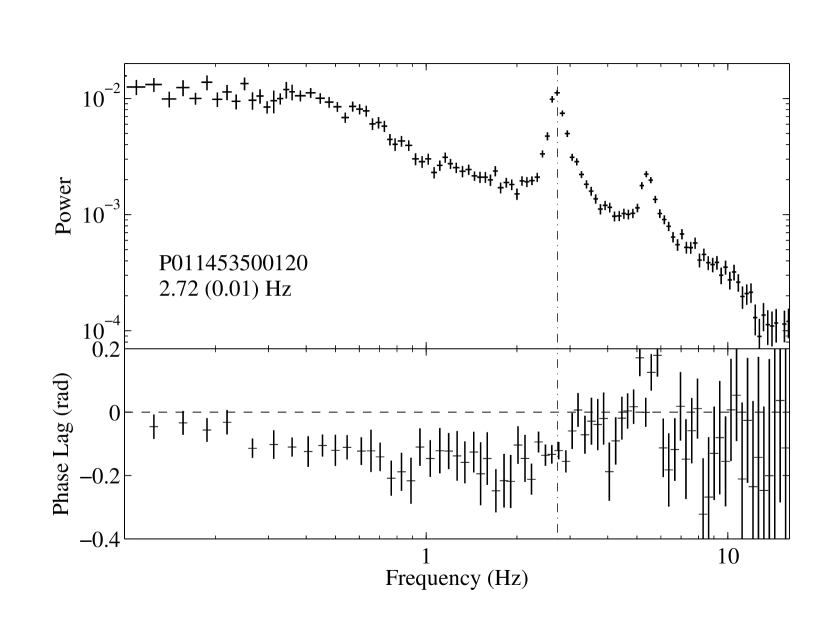
Fig.3 shows the QPO evolution with time. In Fig.4, we show 6 representative PDS of Insight-HXMT/ME whose corresponding positions are indicated by red arrows in Fig.3. At the beginning of the outburst (the first four exposures), the PDS shown in Fig.4(a) is very similar to that observed in other black holes during their typical LHSs (Belloni, 2010), and can be fitted with two broad Lorentzian components. Later (from MJD 58008 to MJD 58014, Fig.4(b)(c)), the PDS show a strong type-C QPOs, sometimes with its second harmonic, and the centroid frequency of QPO decreased from 2.5 to 1.7 Hz and then increased to 3.3 Hz. During the ME count rate decline on MJD 58015(see Fig.1), we detect a Hz QPO with a rather low rms amplitude (5.3%) and a weak red-noise component at very low frequency, indicating that it may be type-B (Fig.4(d)). The dynamical PDS for the first 2000 s of this observation showed rapid transition (see Fig.5). During the first 800 s, the PDS showed appearances of type-B (with a QPO frequency 10 Hz). During the decrease phase in the light curve, no significant QPO with ME is detected. The HE data showed the similar behaviour, while the LE was saturated during this time. From MJD 58017 to the end of our sample (MJD 58023), the behaviour of PDS is rather complex. On MJD 58017, while the ME rate increases, we detected a 10 Hz QPO with a high rms amplitude (13%) compared to the previous one (Fig.4(e)). Even though the QPO centroid frequency is different from previous type-C QPOs, the rms suggest that this QPO is type-C. After this, the QPO (12 Hz) becomes weaker and broader with a low amplitude red-noise component (Fig.4(f)), suggesting a transition to type-A QPO.


The PDS of the HE and LE detectors are approximately the same in the evolution. In Fig.6 we present the PDS of the three detectors for two observations, in which the shape of the PDS significantly evolves with energy.


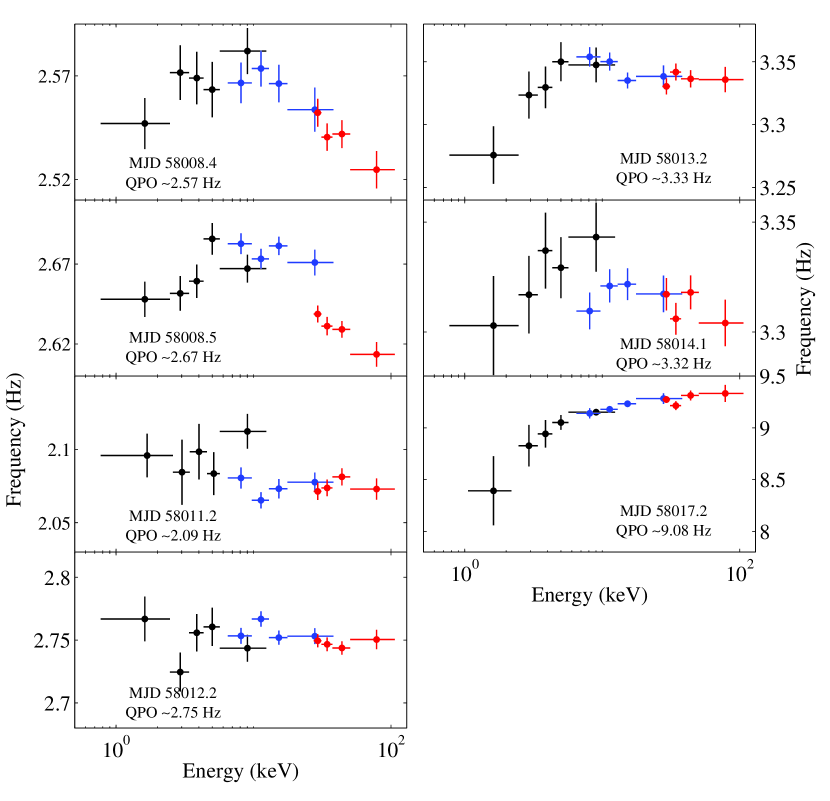
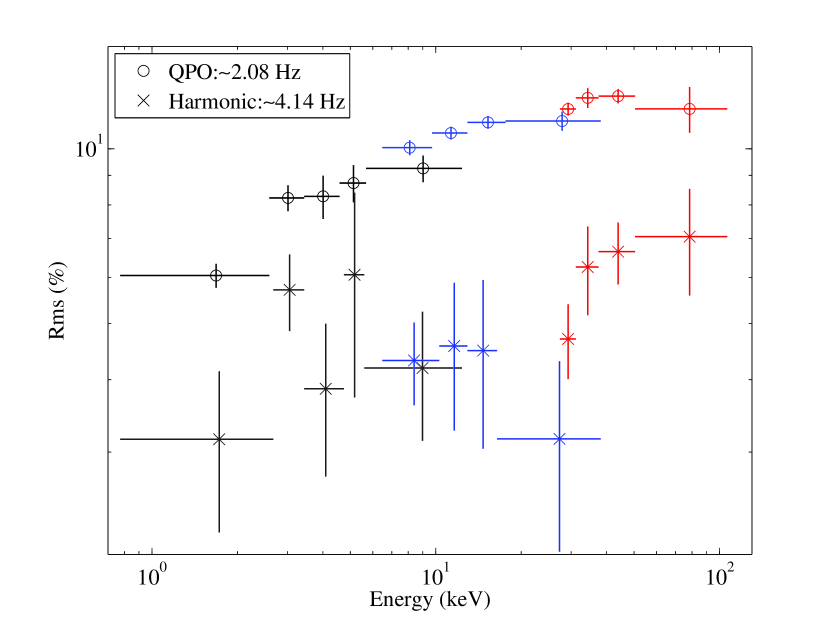
In order to quantitatively study the energy dependent behavior of the QPO properties, we extract power spectra in several energy bands. To improve the statistics, we only derive the energy dependence of the type-C QPOs with high amplitudes. The fractional rms and the centroid frequency of the type-C QPOs as functions of photon energy are shown in Fig.7 and 8, with the QPO frequencies and obsID marked in each panel. We consider the background contribution to the fractional rms calculation. The formula is rms = (Bu et al., 2015), where S and B stand for source and background count rates respectively, and P is the power normalized according to Miyamoto (Miyamoto et al., 1991). In the region where LE and ME or ME and HE overlap, there is a good agreement between the two detectors. In all cases, the rms increases with photon energy till 20 keV, from 5% in the lowest energy band up to 13% during HIMS and from 1% to 15% during SIMS, and stays more or less constant afterwards, while no significant decrease is seen above 30 keV. The QPO centroid frequencies are also related to photon energy. Unlike the rms, it does not have a unified trend. In the four panels of Fig.8 (the top two of each column), with the increasing of photon energy, the frequencies first increase and then decrease after 10 keV. In the bottom two panels of the first column, the frequency is almost constant and independent with photon energy. However, it shows monotonically increasing trend with photon energy for the rest of the panels.

3.3. Phase Lags
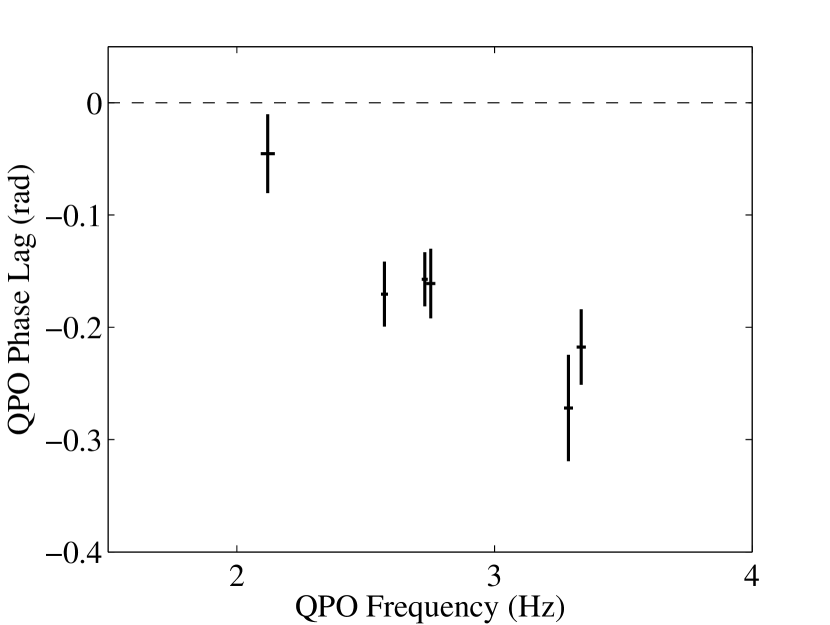
Phase lags between soft and hard variabilities are computed from the LE data. Due to the statistics limit, only the first period is selected for further study. Fig.9 shows the phase-lags of two observations as a function of frequency representing the LHS and the HIMS. Due to poor statistics, lags became hard to measure at high frequencies; thus we plot them only below 16 Hz. In the LHS, the broad band noise component shows a positive phase lag. During the HIMS, the lags of fundamental QPO are negative, while the second harmonic shows positive phase lags. We also derive phase lags at the QPO centroid frequency shown in Fig.10. The lag is strongly correlated with centroid frequency, with a trend towards zero lags while QPO frequency decreases.
4. DISCUSSIONS
4.1. The outburst and source states
In this work, we have presented the timing results of a new BHC MAXI J1535-571 during its outburst in 2017 using Insight-HXMT data. The outburst evolution is consistent with the scenario typically observed in BHCs (Belloni et al., 2005; Muñoz-Darias et al., 2011; Belloni, 2010). Based on the combined timing and color properties, we have identified three main states according to the classification criteria given by Belloni 2010. The source experienced a state transition from the LHS to HIMS in the early phase and then to SIMS.
Fig.2 shows typical hardness and timing properties of the canonical LHS, although the vertical branch of the HID is completely observed. The PDS is dominated by a strong band-limited noise (see panel (a) in Fig.3), with typical rms values of 26%. From observation P011453500119 (MJD 58008), the hardness ratio shows a significant decline from 2.1 to 1.5 before the source enters the top left in the HID (see Fig.2). During this period, the PDS (Fig.3 panel (b) and (c)) showed a band-limited noise and a strong typc-C QPO with a comparable lower total rms than in the LHS. The results indicate the source enters the HIMS. Around MJD 58015 the timing variabilities show a clear difference from those in the HIMS, while a type-B QPO appears in the PDS (Fig.3 panel (d) and Fig.5), indicating a transition to SIMS.
The above state transition are also consistent with the spectral fit of the Swift observations given by Tao et al. (2017). As shown in their paper, the power law photon index stayed around 1.5 until MJD 58007, and increased suddenly to 2.0 until MJD 58014. From MJD 58015, increased from 2.0 to 2.5. The inner disk temperature and the disk flux ratio stabilized at a low value before MJD 58015, and jumped to a high value afterward.
4.2. Quasi-periodic oscillations
The LFQPOs, consisting of three types (type-A -B and -C), are observed in the range 1.78 to 13.88 Hz (see Table 2).
Type-C QPOs are observed in HIMS, similar to XTE J1859+226 (Casella et al., 2004), and in the early stages of SIMS, with a higher centroid frequency, by all the three detectors. When type-C QPOs are observed in SIMS, a hard flaring happened, suggesting an association to the hard component. Their frequencies are correlated with count rates and hardness, similar to what have been observed in other BHT (Tomsick and Kaaret, 2001; Belloni et al., 2005). The QPO frequencies observed by Insight-HXMT are consistent with the NICER results which showed QPO frequency between 1.9 and 2.8 Hz during September 12, 10:53:39 and September 13, 22:40:40 (Gendreau et al., 2017). In our case, the QPO frequency is between 1.78 and 2.74 Hz during September 12, 10:38:59 and September 14, 08:06:59.
The second harmonics of type-C QPOs are constantly detected in LE and HE observations, but only in some of the ME observations, which might due be to the low signal-to-noise ratio (see Fig.4 and Fig.6). For observation P011453500301, the second harmonic is clearly detected in ME energy band, thus we can measure the fractional rms as a function of photon energy for both QPO and its second harmonic (see Fig.11). The relation of the rms of the second harmonic QPOs with photon energy has been observed in XTE J1550-564 (Li et al., 2013a) and GRS 1915+105 (Yadav et al., 2016). However, while it displays an arch-like relation and the maximum amplitude of the arch relation appears at 7 keV in XTE J1550-564, the rms of the harmonic QPO increases till 10 keV and then seems to decline until 30 keV with large uncertainty in GRS 1915+105. Using frequency-resolved spectroscopy, Axelsson and Done (2016) found that the second harmonic spectrum is dramatically softer than the QPO spectrum and the time-averaged spectrum, and can be described by an additional soft Comptonization component. The lack of the second harmonic in ME observations may be due to a physical reason. However, beyond 30 keV the fractional rms of the second harmonic increases with photon energy, suggesting that the second harmonic may be also related to an additional component (i.e.,the reflection component).
Type-B QPOs are usually detected when a source experienced a rapid transition to the SIMS. Fast transitions have been observed in GS 1124-68 (Takizawa et al., 1997), XTE J1859+226 (Casella et al., 2004) and GX 339-4 (Belloni et al., 2005). A very sharp threshold in count rate was observed, suggesting a transition. However, for MAXI J1535-571 the QPO has a frequency around 10 Hz, which is different from the typical frequency of 6 Hz. The correlation of type-B QPO frequencies with the power-law flux has been reported by Motta et al. (2011) and Gao et al. (2017). The higher frequency of the type-B QPO could indicate that MAXI J1535-571 has a higher hard luminosity compared to other systems. Jet ejections are thought to be associated with Type-B QPOs and the X-ray flux peak (Fender et al., 2009). In MAXI J1535-571, type-B QPO is found in correspondence with the count rate peak (see Fig.1). Future multi-wavelength observation are needed to verify the existence of relativistic jet emission during the X-ray flux peak.
Type-A QPOs are observed in SIMS, with a clear QPO peak at around 10 Hz present only in ME and HE observations. A similar behavior has been reported in GX 339-4 (Belloni et al., 2005).
4.3. Energy dependence of QPO parameters
For the first time we studied the fractional rms and the centroid frequency of the QPO as a function of photon energy up to 100 keV(see Fig.7 and Fig.8).
The QPO rms amplitude increases with photon energy till 20 keV and keeps more or less as a constant in all the observations. The background estimation we applied is based on the blind FoV detectors. The background consists of Cosmic X-ray and Particle Background including cosmic rays, albedo radiation and SAA-induced background for a Low-Earth Orbit satellite (Xie et al., 2015). Since there is no sign of other bright sources in the MAXI images555http://maxi.riken.jp/star_data/J1535-572/J1535-572.html, most of the LE detector background comes from cosmic x-rays background (dozens counts s-1), which can be neglected compared to the high count rate in MAXI J1535-571. However, for ME and HE, the background is dominated by Particle Background, which is related to the position and attitude of the satellite. The HE and ME background typically accounts for 10% to 20% for sub-energy bands, except for the highest sub-energy band of HE detector which can be around 50. In order to investigate the accuracy of our background estimation, we applied several blank sky observations, and found the count rate ratio between the small FoV and the blind FoV detectors is independent of time. Our background estimation method is thus reasonable for rms calculation.
In addition to MAXI J1535-571, similar energy dependence relations for the type-C QPO were found in GRS 1915+015 (Rodriguez et al., 2004; Yan et al., 2012, 2013; Yadav et al., 2016), H1743-322 (Li et al., 2013b), XTE J1859+226 (Casella et al., 2004) and XTE J1550-564 (Li et al., 2013a), in which a corona origin of type-C QPOs is considered. For GRS 1915+105, HEXTE results showed that the QPO rms decreases above 20 keV (Tomsick and Kaaret, 2001). However, Rodriguez et al. (2004) found that this cut-off was not always present, but rather related to the compact jets which contributes to the hard X-ray component mostly through synchrotron emission. You et al. (2018) computed the fractional rms spectrum of the QPO in the context of the LenseThirring precession model (Ingram et al., 2009). They found that the rms at higher energy keV becomes flat when the system being viewed with large inclination angle. Our result is consistent with the simulation.
The correlation between the centroid frequency of QPOs and the photon energy shows three different shapes: flat, positive and ‘arch’ like. For energies keV, this relation in GRS 1915+105 (Qu et al., 2010; Yan et al., 2012, 2018) and XTE J1550-564 (Li et al., 2013a) evolves from a negative correlation to a positive one when the QPO frequency increases, but with a different turn-over QPO frequency. The pattern in H1743-322 shows no apparent turn-over frequency, which might be due to the lack of observational data for the hard state (Li et al., 2013b). The energy dependence of the QPO frequency could be caused by differential precession of the inner accretion flow (van den Eijnden et al., 2016). The innerpart flow causes a higher QPO frequency than the outerpart flow, and the evolution of the spectral properties of the inner and outer part can causes the frequencyenergy relation change from negative to positive. When the innerpart flow has a harder spectrum than the outerpart flow, this causes a positive correlation. In MAXI J1535-571, the turn over of the relation at high energy keV would suggest that it is due to the reflection bump being prominent at those energies. The reflected spectrum is expected to be dominated by photons emitted by the outerpart flow, thus the reflected spectrum will show a relatively low precession frequency.
4.4. Phase lag and Inclination estimates
We have calculated the phase lag between the 1-3 keV and 3-7 keV energy bands. We have found that the phase lags of the fundamental and the harmonic of type-C QPOs keeps opposite. The lags of the fundamental peak are soft, while the harmonic show hard lags. Similar to that found in GRS 1915+105 (Lin et al., 2000; Reig et al., 2000; Qu et al., 2010), and XTE J1859+226 (Casella et al., 2004), the lag is strongly correlated with the centroid frequency of the QPO, and decreases with an increasing frequency.
Recently, from the inclination dependence of phase lags in a sample of 15 black hole binaries, van den Eijnden et al. (2017) found that the phase lag of the type-C QPOs strongly depends on the inclination, both in evolution with the QPO frequency and sign. All samples possess a slightly hard lag at low QPO frequencies. At high frequencies high-inclination sources turn to soft lags while lags in low-inclination sources become harder. These results support the geometrical origin of type-C QPOs.
MAXI J1535-571 clearly follows the trend of high-inclination sources presented in van den Eijnden et al. (2017). Xu et al. (2018) performed a spectral analysis of the NuSTAR observation in the hard state, and found that the energy spectra can be well fitted by two different models which both consist of a multi-temperature thermal component, but with different reflection models (one for relxilllpCp+xillverCp, the other for relxillCp+xillverCp). They found that the inclination angle is ∘ or ∘, respectively. And, the spectral fitting result from NICER suggested a similar inclination of ∘ (Miller et al., 2018). Both are consistent with our phase lags result.
5. CONCLUSION
We have presented timing analysis of the new BHC MAXI J1535-571 using Insight-HXMT observations. The main results of the study are:
1) The source exhibits state transitions from LHS to HIMS, and then SIMS.
2) For the first time an energy dependence of the QPO fractional rms and frequency is observed up to 100 keV. While the energy dependence rms is consistent with other black hole binaries observed by RXTE, Insight-HXMT reveals that the frequency-energy relation changes dramatically.
3) By assuming a geometric origin of type-C QPO, MAXI J1535-571 is consistent with being a high inclination source.
References
- Belloni (2010) T. M. Belloni, in Lecture Notes in Physics, Berlin Springer Verlag, Lecture Notes in Physics, Berlin Springer Verlag, Vol. 794, edited by T. Belloni (2010) p. 53, arXiv:0909.2474 [astro-ph.HE] .
- Remillard and McClintock (2006) R. A. Remillard and J. E. McClintock, ARA&A 44, 49 (2006), astro-ph/0606352 .
- Motta et al. (2009) S. Motta, T. Belloni, and J. Homan, MNRAS 400, 1603 (2009), arXiv:0908.2451 [astro-ph.HE] .
- Remillard et al. (2002) R. A. Remillard, G. J. Sobczak, M. P. Muno, and J. E. McClintock, ApJ 564, 962 (2002), astro-ph/0105508 .
- Casella et al. (2005) P. Casella, T. Belloni, and L. Stella, ApJ 629, 403 (2005), astro-ph/0504318 .
- Ingram et al. (2009) A. Ingram, C. Done, and P. C. Fragile, MNRAS 397, L101 (2009), arXiv:0901.1238 [astro-ph.SR] .
- Ingram and van der Klis (2015) A. Ingram and M. van der Klis, MNRAS 446, 3516 (2015), arXiv:1411.1967 [astro-ph.HE] .
- Ingram et al. (2016) A. Ingram, M. van der Klis, M. Middleton, C. Done, D. Altamirano, L. Heil, P. Uttley, and M. Axelsson, MNRAS 461, 1967 (2016), arXiv:1607.02866 [astro-ph.HE] .
- van den Eijnden et al. (2017) J. van den Eijnden, A. Ingram, P. Uttley, S. E. Motta, T. M. Belloni, and D. W. Gardenier, MNRAS 464, 2643 (2017), arXiv:1610.03469 [astro-ph.HE] .
- Motta et al. (2015) S. E. Motta, P. Casella, M. Henze, T. Muñoz-Darias, A. Sanna, R. Fender, and T. Belloni, MNRAS 447, 2059 (2015), arXiv:1404.7293 [astro-ph.HE] .
- Tomsick and Kaaret (2001) J. A. Tomsick and P. Kaaret, ApJ 548, 401 (2001), astro-ph/0009354 .
- Rodriguez et al. (2004) J. Rodriguez, S. Corbel, D. C. Hannikainen, T. Belloni, A. Paizis, and O. Vilhu, ApJ 615, 416 (2004), astro-ph/0407076 .
- Qu et al. (2010) J. L. Qu, F. J. Lu, Y. Lu, L. M. Song, S. Zhang, G. Q. Ding, and J. M. Wang, ApJ 710, 836 (2010), arXiv:0912.4769 [astro-ph.HE] .
- Yadav et al. (2016) J. S. Yadav, R. Misra, J. Verdhan Chauhan, P. C. Agrawal, H. M. Antia, M. Pahari, D. Dedhia, T. Katoch, P. Madhwani, R. K. Manchanda, B. Paul, P. Shah, and C. H. Ishwara-Chandra, ApJ 833, 27 (2016), arXiv:1608.07023 [astro-ph.HE] .
- Negoro et al. (2017a) H. Negoro, M. Ishikawa, S. Ueno, H. Tomida, Y. Sugawara, N. Isobe, R. Shimomukai, T. Mihara, M. Sugizaki, M. Serino, S. N. W. Iwakiri, M. Shidatsu, M. Matsuoka, N. Kawai, S. Sugita, T. Yoshii, Y. Tachibana, S. Harita, Y. Muraki, K. Morita, A. Yoshida, T. Sakamoto, Y. Kawakubo, Y. Kitaoka, T. Hashimoto, H. Tsunemi, T. Yoneyama, M. Nakajima, T. Kawase, A. Sakamaki, Y. Ueda, T. Hori, A. Tanimoto, S. Oda, Y. Tsuboi, Y. Nakamura, R. Sasaki, H. Kawai, M. Yamauchi, C. Hanyu, K. Hidaka, T. Kawamuro, and K. Yamaoka, The Astronomer’s Telegram 10699 (2017a).
- Barthelmy et al. (2017) S. D. Barthelmy, J. A. Kennea, and K. L. Page, GRB Coordinates Network, Circular Service, No. 21792, #1 (2017) 21792 (2017).
- Kennea et al. (2017) J. A. Kennea, P. A. Evans, A. P. Beardmore, H. A. Krimm, P. Romano, K. Yamaoka, M. Serino, and H. Negoro, The Astronomer’s Telegram 10700 (2017).
- Russell et al. (2017) T. D. Russell, J. C. A. Miller-Jones, G. R. Sivakoff, A. J. Tetarenko, and Jacpot Xrb Collaboration, The Astronomer’s Telegram 10711 (2017).
- Dincer (2017) T. Dincer, The Astronomer’s Telegram 10716 (2017).
- Scaringi and ASTR211 Students (2017) S. Scaringi and ASTR211 Students, The Astronomer’s Telegram 10702 (2017).
- Negoro et al. (2017b) H. Negoro, T. Kawase, M. Sugizaki, S. Ueno, H. Tomida, Y. Sugawara, N. Isobe, M. Ishikawa, R. Shimomukai, T. Mihara, M. Serino, S. N. W. Iwakiri, M. Shidatsu, M. Matsuoka, N. Kawai, S. Sugita, T. Yoshii, Y. Tachibana, S. Harita, Y. Muraki, K. Morita, A. Yoshida, T. Sakamoto, Y. Kawakubo, Y. Kitaoka, T. Hashimoto, H. Tsunemi, T. Yoneyama, M. Nakajima, A. Sakamaki, Y. Ueda, T. Hori, A. Tanimoto, S. Oda, Y. Tsuboi, Y. Nakamura, R. Sasaki, H. Kawai, M. Yamauchi, C. Hanyu, K. Hidaka, T. Kawamuro, and K. Yamaoka, The Astronomer’s Telegram 10708 (2017b).
- Nakahira et al. (2017) S. Nakahira, H. Negoro, T. Mihara, W. Iwakiri, M. Sugizaki, M. Shidatsu, M. Matsuoka, S. Ueno, H. Tomida, M. Ishikawa, Y. Sugawara, N. Isobe, R. Shimomukai, N. Kawai, S. Sugita, T. Yoshii, Y. Tachibana, S. Harita, Y. Muraki, K. Morita, A. Yoshida, T. Sakamoto, M. Serino, Y. Kawakubo, Y. Kitaoka, T. Hashimoto, H. Tsunemi, T. Yoneyama, M. Nakajima, T. Kawase, A. Sakamaki, Y. Ueda, T. Hori, A. Tanimoto, S. Oda, Y. Tsuboi, Y. Nakamura, R. Sasaki, H. Kawai, M. Yamauchi, C. Hanyu, K, Hidaka, T. Kawamuro, and K. Yamaoka, The Astronomer’s Telegram 10729 (2017).
- Kennea (2017) J. A. Kennea, The Astronomer’s Telegram 10731 (2017).
- Palmer et al. (2017) D. M. Palmer, H. A. Krimm, and Swift/BAT Team, The Astronomer’s Telegram 10733 (2017).
- Tao et al. (2017) L. Tao, Y. Chen, G. U. O. Can, Y. Huang, F. Lu, J. Qu, L. Song, S. Zhang, and S. Zhang, submitted (2017).
- Mereminskiy and Grebenev (2017) I. A. Mereminskiy and S. A. Grebenev, The Astronomer’s Telegram 10734 (2017).
- Gendreau et al. (2017) K. Gendreau, Z. Arzoumanian, C. Markwardt, T. Okajima, T. Strohmayer, R. Remillard, D. Chakrabarty, G. Prigozhin, B. Lamarr, D. Pasham, J. Steiner, J. Homan, J. Miller, P. Bult, E. Cackett, W. Iwakiri, T. Enoto, P. Uttley, and Nicer Team, The Astronomer’s Telegram 10768 (2017).
- Miller et al. (2018) J. M. Miller, K. Gendreau, R. M. Ludlam, A. C. Fabian, D. Altamirano, Z. Arzoumanian, P. M. Bult, E. M. Cackett, J. Homan, E. Kara, J. Neilsen, R. A. Remillard, and F. Tombesi, ApJ 860, L28 (2018), arXiv:1806.04115 [astro-ph.HE] .
- Xu et al. (2018) Y. Xu, F. A. Harrison, J. A. García, A. C. Fabian, F. Fürst, P. Gandhi, B. W. Grefenstette, K. K. Madsen, J. M. Miller, M. L. Parker, J. A. Tomsick, and D. J. Walton, ApJ 852, L34 (2018), arXiv:1711.01346 [astro-ph.HE] .
- Zhang et al. (2014) S. Zhang, F. J. Lu, S. N. Zhang, and T. P. Li, in Space Telescopes and Instrumentation 2014: Ultraviolet to Gamma Ray, Proc. SPIE, Vol. 9144 (2014) p. 914421.
- Miyamoto et al. (1991) S. Miyamoto, K. Kimura, S. Kitamoto, T. Dotani, and K. Ebisawa, ApJ 383, 784 (1991).
- Nowak (2000) M. A. Nowak, MNRAS 318, 361 (2000), astro-ph/0005232 .
- Belloni et al. (2002) T. Belloni, D. Psaltis, and M. van der Klis, ApJ 572, 392 (2002), astro-ph/0202213 .
- Reig et al. (2000) P. Reig, T. Belloni, M. van der Klis, M. Méndez, N. D. Kylafis, and E. C. Ford, ApJ 541, 883 (2000).
- Bu et al. (2015) Q.-c. Bu, L. Chen, Z.-s. Li, J.-l. Qu, T. M. Belloni, and L. Zhang, ApJ 799, 2 (2015), arXiv:1411.1137 [astro-ph.HE] .
- Belloni et al. (2005) T. Belloni, J. Homan, P. Casella, M. van der Klis, E. Nespoli, W. H. G. Lewin, J. M. Miller, and M. Méndez, A&A 440, 207 (2005), astro-ph/0504577 .
- Muñoz-Darias et al. (2011) T. Muñoz-Darias, S. Motta, H. Stiele, and T. M. Belloni, MNRAS 415, 292 (2011), arXiv:1103.2309 [astro-ph.HE] .
- Casella et al. (2004) P. Casella, T. Belloni, J. Homan, and L. Stella, A&A 426, 587 (2004), astro-ph/0407262 .
- Li et al. (2013a) Z. B. Li, J. L. Qu, L. M. Song, G. Q. Ding, and C. M. Zhang, MNRAS 428, 1704 (2013a).
- Axelsson and Done (2016) M. Axelsson and C. Done, MNRAS 458, 1778 (2016), arXiv:1506.01102 [astro-ph.HE] .
- Takizawa et al. (1997) M. Takizawa, T. Dotani, K. Mitsuda, E. Matsuba, M. Ogawa, T. Aoki, K. Asai, K. Ebisawa, K. Makishima, S. Miyamoto, S. Iga, B. Vaughan, R. E. Rutledge, and W. H. G. Lewin, ApJ 489, 272 (1997).
- Motta et al. (2011) S. Motta, T. Muñoz-Darias, P. Casella, T. Belloni, and J. Homan, MNRAS 418, 2292 (2011), arXiv:1108.0540 [astro-ph.HE] .
- Gao et al. (2017) H. Q. Gao, L. Zhang, Y. Chen, Z. Zhang, L. Chen, S.-N. Zhang, S. Zhang, X. Ma, Z.-J. Li, Q.-C. Bu, and J. Qu, MNRAS 466, 564 (2017), arXiv:1701.04994 [astro-ph.HE] .
- Fender et al. (2009) R. P. Fender, J. Homan, and T. M. Belloni, MNRAS 396, 1370 (2009), arXiv:0903.5166 [astro-ph.HE] .
- Xie et al. (2015) F. Xie, J. Zhang, L.-M. Song, S.-L. Xiong, and J. Guan, Ap&SS 360, 13 (2015), arXiv:1511.02997 [astro-ph.IM] .
- Yan et al. (2012) S.-P. Yan, J.-L. Qu, G.-Q. Ding, P. Han, L.-M. Song, S. Zhang, H.-X. Yin, C.-M. Zhang, and J.-M. Wang, Ap&SS 337, 137 (2012), arXiv:1107.3621 [astro-ph.HE] .
- Yan et al. (2013) S.-P. Yan, G.-Q. Ding, N. Wang, J.-L. Qu, and L.-M. Song, MNRAS 434, 59 (2013), arXiv:1306.0640 [astro-ph.HE] .
- Li et al. (2013b) Z. B. Li, S. Zhang, J. L. Qu, H. Q. Gao, H. H. Zhao, C. P. Huang, and L. M. Song, MNRAS 433, 412 (2013b).
- You et al. (2018) B. You, M. Bursa, and P. T. Życki, ApJ 858, 82 (2018), arXiv:1801.04028 [astro-ph.HE] .
- Yan et al. (2018) S.-P. Yan, L. Ji, S.-M. Liu, M. Méndez, N. Wang, X.-D. Li, J.-L. Qu, W. Sun, M.-Y. Ge, J.-Y. Liao, S. Niu, G.-Q. Ding, and Q.-Z. Liu, MNRAS 474, 1214 (2018), arXiv:1711.03005 [astro-ph.HE] .
- van den Eijnden et al. (2016) J. van den Eijnden, A. Ingram, and P. Uttley, MNRAS 458, 3655 (2016), arXiv:1603.03392 [astro-ph.HE] .
- Lin et al. (2000) D. Lin, I. A. Smith, E. P. Liang, and M. Böttcher, ApJ 543, L141 (2000).