Heating and cooling of electrons in an ultracold neutral plasma using Rydberg atoms
Abstract
We have experimentally demonstrated both heating and cooling of electrons in an ultracold neutral plasma (UNP) by embedding Rydberg atoms into the plasma soon after its creation. We have determined the relationship between the initial electron temperature, , and the binding energy of the added Rydberg atoms, , at the crossover between heating and cooling behaviors (that is, the binding energy of the atoms, which, when they are added to the plasma, neither accelerate or slow down the plasma expansion). Specifically, this condition is when the diagnostic used is the effect of the Rydberg atoms on the plasma asymptotic expansion velocity. Additionally, we have obtained experimental estimates for the amount of heating or cooling which occurs when the Rydberg binding energy does not satisfy the crossover condition. The experimental results for the crossover condition, and the degree of heating or cooling away from the crossover, are in agreement with predictions obtained from numerical modeling of the interactions between Rydberg atoms and the plasma. We have also developed a simple intuitive picture of how the Rydberg atoms affect the plasma which supports the concept of a “bottleneck” in the Rydberg state distribution of atoms in equilibrium with a co-existing plasma.
pacs:
32.80 Ee 32.80.Fb 37.10.Gh 52.25.Kn 55.25.DyI INTRODUCTION
Ultracold neutral plasmas (UNPs), first observed at NIST in 1999 Killian et al. (1999), are systems in which basic atomic processes dominate the plasma evolution process (for a comprehensive picture of recent research on UNPs, see Refs. Killian et al. (2007) and Lyon and Rolston (2017)). UNPs are created by photoionizing cold atoms in a magneto-optical trap (MOT), though they have also been made using translationally cold atoms and molecules in a supersonic beam Morrison et al. (2008); Schulz-Weiling et al. (2016). Additionally, cold, dense Rydberg atom ensembles evolve spontaneously into UNPs Robinson et al. (2000); Li et al. (2004); Forest et al. (2018).
A question that has received significant attention with regard to UNPs is whether they can reach the strongly coupled regime for either the ions or the electrons. The traditional measure of the strength of the coupling is the ratio of the mean electrostatic interaction energy of a species to its mean kinetic energy, which is parameterized by the Coulomb coupling parameter,
| (1) |
( is the Wigner-Seitz radius for species , which may be electrons, , or ions). Plasmas with are considered to be strongly coupled for species , and manifest long-range correlation behaviors Pohl et al. (2004a).
For UNPs made by photoionization of atoms in a MOT, the initial ion temperature, , is the same as that of the MOT atoms and lies in the range 0.1 - 10 mK for plasmas made from alkalis, alkaline earths, and noble gases. The initial electron temperature, , is determined by the laser excess photon energy, , as
| (2) |
where is the atom’s ionization energy. Using a narrow bandwidth laser to ionize the atoms, it is possible to make very small. For instance, in Ref. Chen et al. (2017), a value of K was achieved. Additionally, ion and electron densities of up to cm-3 Gupta et al. (2007) are attainable in a MOT, and may be as high as cm-3 in a supersonic beam Schulz-Weiling et al. (2016).
Based on these temperatures and densities, it would seem relatively straightforward to reach the strongly coupled regime for both electrons and ions. However, the low initial electron temperatures in such plasmas result in high rates for three body recombination (TBR), which scales with ion and electron densities, and respectively, and electron temperature as Mansbach and Keck (1969). TBR heats the plasma electrons and results in the formation of Rydberg atoms. In contrast, the inverse process, namely collisional ionization of the Rydberg atoms, cools the plasma electrons, but electron collisions with the atoms can also de-excite the atoms and heat the electrons. Additionally, several other mechanisms heat electrons and ions. For instance, both electrons and ions are subject to disorder induced heating (DIH), and this process typically heats the ions up to K in the first few microseconds of the plasma evolution process at higher densities Chen et al. (2004); Lyon and Rolston (2017).
In this paper, we distinguish the initial temperature values which are set by the experimental conditions from the effective initial electron and ion temperatures, and , respectively. It is the thermal energy represented by these latter two quantities that drives the plasma expansion to have an asymptotic expansion velocity
| (3) |
where is the ion mass. In an ideal collisionless plasma, and ; however, the heating mechanisms mentioned above cause and to be larger than the initial values set in the experiment. The most straightforward techniques for measuring and , including the method we use in this paper to obtain , directly or indirectly extract its value from the plasma expansion velocity using Eq. 3 Kulin et al. (2000); Simien et al. (2004); Morrison et al. (2008).
In general, heating of ions is less significant than for electrons. Consequently, values for have been achieved, and there are mechanisms, either proposed or already demonstrated, that may be used to cool the ions in a UNP, and increase . In UNPs made from Sr atoms, laser cooling using the Sr+ resonance line has been reported in Ref. Gorman et al. (2018), and it has been proposed that high values may also be achievable in UNPs which evolve from dipole-blockaded cold Rydberg samples Bannasch et al. (2013). On the other hand, for small , TBR heats the electrons and results in minimum values in the range 30 - 50 K, and, at high density, DIH will also cause electron heating Kuzmin and O’Neil (2002). (Electron correlation heating in UNPs created with initial electron temperature and density such that can also be considered using the threshold lowering model Hahn (2002)). Because of these electron heating mechanisms, it has been found that in UNPs Robicheaux and Hanson (2002).
In contrast with the ability to cool ions in a UNP, there are limited avenues for achieving strong electron coupling in UNPs created from cold atoms in a MOT, due to the strong dependence of TBR rates on electron density and temperature. The NIST group attained Fletcher et al. (2007) for Xe plasmas, while the group at Rice University found for Sr plasmas made by photionization Gupta et al. (2007). The group at Colorado State University obtained for Rb plasmas made at low density so that TBR heating was minimal Chen et al. (2017). On the other hand, UNPs which evolve from Rydberg states of cold NO molecules in a supersonic beam (for a review of these experiments, see Ref. Schulz-Weiling et al. (2016)) have been reported to have K at a density such that nm, implying Morrison et al. (2009). At present, there is no obvious way to bridge the factor of 1000 difference in density between the MOT experiments and the beam experiments in order to understand the difference in the degree of electron coupling that can be achieved. Moreover, UNPs made by exciting molecular Rydberg states have a number of degrees of freedom that are unavailable to atomic UNPs, further complicating attempts to compare the dynamics of cold atomic and molecular plasmas.
In Ref. Vanhaecke et al. (2005), it was proposed that the electrons in a UNP could be cooled by adding (“embedding”) Rydberg atoms into a UNP. While the experiments reported in this paper were not sensitive enough to detect a change in the electron temperature due to the addition of Rydberg atoms, a related numerical study Pohl et al. (2006) showed that the experimental results of Ref. Vanhaecke et al. (2005) were consistent with modest heating or cooling of plasma electrons by the introduction of Rydberg atoms. The basic idea of the cooling mechanism is that electron-Rydberg collisions either ionize the atom, or leave it in a higher-lying energy state. It has been known for a long time that there exists a bottleneck in the Rydberg state distribution for atoms which co-exist with a plasma Mansbach and Keck (1969). At the bottleneck, the atoms have an energy that is lower than the ionization limit by an amount , where is the plasma electron temperature. Atoms with this energy are as likely to ultimately ionize due to electron collisions as they are to be de-excited and eventually decay radiatively so that they no longer participate in the plasma evolution dynamics. Therefore, adding atoms which are bound by more than should heat the plasma electrons since the most likely collisions are those that result in the atom being more deeply bound than less, while adding atoms with bound by less than should result in electron cooling.
Here, we present an experimental and numerical study of adding Rydberg atoms to a cold plasma. Specifically, using both direct and indirect measurements of the plasma asymptotic expansion velocity, , obtained from the electron and ion time of flight (TOF) spectra, we have observed both heating and cooling of UNPs due to the presence of Rydberg atoms. Additionally, we have measured the critical Rydberg atom energy, , that leaves the plasma expansion velocity unchanged for a UNP with initial electron temperature . (In this paper, we will call the value of for that value the crossover temperature for the electrons, .) Further, using the ion TOF spectra, we have quantified the amount of heating and cooling that results when the Rydberg binding energy is not at the crossover condition for the plasma electrons and how this depends on the Rydberg binding energy and density. Our experimental results agree with numerical simulations using the Monte Carlo approach.
The principal results of our study are as follows. First, the crossover temperature of the electrons is related to the binding energy of the Rydberg atoms by the equation , which corresponds to the condition where the average energy gained by a Rydberg atom in a collision by an electron when the atom is excited is equal to the mean energy lost by the atom when the atom is de-excited. This is different than the bottleneck condition described above Mansbach and Keck (1969); Vriens and Smeets (1980); Stevefelt et al. (1975); Kuzmin and O’Neil (2002); Pohl et al. (2008); Bannasch and Pohl (2011), for which . Second, when the Rydberg atom binding energy and the electron temperature are not in the crossover condition, the average amount by which the energy of the plasma electrons is increased by a single electron-atom collision is . Consequently, the net amount by which the plasma is heated or cooled is proportional to , and also to the number of Rydberg atoms, and the mean number of electron collisions each Rydberg atom experiences during the plasma evolution. Unfortunately, our results suggest that embedding Rydberg atoms into a UNP may have a limited ability to push a plasma into the strongly coupled regime for electrons.
II EXPERIMENT
The apparatus used in this experiment has been described previously Branden et al. (2010); Forest et al. (2018). We use a rubidium vapor-cell MOT which is capable of trapping up to 85Rb atoms at a peak density of cm-3 and a temperature of K. The atoms are trapped midway between a pair of flat, high transparency copper meshes (the “field meshes”), which allow the application of small dc electric fields and/or high voltage pulses for selective field ionization (SFI) of Rydberg atoms. The MOT is run continuously, and neither the cooling nor the repump lasers are switched off during the experiment. The number of atoms in the MOT is obtained from a measurement of the total 780 nm fluorescence power emitted by the atoms, and the FWHM of the spatial density distribution is found by imaging the fluorescence onto a linear diode array. The radius of the density distribution is in the range m.
The plasma is created (at ) by a pulse of 480 nm light from a home-built Littman type dye laser Littman and Metcalf (1978) (Coumarin 480 dye) which photoionizes a fraction of the Rb atoms. The dye laser is pumped by third harmonic light from a 20 Hz repetition-rate Nd:YAG laser (Continuum Surelite), and has a pulse duration of ns. Calibration of the dye laser frequency is achieved using a 0.5-meter spectrometer referenced to the Balmer- line in hydrogen. This enabled us to create plasmas with initial electron temperature values (as defined in Eq. 2) in the range 20 to 140 K with an uncertainty K. The line width of the Littman laser is GHz, equivalent to a temperature uncertainty of K. The Surelite Nd:YAG pump laser is not injection seeded, and while this likely has some impact on the Littman laser line width, it does not affect the precision of the values as this is limited by the frequency calibration method. (The uncertainty, K, is equivalent to a frequency uncertainty of GHz.)
Rydberg atoms are embedded in the plasma at a time after the creation of the plasma, where 25 ns in the experiments described here. The laser used to excite the transition (where 24 - 60) is a narrow bandwidth pulsed laser (NBPL). Light at nm from a continuous wave external cavity diode laser (ECDL) is pulse amplified in three dye cells (LDS 925 dye), and then frequency doubled using a KNbO3 crystal Branden et al. (2010). The dye cells are pumped by 532 nm light from a second Nd:YAG laser (Continuum YG-661) in which the -switch is electronically triggered at a precisely controllable delay after the -switch of the Surelite Nd:YAG which is used to pump the Littman laser. The YG-661 pump laser, like the Surelite, is not injection seeded, and so the NBPL pulses are not transform limited. The fact that the YG-661 is unseeded results in longitudinal mode beating in the 532 nm light which pumps the LDS 925 dye, and this has been found to broaden the wings of the output spectrum of dye amplifiers (see, for instance, Ref. Trickl et al. (2007)). Nevertheless, we achieve a FWHM line width of MHz, which we have verified by frequency scanning the 960 nm ECDL and obtaining a spectrum of several states in the Rb Rydberg manifold. This signal was acquired using SFI, and the frequency scale at 960 nm was calibrated using a 1.5 GHz confocal etalon, and at 480 nm using the known spacings of the states which appeared in the SFI spectrum. The NBPL line width is sufficient to resolve well the and states which are separated by 364 MHz Harvey and Stoicheff (1977). (For we excite the state, but above we excite a mixture of the two levels.) More importantly, the the shot-to-shot variations in the NBPL spectrum result in only small variations in the number of Rydberg atoms created. The ECDL laser wavelength is measured using a Burleigh WA-1500 wave meter, resulting in a negligible uncertainty in knowledge of the binding energy of the Rydberg atoms. (The uncertainty in the values due to the laser line width of 200 MHz is mK.)
The beams from both 480 nm lasers are combined and made parallel using a polarizing beamsplitter cube, and half wave plates in each laser beam just before the beamsplitter cube allow the pulse energies in each beam to be varied independently. We calibrate the number of Rydberg atoms and ions created using the fluorescence depletion technique Han and Gallagher (2009). We monitor a fraction of the 780 nm fluorescence using a photomultiplier tube detector (PMT), and observe how much this is depleted when atoms are either excited using the narrow bandwidth laser, or ionized using the Littman laser, when an SFI pulse is applied immediately afterwards. The SFI pulse removes Rydberg atoms or ions from the MOT so they no longer contribute to the cooling cycle. By measuring the resulting fall in the MOT atom population using the 780 nm fluorescence, we can calculate how many are excited to a Rydberg state, or are ionized. For some of the experiments, we reduced the -switch firing rate of both Nd:YAG lasers to 10 Hz or 6.67 Hz to reduce the steady state trap depletion and obtain higher Rydberg atom and ion densities. The laser beams are not focused into the MOT chamber, and the laser spot sizes are of order 3-4 mm, much larger than the radius of the cloud of cold atoms. We typically create plasmas with an initial ion number (a maximum average initial ion density cm-3) and an initial number of Rydberg atoms typically in the range . (The ion and Rydberg atom densities have an absolute uncertainty of a factor of approximately 2, and a relative uncertainty of 20-30%.)
The UNPs created by the Littman laser are allowed to evolve in an environment in which the effects of stray external electric fields are minimized. The copper field meshes are stretched flat over stainless steel o-rings and are separated by 1.9 cm. We apply a small dc voltage to one of the field meshes (the other is grounded) so that the electric field in the interaction region is less than 10 mV/cm. (The interaction region is shielded in the perpendicular directions by two pairs of parallel metal plates spaced by approximately 10 cm.) Electrons or ions which exit through one of the field meshes are accelerated in a field of V/cm to microchannel plate detector (MCP). This field is created by biasing two meshes in front of the MCP which is itself inside a grounded metal enclosure so that field leakage is minimized. Our protocol for setting the dc voltage is to maximize the observed plasma lifetime when the electron TOF signal is being detected while maintaining a reasonable signal-to-noise ratio in the observed MCP signal. In these experiments, typical plasma lifetimes measured using the electron TOF signal are between 80 and 150 s, while the typical duration of the ion TOF signal is such that all the ions reach the MCP within 250 s of the lasers firing.
From the electron and ion TOF spectra, we extract the asymptotic plasma expansion velocity, , a macroscopic parameter which depends on the initial electron and ion temperatures, plus heating caused by DIH and TBR, as well as heating or cooling caused by the added Rydberg atoms (see Forest et al. (2018) for a discussion of the utility and meaning of ). Practically, if we assume self-similar expansion of a Gaussian density profile of electrons and ions in the plasma, is related to the characteristic size of the plasma, , by , where is the time since the plasma was created, and is initial radius of the plasma (this is assumed to be the same as that of the parent atoms in the MOT, though knowing the exact value of is unnecessary to obtaining any of our results). The method we use to extract values from the Rb+ ion TOF spectra is described in Ref. Forest et al. (2018).
Unfortunately, there is no similar method that we are aware of by which absolute values of can be obtained from the electron TOF spectra. However, it is possible to obtain relative measurements of the expansion velocity from the electron TOF spectra, and we used these to obtain a set of independent measurements of the crossover condition. Twedt and Rolston Twedt and Rolston (2010) studied electron evaporation from a UNP in a dc electric field, and found that the remaining electron fraction, , depends in a simple manner on the parameter
| (4) |
where is the applied electric field. We have used Twedt’s code and obtained the heuristic relationship , which reproduces the data in Ref. Twedt and Rolston (2010) within a few percent for . We use our electron TOF spectra to obtain the value of for a particular value of , say (i.e., ). Then, using Eq. 4, and assuming that , we can find using
| (5) |
where is the time at which the condition occurs. Since it is hard to measure and without introducing significant additional error, we simply use the quantity as a proxy for . If, when we add Rydberg atoms, increases, we say the plasma has been heated; if it decreases, then the plasma has cooled.
There are obvious shortcomings to this procedure. First, for embedded plasmas in which a significant fraction of the Rydberg atoms ionize, will be different to that for a plasma which did not have Rydberg atoms added to it. Second, the plasma may not have achieved a constant value of at the time when , especially in the situation where Rydbergs have been added to the plasma. Thirdly, the time at which changes as is changed. If has truly reached its asymptotic value, this should not matter, but if is still changing, there is a potential systematic error from this source. Finally, Ref. Twedt and Rolston (2010) assumes that the electrons are a zero-temperature fluid, and does not account for evaporation of electrons from the plasma that happens at times before the ion well potential plus the external field would allow spilling to occur. The possible impacts of this simplification are discussed in Sect. V.
III RESULTS
III.1 Crossover condition: Electron TOF spectra
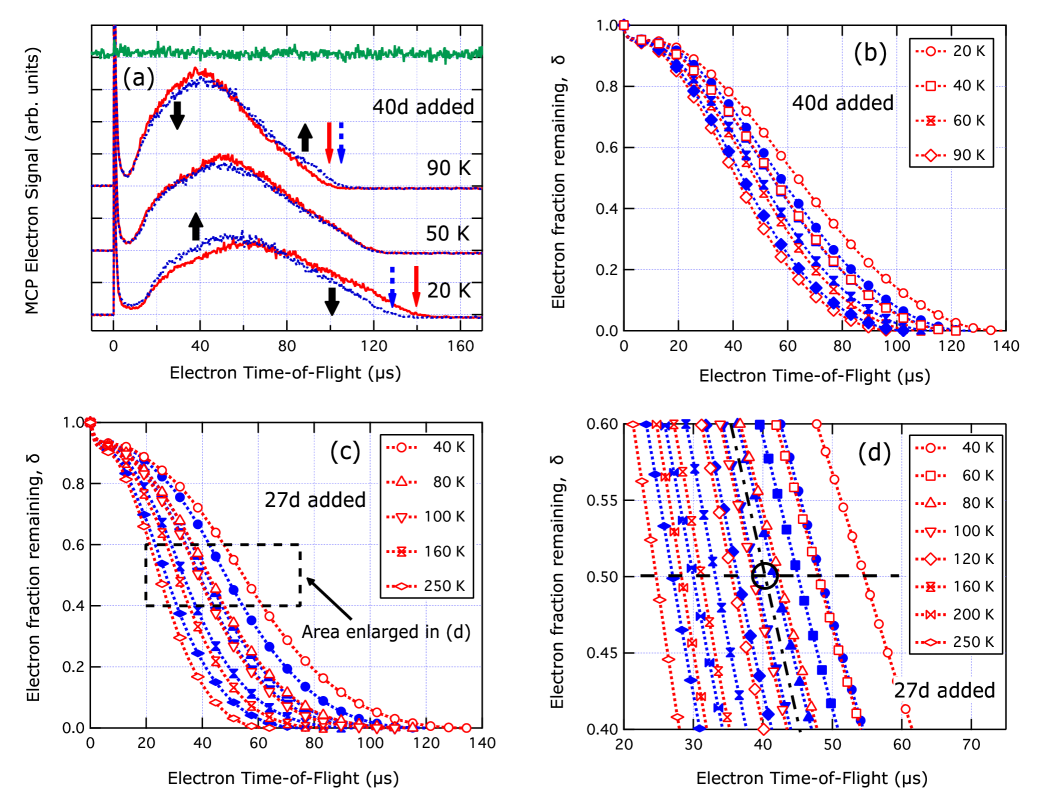
Examples of electron TOF spectra for UNPs created with different values when Rydberg atoms in the and states are embedded are shown in Fig. 1. In Fig. 1(a), we show plasmas created with , 50, and 90 K, both with and without the addition of atoms (binding energy magnitude K). The number of ions is (average ion density cm-3) and initial ratio . Each of the TOF spectra shown in Fig. 1 have a time resolution of 64 ns, and are averages over eight laser shots. Additionally, the spectra were subsequently smoothed by averaging over five adjacent time points. The averaged TOF spectra have a root mean square noise amplitude of % of the signal size at the maximum of the “hump” at 40-50 s flight time (the maximum noise variation of the signal is at the % level).
As can be seen, adding atoms to a K plasma increases the electron evaporation signal relative to the UNP with no embedded Rydberg atoms (which we term a “bare” plasma) at early evolution times, and the plasma lifetime (i.e., the time for all the electrons to evaporate from the UNP) is shorter than that of the bare plasma by approximately 10 s. (The changes in the electron evaporation signal due to the addition of the Rydberg atoms is significantly greater than the noise level of the averaged TOF signals.) However, adding atoms to the K UNP reduces the early time electron evaporation signal, and the plasma lifetime is slightly longer than for the bare plasma. On the other hand, adding atoms to the K UNP has an almost negligible effect on the plasma lifetime and electron evaporation rate. In other words, atoms accelerate the evolution of the 20 K plasma, leave the 50 K plasma almost unchanged, but slow the evolution of the 90 K plasma. (The upper trace in Fig. 1(a) is the electron signal from the atoms when there is no UNP present multiplied by a factor of 10, showing that there is clearly no evidence of spontaneous plasma formation.)
The effect of adding atoms to the plasma is more clearly seen in Fig. 1(b), where the remaining electron fraction, , is plotted versus time Twedt and Rolston (2010). Experimentally, at time is obtained using the equation
| (6) |
where is the electron TOF signal detected by the MCP, i.e., data like that shown in Fig. 1(a). For and 40 K, the time for the UNP to reach a particular value of (, say) decreases when Rydberg atoms are added, while for and 90 K, the time needed to reach a given increases when Rydberg atoms are added. Hence, the data shown in Figs. 1(a) and 1(b) show that the crossover value when K is approximately 50 K. The effect of adding atoms ( K) to UNPs with various different values is shown in Figs. 1(c) and 1(d). For plasmas that are embedded with atoms, the crossover condition is approximately K.
The estimated vertical uncertainties of the versus time curves in Figs. 1(b)-1(c) are less than , which approximately corresponds to the size of the line symbols in Figs. 1(b) and 1(c). This estimate was obtained by looking at the versus time curves for bare plasmas with K and 100 K taken over the course of one day. The standard deviation of the values at a particular time of flight for a given was found to be for data taken on one day, although it was somewhat larger, , when the data taken over the course of a week are considered. Such variations arise due to different plasma and Rydberg densities caused by different MOT atom densities, and different laser pulse energies and line widths. These effects determine the estimated long term uncertainty in . However, as described below, we always obtain TOF spectra in pairs, one of a bare plasma and one of an embedded plasma with the same , at time intervals of a minute or less. Hence, the actual uncertainties which affect our ability to distinguish the effects of adding Rydberg atoms to UNPs in the versus time curves are of the same order as the daily variation, .
We obtained electron TOF spectra like those shown in Fig. 1 for 15 different Rydberg states with values in the range 46 K () to 308 K (). Each Rydberg state was embedded into plasmas with a range of values. At least six different temperatures were used for each Rydberg state, and sometimes as many as nine temperatures were used, and we obtained duplicate data sets for two different Rydberg states taken on different days to get a sense of day-to-day variations in the data. For each , combination, we obtained an electron TOF spectrum for a plasma with no Rydberg atoms embedded, followed immediately afterwards by a spectrum from an embedded plasma. To find the crossover for the of the added Rydberg atoms, we used the two TOF spectra at each (one for the UNP with Rydberg atoms embedded, the other for the bare plasma) to find a proxy for the change in the effective initial electron temperature of the UNP when atoms are added, . Specifically, using Eq. 3
| (7) |
where is the plasma expansion velocity when Rydberg atoms are added, and is the corresponding velocity for the bare plasma (). As described in Sect. II, we cannot use the electron TOF spectra to find the . Instead, we used the proxies , and , where is the time at which . The proxy for the change in the effective initial electron temperature is thus
| (8) |
and we performed a regression of versus to find the value for which . This value is the UNP crossover electron temperature, , for the specific of the added Rydberg atoms. The uncertainties in the values () are approximately five times smaller than the change in for a bare plasma near flight times corresponding to when Rydberg atoms are added to the plasma for which is significantly different to . When is closer to , the uncertainties in become larger than the change when Rydberg atoms are added. The variations in experimental conditions which determine the uncertainties in are also manifested in the scatter of the data points, and consequently determine uncertainties of the values obtained from the regressions. We used the regression uncertainties, along with the uncertainties in the values from the Littman laser calibration, to obtain the final uncertainties in the crossover temperatures.
III.2 Crossover condition: Ion TOF spectra
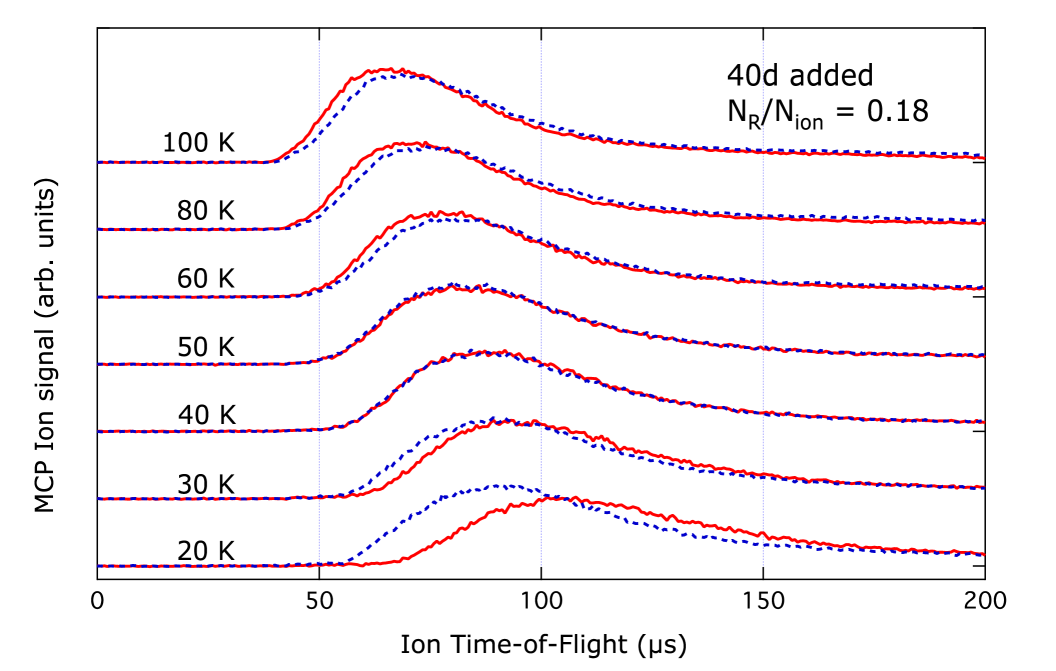
We also studied the crossover condition using the ion TOF spectra. Specifically, we looked at UNPs with , , , , and Rydberg atoms embedded in them. Spectra obtained when the state ( K) was embedded are shown in Fig. 2. As can be seen, in UNPs with K, the ions take slightly longer to reach the MCP when Rydberg atoms are embedded, indicating that the addition of Rydberg atoms to the plasma decreases . On the other hand, when K, increases when Rydberg atoms are embedded, and the crossover condition is in the range - 50 K. This is the same range for the crossover condition given by the electron TOF spectra in Fig. 1(b).
We obtained five crossover values from the ion TOF spectra, for the , , , , and states. These data were obtained with values in the range 0.2 - 0.6. Using the approach described in Ref. Forest et al. (2018), we were able to use the ion TOF spectra to obtain explicit values, and we use these to regress as defined in Eq. 7 versus (as with the electron spectra, the ion TOF spectra were obtained in pairs for a particular value, one for a plasma with Rydberg atoms added, and one with no added atoms). The values obtained by this method are subject to uncertainties which have the same origin as those which affect the electron TOF spectra, namely, shot-to-shot variations in the ion and Rydberg atom densities. However, the ion TOF spectra were averaged over 128 laser shots, and the TOF spectra were also subsequently smoothed by averaging them over five adjacent time points (the time resolution of the raw data was 128 ns). The technique of taking spectra in pairs and comparing values from ion signals which were acquired within one or two minutes of each other minimizes the impact of the shot-to-shot variations in the experimental conditions. The effect of such variations are manifested in the uncertainties of the values of obtained from the regression.
III.3 Crossover condition: Summary of results
The 15 values obtained from the electron TOF spectra and the five values obtained from the ion TOF spectra are plotted versus in Fig. 3, and are discussed in Sect. IV.2. For each experimental data point, the vertical error bar is found by adding the regression uncertainty and the K uncertainty of the experimental values in quadrature. There is essentially no uncertainty in the values since the NBPL was tuned to resonance as verified from the SFI signal (the laser line width of MHz corresponds to a 10 mK uncertainty in ).
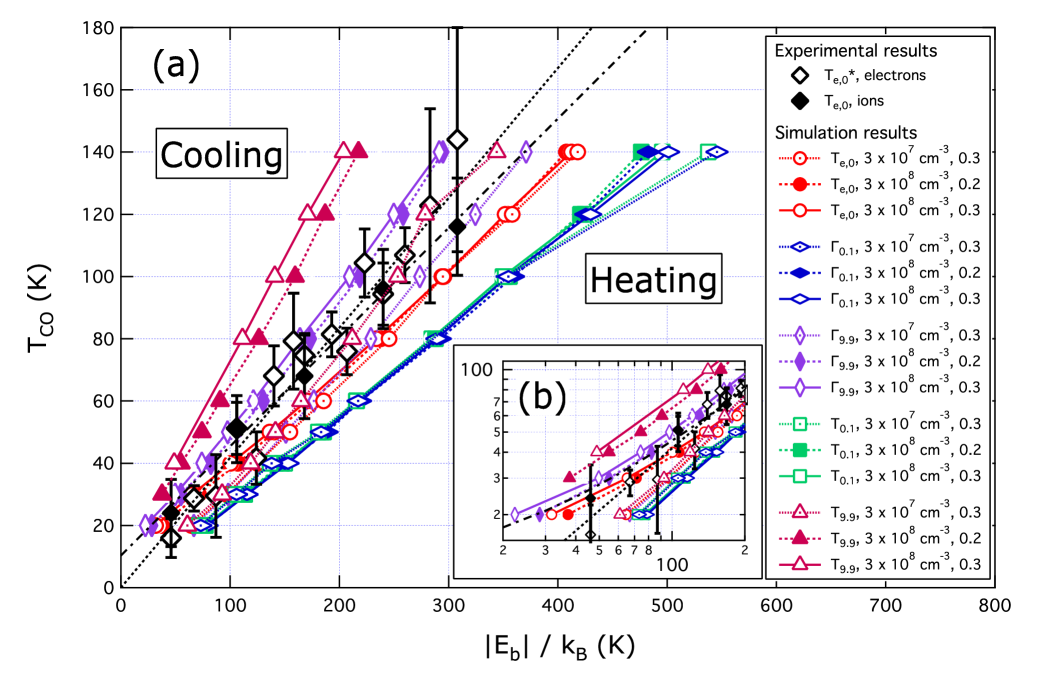
The crossover condition obtained from the electron data shown in Fig. 3 can be expressed as (intercept = K). For the ion data, the crossover condition is (intercept = K), but if the -intercept is constrained to be zero, the result is . As discussed in Sect. IV.2, the values obtained from the ion and electron TOF spectra likely correspond to slightly different measures of plasma behavior (“markers”). While the crossover values obtained from the ion spectra closely correspond to the marker, that from the electron TOF spectra may be more closely related a different marker, the Coulomb coupling parameter for the electrons. It therefore does not make sense to average these crossover behaviors together, and perhaps the most accurate summary that covers both the ion and electron experimental results is to express the crossover condition as .
III.4 Amount of heating or cooling
In the experiments where we acquired electron and ion TOF spectra to find values for the crossover values for a given , we attempted to keep the ratio , in order to minimize the possibility that the embedded Rydberg atoms would form a plasma spontaneously and independently of the co-created plasma. Unfortunately, given the sensitivity of the 780 nm fluorescence to MOT cooling and repump laser frequency drifts (which impact our ability to measure accurately), and frequency drifts of the 960 nm ECDL used to embed the Rydberg atoms, it was not always possible to maintain . Consequently, we sometimes obtained data at larger values, though we always checked that the electron and ion TOF spectra showed no evidence of spontaneous evolution of the Rydberg atoms to plasma when the Littman photoionizing laser beam was blocked. Inspection of TOF spectra obtained with showed that these UNPs evolved in a manner that was significantly decoupled from the value set by the Littman laser frequency, and the plasma expansion seemed to depend almost exclusively on the embedded Rydberg atoms. Examples of this behavior are shown in Fig. 4. In Fig. 4(a), the versus time signatures obtained from electron TOF spectra with values in the range 10 - 50 K when the state ( K) is embedded with are shown. All of these plasmas evolve such that is very close to that for a plasma with no added Rydberg atoms and K. This is close to the crossover we found as described in Sect. III.1 for a UNP embedded with atoms, which was 29 4 K. Similar behavior is apparent in the ion TOF spectra, as can be seen in Fig. 4(b), which shows plasmas embedded with atoms ( K) at . As can be seen, the TOF spectra for plasmas with embedded Rydberg atoms are almost identical, and are all similar to the UNPs with no embedded Rydberg atoms with - 80 K ( for embedded plasmas was 75 7 K).
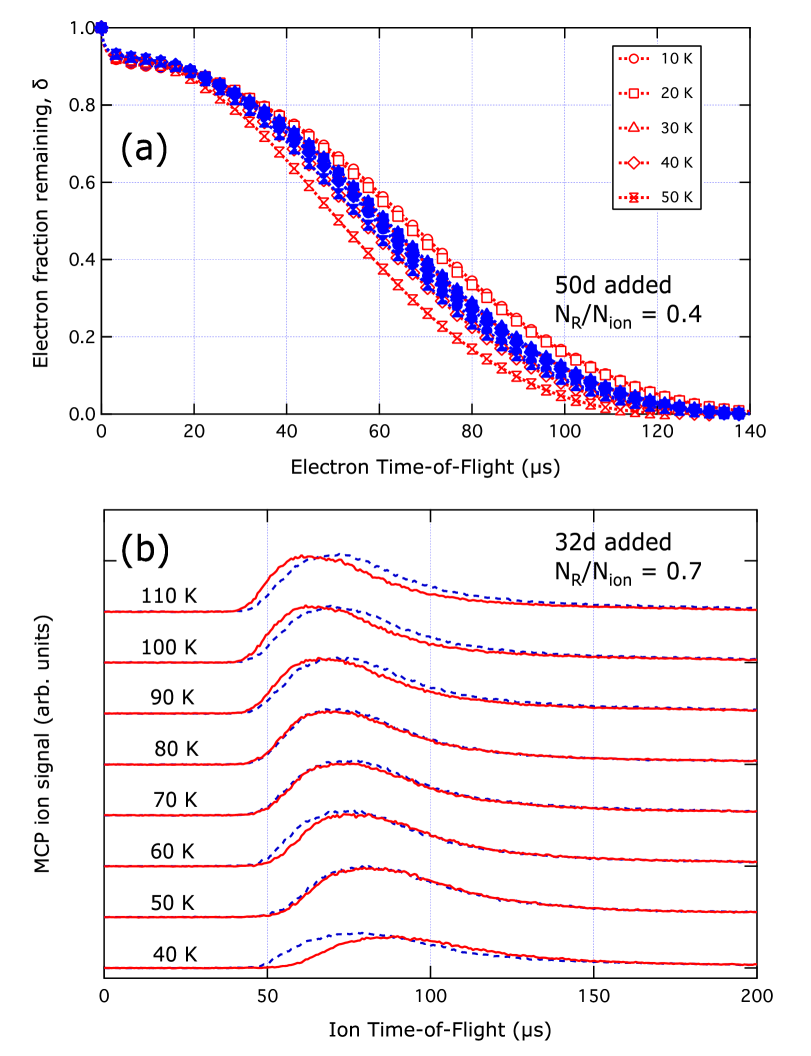
The behavior of the electron and ion TOF spectra when Rydberg atoms are embedded in UNPs with high values are clearly different from those seen at lower relative Rydberg atom densities, which are shown in Figs. 1 and 2. Specifically, at lower Rydberg atom densities, the electron and ion TOF spectra depend mostly on the set by the photoionization laser, though the plasma evolution is accelerated by adding Rydberg atoms when is less than the value for the of the added atoms, and slowed down when . On the other hand, plasmas embedded with Rydberg atoms at higher relative density evolve in a manner which is identical to the signature of an non embedded plasma with equal to the crossover value determined by the atom binding energy.
We investigated how the Rydberg atom embedded UNPs behave between these two limiting behaviors. Specifically, we looked at ion TOF spectra of UNPs embedded with atoms, and we varied from zero (no embedded Rydberg atoms) up to 0.53. The crossover for UNPs embedded with atoms was found to be 94 11 K (as described in Sect. III.2), and we used values of 40, 50, 60, 80, 120, 140, 170, and 200 K. For each of seven different values, we obtained ion TOF spectra when was set to these eight values. These spectra were then fitted using the technique described in Ref. Forest et al. (2018) to obtain values for , the plasma asymptotic expansion velocity. Then, using Eq. 3, we obtained values for the effective initial electron temperature of the embedded plasmas, , by assuming that is negligible.
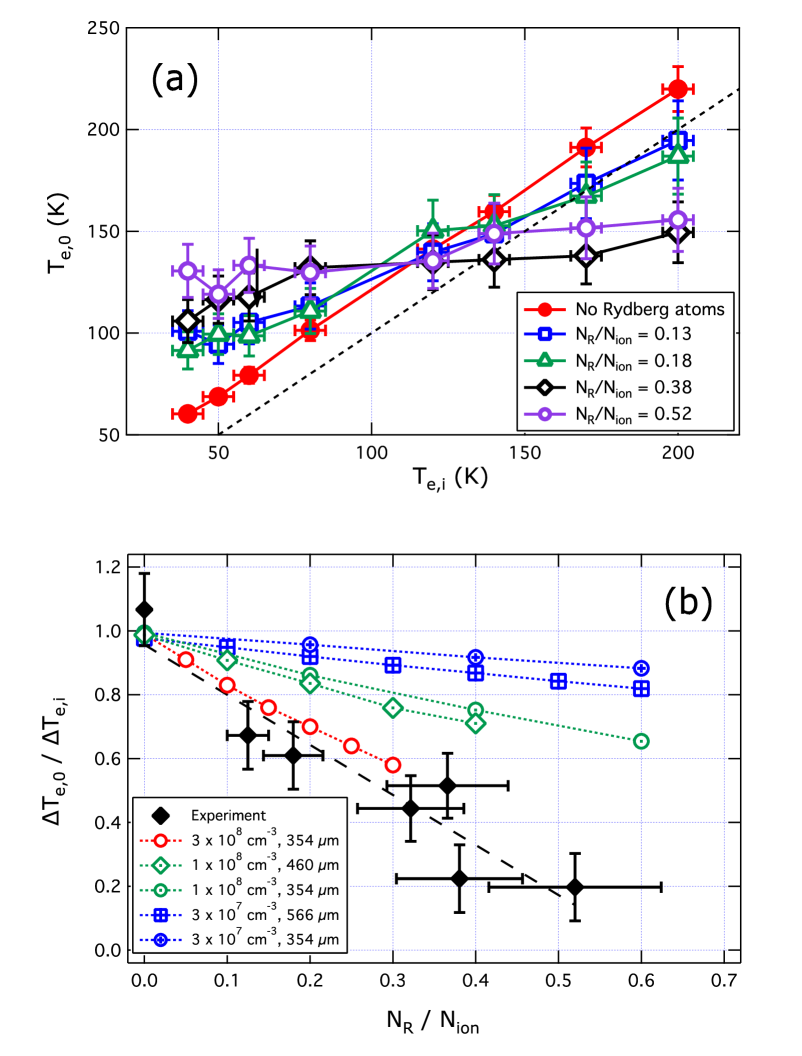
The results of this analysis are shown in Fig. 5(a), for five different values. As can be seen, the amount of cooling (that is, how much lies below the value of a bare plasma with the same ) when is above the crossover, and the amount of heating when is below the crossover value, are both approximately proportional to and to :
| (9) |
As we have described in Ref. Forest et al. (2018), there are nuances to the experimental technique used to find from the ion TOF spectra that limited the precision of the experimental values to %. This value is found from the statistical variation of the expansion velocities found by fitting the ion TOF spectra from plasmas created under nominally identical conditions. The vertical error bars in Fig. 5(a) are 10% for and 5% for the data points where (we obtained many more TOF spectra with than for embedded plasmas, giving better statistics for the values for bare plasmas). The horizontal error bars are K, which is determined by the precision of the frequency calibration of the Littman laser.
The experiments for the present paper were analyzed as described in Ref. Forest et al. (2018), and should be free of systematic effects that limit the accuracy of the results. (These effects, and their impact on the accuracy and precision of the experiments, are extensively described in Ref. Forest et al. (2018).) Nevertheless, as can be seen in Fig. 5(a), the data for exhibit a systematic offset of approximately 20 K. The data should fall on the line since TBR heating is negligible for these data (the UNP density is low and K). The 20 K offset is likely caused by an inaccurate value for the time offset when the ion TOF spectra are fitted to obtain . However, the fact that the data are offset by the same amount strongly suggests that the systematic effect is independent of . (It should be pointed out that the values of at the crossover condition found in Sects. III.1 and III.2 are not subject to uncertainty from the 20 K offset since at the crossover is found from the ionizing laser frequency when is unchanged by the addition of Rydberg atoms.) We therefore fitted the data shown in Fig. 5(a) assuming a linear dependence of on to obtain the slopes, . These slopes are shown (versus ) in Fig. 5(b), along with the results of the numerical simulations described in Sect. IV.3. The vertical error bars for the experimental data in Fig. 5(b) are determined by the vertical and horizontal error bars in Fig. 5(a) and the uncertainties of the slope values obtained from fits to the data in Fig. 5(a). The horizontal error bars are estimated as %, which is determined by the accuracy of our technique for measuring the ion and Rydberg atoms densities described in Sect. II.
IV NUMERICAL ANALYSIS
As described above, we have measured, using both electron and ion TOF spectra, values of the crossover temperature, , when UNPs are embedded with Rydberg atoms with binding energy . Additionally, we have measured the amount of heating or cooling which occurs in UNPs when Rydberg atoms are embedded, as functions of the Rydberg atom density and . We describe here the numerical modeling we have carried out to understand these experimental results and gain an intuitive understanding of their underlying plasma dynamics.
IV.1 Numerical modeling approach
We have modeled the interaction between the UNP and the Rydberg atoms using Monte-Carlo simulations described in Ref. Robicheaux and Hanson (2003). The programs, which are based on the work of Mansbach and Keck Mansbach and Keck (1969), have been used as described in Ref. Forest et al. (2018). Specifically, the simulations model the evolution of a UNP with specified initial electron temperature, average ion density, and initial radius, , as it interacts with a reservoir of embedded Rydberg atoms with average density in an state. The atoms are embedded at time , i.e., we assume that the Rydberg reservoir is created at the same instant as the UNP, and the simulations were run to a final evolution time of 20 s. We ran two kinds of simulations. First, we found the crossover electron temperatures of embedded plasmas using several different markers (measures of plasma behavior) by comparing against the same markers in bare plasmas with a specific using a variational approach in . For each , simulations in which between five and eight different states were embedded, and the value in which the embedded plasma marker was the same as for the bare plasma was found by interpolation. Secondly, we embedded plasmas with values in the range 40 to 200 K with atoms using a range of values in different simulations. The specifics of these simulations, and comparisons against the experimental data, are described below.
IV.2 Modeling the crossover condition
We ran simulations of plasmas with 20, 30, 40, 50, 60, 80, 100, 120, and 140 K. For each , we performed several sets of runs. First, we did simulations of bare plasmas () with average initial ion densities of cm-3 and cm-3. Then, we did simulations of plasmas with and 0.3 (for an average initial ion density of cm-3) and (average ion density cm-3). The simulations used m, which was limited by the maximum computing power given the densities we used. In each of the simulations with , a different Rydberg state was embedded (different values), and we embedded between five and eight different states for a given , combination. We identified five critical markers that we used to find the crossover condition: the electron temperature and electron Coulomb coupling parameter at 100 ns of evolution time, and respectively, the electron temperature and coupling parameter at 9.9 s, and respectively, as well as . That is, we find as defined using Eq. 3, assuming , and is found from the average rate of change of the characteristic plasma radius for the period 9.9 to 19.9 s of evolution time ( changes by a negligible amount over this interval Forest et al. (2018)). At each , combination, the crossover value for specific (20, 30, 40, 50, 60, 80, 100, 120, or 140 K) for a particular marker (, , , , ) is found using the following method. First, for a given , we fit the values of each of the marker parameters at discrete to a cubic spline to obtain values of that marker as a continuous function of . Then, for each marker, we found the interpolated value for which the marker had the same value as the bare plasma with the same and . The interpolated value is the crossover for the used in the simulation, and we interpret this to be equivalent to for the interpolated . Usually, there is no state at this value, so we assign an estimated uncertainty in of one half the adjacent -state spacing. This corresponds to K at K and K at K. The simulation results for the crossover conditions for the various markers are shown in Fig. 3, along with the experimental results obtained using the electron and ion TOF spectra as described above in Sects. III.1 and III.2.
It should be noted that we find the crossovers by comparing bare plasmas with an average ion density with embedded plasmas that have the same average ion density, plus an average Rydberg atom density of . The embedded plasmas therefore have a higher total number of particles than the bare plasmas, though this situation is the same as that in the experiments. We found that the crossover conditions for the markers , , and show no significant dependence on or , though both of and are quite sensitive to ion density and Rydberg atom to ion ratio. We ran additional simulations in which the crossover values for an embedded plasma with cm-3 and were found by comparing it with a bare plasma with cm-3, and found that the crossover values for , and were the same as those found when the bare plasma ion density was cm-3. (However, the crossover values for markers and were different when these two situations were compared.)
The experimental results shown in Fig. 3 agree with the simulation prediction for the crossovers for the marker. Specifically, in Sect. III.3, we summarized the ion and electron results as , while the simulation prediction is . However, the simulation crossover condition for the marker is in the range (this simulation result is sensitive to ion density and ). On the other hand, the and crossover simulations substantially agree with each other (), but are significantly above the experimental results for the crossovers. Additionally, the simulations for the crossovers have significant dependence on and , but for the conditions that are the most similar to those of the experiment ( cm-3, ) the crossover trend is very similar to the experimental crossover behavior.
IV.3 Modeling the amount of heating or cooling
We also simulated the change in that occurred when the number of Rydberg atoms added to the UNP was changed. Specifically, we looked at plasmas with average ion densities cm-3, cm-3, and cm-3, and for each density, we varied from 0 to 0.3 (for the highest ion density) to as much as 0 to 0.6 (the lowest ion density). The range of values at a given ion density was again limited by available computing power. At each of the two lower densities, we also looked at the effect of changing , though changing this parameter changed the results for a given density only slightly. At each ion density and value, we evolved plasmas with between four and eight different values in the range 40 to 200 K. From the results of each simulation, we found as defined in Eq. 3 from the value averaged over the interval 9.9 - 19.9 s of plasma evolution time ( is found from the change in over this interval). We then did a linear regression of versus to find the slope , i.e., we used the same protocol as we used for the experimental data as described in Sect. III.2 above. These values are plotted versus , along with the experimental data, in Fig. 5(b). The vertical error bars of the simulation data in Fig. 5(b) are comparable to the size of the line symbols, and are determined solely by the uncertainty in the fit value of the slope of versus . The simulation results in Fig. 5(b) have no horizontal error bars since the values are input parameters in the simulations. As can be seen, there is good agreement of the experimental data, taken with average ion density cm-3, with the numerical simulations obtained when the ion density is set to cm-3. While we were unable to run the simulations with the same that was used in the experiments (this was m), the variation in the model results as was changed at lower density seen in Fig. 5(b) suggests the simulation would be in even stronger agreement with the experimental results had m been used.
V Discussion
There is good agreement of the numerical simulation results with the experiment for both the variation of the crossover temperatures derived from with and for the dependence of on when atoms are added to a UNP. In this section, we will consider the underlying plasma processes which lead to these results.
The interaction of a plasma with a co-existing reservoir of neutral atoms has been considered in many theoretical and numerical studies Mansbach and Keck (1969); Vriens and Smeets (1980); Stevefelt et al. (1975); Kuzmin and O’Neil (2002); Pohl et al. (2008); Bannasch and Pohl (2011). In particular, the programs we have used to obtain the numerical results are derived from the work of Mansbach and Keck (herein abbreviated as MK) Robicheaux and Hanson (2002, 2003). Specifically, the probabilities for Rydberg excitation and de-excitation due to electron collisions used in the Monte-Carlo calculations are based on Eqs. III.12 in Ref. Mansbach and Keck (1969), though the programs additionally include the effect of radiative decay, which was considered only briefly by Mansbach and Keck. However, radiative decay plays only a minor role under most of the experimental conditions we used. For all the experimental data points in Fig. 3 with K, the collisional de-excitation rate was at least 10 times larger than the radiative decay rate for the values and electron densities used, though for the lowest state we investigated (, for which K), the collisional rate was only 2.4 times the radiative rate Mansbach and Keck (1969); Robicheaux and Hanson (2003) at K. On the other hand, for all the experimental data in Fig. 5, the collisional de-excitation rate was at least 30 times the radiative rate (for , with average electron density cm-3, and at the maximum = 200 K).
V.1 Crossover temperature,
If one neglects radiative decay, the equations presented by MK may be used to find the crossover condition where the presence of the embedded Rydberg atoms leaves the plasma unperturbed. Specifically, using Eqs. III.12 in Ref. Mansbach and Keck (1969), one can find the mean change in the energy of a Rydberg atom with energy (where ) due to electron collisions when the plasma electron temperature is . When the collision results in excitation of the Rydberg atom, , but when the collision results in the atom losing energy, . The value for which there is no net transfer of energy from the Rydberg atoms to the electrons is when , which occurs when . This is very close to what we obtain for the crossover trend in the experimental data and the simulation results when the marker under consideration is . Specifically, the crossover temperatures obtained from the ion TOF spectra follow the relationship (when the intercept is unconstrained) and from the electron TOF spectra.
There are several aspects of this result that warrant further scrutiny. Probably the most significant consideration is the question of why the crossover binding energy of the embedded Rydberg atoms when is the marker quantity is not the same as the bottleneck energy. A major finding of MK, which has been reproduced in numerous other theoretical analyses Vriens and Smeets (1980); Stevefelt et al. (1975); Kuzmin and O’Neil (2002); Pohl et al. (2008); Bannasch and Pohl (2011), is the existence of a bottleneck in the Rydberg state distribution of atoms in equilibrium with a plasma with electron temperature . The energy of the bottleneck given in Ref. Mansbach and Keck (1969) is (other analyses give a slightly different numerical factor), and atoms with binding energy such that are more likely to be excited than de-excited as a result of a single electron-atom collision, and will ultimately ionize, and such collisions will cool the plasma electrons. On the other hand atoms with are likelier to de-excite, and will ultimately decay radiatively or collisionally until their effect on the plasma is negligible. The energy lost by the atom in de-excitation collisions will heat the plasma electrons. One might therefore expect that adding Rydberg atoms with binding energy equal to the bottleneck energy that is characteristic of the electron temperature in the plasma would have no net heating or cooling effect on the plasma, yielding a crossover condition .
In the simulation results for the crossover condition when the markers and are used, we see a trend () that is very similar to that predicted on the basis of the argument that the crossover binding energy is equal to the bottleneck energy. The same result was found in the theoretical analysis presented in Ref. Pohl et al. (2006), which considered the effect of adding Rydberg atoms to cold plasmas made from cesium atoms. Specifically, in Fig. 3(b) in Ref. Pohl et al. (2006), adding ( K) atoms to a plasma with K resulted in no significant change in the plasma electron temperature from that of an unperturbed UNP during the first 600 ns of plasma evolution, although after 600 ns, the electron temperature of the embedded plasma becomes larger than that of the bare plasma. Indeed, by an evolution time of 1 s, the electron temperature of the bare plasma is very similar to that of a plasma embedded with atoms ( K). Adapting these results to our formalism of a crossover condition gives when the marker is the electron temperature from 0 to 600 ns of evolution time ( result), but when the marker is the electron temperature at 1 s of evolution time ( result). The data shown in Fig. 3(b) in Ref. Pohl et al. (2006) suggest that the plasma expansion velocity at evolution times s for a bare plasma would be more similar to that embedded with atoms than to a plasma embedded with atoms, a finding similar to our own experimental results from the ion TOF spectra, and our simulations when is the marker quantity.
Our experimental results from the ion TOF spectra, and our simulations, as well as the numerical modeling presented in Ref. Pohl et al. (2006), show that the crossover electron temperature for marker follows the relationship rather than what is expected using the argument presented above. However, our result is actually consistent with the bottleneck argument. As described above in Sect.I, there is a distinction between , the effective initial electron temperature which is related to by Eq. 3, and , the electron temperature set by the ionization laser frequency (Eq. 2). Generally, is larger that due to TBR, DIH, and electron-Rydberg scattering. It is this latter process that makes the crossover condition different from that which is equivalent to adding Rydberg atoms with binding energy equal to the bottleneck energy. Specifically, when one adds Rydberg atoms with , half will ultimately ionize, and half will be scattered into states bound by more than the bottleneck energy. Consequently, there will be an excess population of down-scattered Rydberg atoms with . Collisions between the electrons and these atoms result in more down-scattering events than collisions which increase the Rydberg atom energy. Thus, the net effect of the excess atom population with is that the plasma electrons will be heated, and this presumably leads to the increase in the electron temperature after 600 ns seen in Fig. 3(b) in Ref. Pohl et al. (2006) and to an increase in . On the other hand, when one adds Rydberg atoms with , more than half will ionize, but the average energy of the down-scattered Rydberg atoms is , i.e., the same as the bottleneck energy for a plasma with electron temperature . Subsequent scattering events of electrons with the resulting Rydberg reservoir with average energy will change the plasma electron temperature only if the population distribution of the down-scattered embedded Rydberg atoms is significantly different from the distribution in a bare plasma.
A second consideration with regard to our experimental results, and our simulations, is why there is a difference in the bottleneck condition when derived from the electron TOF spectra is used as the marker, rather than from the ion TOF spectra. This is likely due to the fact that the model described in Ref. Twedt (2012) which we used to obtain the proxy as described in Sect. III.1, assumes the electrons are a zero-temperature fluid, i.e., they just leak across the top of the barrier formed by the average potential due to the ions and electrons in the UNP and the external electric field. This is clearly unrealistic: The electrons evaporate out of the plasma, and so the proxy is likely more similar to in its behavior than it is to , since is the ratio of the mean electron electrostatic interaction energy to the electron thermal kinetic energy. Indeed, the crossover behavior obtained from the electron TOF spectra has some similarity to the simulation results for the marker , though the crossover values found using this quantity (like those using ) are very sensitive to the ion density and values used in the simulations.
To summarize, we find the results of the experiments and the numerical simulations of the crossover condition for the marker are well explained using the equations for excitation and de-excitation of Rydberg atoms due to electron collisions presented in Ref. Mansbach and Keck (1969). Specifically, in the experiments the crossover between cooling and heating of a plasma with an initial electron temperature by net energy transfers to or from the Rydberg reservoir is when the binding energy is such that . The corresponding result from the numerical simulations is . Using the equations in MK Mansbach and Keck (1969), the condition for zero net exchange of energy between the Rydberg atoms and the plasma electrons with temperature is . This latter condition does not change significantly when revised electron-atom collision rate equations from a more recent study by Pohl et al., are used, as described below in Sect. V.3 Pohl et al. (2008).
V.2 Amount of heating
We can also use the mean energy transfer to or from the plasma electrons caused by electron-Rydberg collisions from MK to understand the experimental results described in Sect. III.4. Specifically, the mean amount of heating of the plasma electrons that results from a single de-excitation collision is , and the mean amount of cooling due to a single atom excitation collision is . Thus, the net thermal energy transferred to the plasma by a single electron-Rydberg collision is
| (10) |
where we have used the equality . That is, is the crossover temperature appropriate to the particular Rydberg state being embedded, and we are assuming that the appropriate crossover marker is that for since we are looking at the effect that adding Rydberg atoms to the UNP has on the plasma expansion velocity.
We can now estimate the effect of these collisions on the plasma expansion. We assume an initial situation where we have electrons in the plasma at an initial temperature , giving an initial electron thermal energy of . Our argument neglects the thermal energy of the ions, since the maximum ion temperature is of order 1 K Killian et al. (2007). We also do not explicitly include the binding energy of the Rydberg atoms; rather, we just consider the extent to which the change in the energy of the Rydberg atoms heats the electrons via Eq. 10. The electrons are heated by collisions with an initial number Rydberg atoms over the course of the plasma evolution, resulting in a final situation late in the plasma evolution when almost all of the electron thermal energy has been converted to radial outward motion of the ions. We will assume that the number of Rydberg atoms which ionize is , so that the number of electrons at the end of the evolution is . The final energy of the system in this case is
| (11) | |||||
where the is the number of electron collisions each Rydberg atom experiences during the plasma evolution and the last term on the second line is the kinetic energy due to the radial motion of the ions late in the plasma evolution. (The parameter relates an ion’s outward velocity at time to its position relative to the center of the plasma, , Killian et al. (2007); Pohl et al. (2004b).) Averaged over the Gaussian spatial distribution of the ions, and in the limit where , Killian et al. (2007); Forest et al. (2018).
Strictly, Eq. 11 is valid only in the limit where , which would leave the Rydberg state distribution relatively unaffected by collisions with the plasma electrons. Additionally, if , the electron temperature change is small during the period in which the electron-Rydberg atom collisions occur, so one can change from Eq. 10 to be in the term in Eq. 11. (The period in which most of the electron-Rydberg atom collisions occur is limited to the first few s of plasma evolution - as the plasma expands, the electron density in the central region falls rapidly, causing the collision rate to fall.) We will consider the validity of the assumption , and the consequences when it is not valid, below. Finally, we will neglect the term in Eq. 11 in comparison with the term. That is, we are assuming adiabatic expansion has converted almost all of the electron thermal energy into outward motion of the ions.
Solving Eq. 11 with these assumptions, and using Eq. 10, we obtain the relationship
| (12) |
We will make one further simplification, which is to assume that a negligible fraction of the embedded Rydberg atoms ionize, so we can set . (After making this approximation, it is immediately obvious that Eq. 12 reproduces the experimental behavior described by Eq. 9.) Obviously, this approximation is very good when , since the difference between and in this case is due only to TBR. Variations in the ratios and with when certainly occur in the numerical simulations, and the error introduced by assuming that the ion number is constant is on the order of 20% at the highest ion density and ratio we looked at. However, we cannot decouple changes in and when is changed in the experimental results. It therefore makes sense to assume is constant, since doing so does it alter the major conclusions of our analysis.
Expressing Eq. 12 as a derivative relationship assuming constant and no significant variation of with , we obtain
| (13) |
For bare plasmas, , and thus (there will be a small difference in the two due to TBR which we ignore), so . For embedded plasmas , but any effect due to being different from is masked because the second term on the right side of Eq. 13 is non-zero. Additionally, the term “” in Eq. 13 should be , but again, variations in this latter term that depend on or cannot be isolated from the experimental results.
Before we compare Eq. 13 with the results shown in Fig. 5, it is worth considering two assumptions about that were used in deriving the equation. The first is that has no significant dependence on , and the second is that . Mansbach and Keck give an equation for the total collision rate of electrons with each Rydberg atom in an initial state with energy when the electron temperature is , , where (Eq. III.14 in Ref. Mansbach and Keck (1969)). For our experiment we use values K and such that K (for the embedded atoms), and for this range of parameters, increases by a factor of 2 as is changed from 40 K to 200 K at fixed electron density. On the other hand, as increases, the electron density falls more quickly. Specifically, at the center of the UNP, the time for the density to fall to 50% of the initial value is (strictly, the proportionality is valid only if there is no heating or cooling of the electrons). The number of electron collisions experienced by each Rydberg atom during the time the density falls to half its initial value is thus constant within 20% for K, and each atom experiences collisions in this time for an initial electron density of cm-3. Our assumption that is not valid for the experimental data shown in Fig. 5, though it likely is acceptable for the lowest density we ran in the simulations shown in the figure, cm-3.
There are two main consequences when with regard to Eq. 13. First, the binding energy for most atoms will differ significantly from the initial value, and so it cannot be assumed that in Eq. 12 is constant. Second, the electron temperature will change significantly from . The term we have written as in Eq. 12 is actually some sort of ensemble average of , where is the Rydberg binding energy at time , and is the corresponding electron temperature. However, the net effect of electron-Rydberg atom collisions is that , as can be seen in the data in Figs. 4 and 5(a). Practically, this means that the second term on the right hand side of Eq. 13 cannot exceed unity in magnitude (i.e., the maximum amount of heating or cooling is limited by the value set by the binding energy of the added Rydberg atoms), and when comparing Eq. 13 with the experimental data and simulations, the value of obtained will be a significant underestimate in the region where .
Despite these significant simplifications, Eq. 13 describes well the behavior we see in the experimental data and the numerical simulations for the dependence on the slope of the versus graph with . The experimental data points, obtained at an average ion density of cm-3 agree with the numerical simulations for a density of cm-3 within the experimental uncertainty, and when comparing simulation results at lower density for different , the agreement would be even better had the simulations been run at the same value as for the experiment. For the experimental data shown in Fig. 5(b), using Eq. 13, the slope of with is , which suggests a value of . However, as noted above, this is an underestimate due to the fact that the mean Rydberg atom energy and the electron temperature change during the co-evolution of the UNP and the Rydberg reservoir. Again, this is in line with the estimate of during the time the electron density falls by 50% based on MK Eq. III.14. In comparing the simulation results obtained using m and the three different initial ion densities in the ratio 1 : 3.3 : 10 (the initial ion density is the same as the initial electron density), the slopes of the graphs are in the ratio 1 : 3.0 : 7.2, showing that successive electron-Rydberg atom collisions become less effective at heating or cooling the plasma when the density increases due to the convergence of the mean Rydberg atom energy and the electron temperature. Finally, the slope of the simulation result for an average ion density of cm-3 (for this density, we expect Eq. 13 will have the greatest accuracy of all the densities we simulated) and m gives , which is similar to the value we get using MK Eq. III.14 at this density in the time density drops to half its initial value (maximum and minimum values at K, at K).
V.3 Sensitivity of numerical results to model assumptions
The work of Mansbach and Keck is now almost 50 years old. A more recent numerical study by Pohl et al. Pohl et al. (2008) found that the MK equations significantly underestimate the rate of small energy transfer collisions, although they also found the MK rates to be accurate for moderate to large energy transfer collisions. We have tested the robustness of our findings regarding the crossover temperature and the amount of heating or cooling when Rydberg atoms are added to a UNP by estimating the mean change in the Rydberg atom energy based on the equations of Pohl et al. The strong maxima in the excitation and de-excitation collision rates in the region (where is the change in the Rydberg atom energy) reduce significantly both the average increase in Rydberg atom energy (and consequent cooling effect on the UNP) and average decrease in Rydberg atom energy due to collisions. For example, for a Rydberg atom with same binding energy as the state ( K) and K, the mean energy increase is (rather than the MK prediction of ), and the mean decrease is (the MK prediction is ). However, the up/down energy changes are equal at a crossover temperature such that , rather than the MK prediction of . The crossover prediction based on the rates in Ref. Pohl et al. (2008) change with , and for K, one obtains . (On the other hand, the multiplication factor changes only from 2.9 to 3.3 over the range K.) The primary consequences with regard to our study of the collision rates reported by Pohl et al. being different from those given by MK are that should depend in some way on , and that for a given , should be found in the experiment by incrementing until the condition is found, rather than doing a linear regression of with . However, given the experimental uncertainty inherent in the measurement techniques used to obtain the data in Figs. 3 and 5, our experimental values and associated uncertainty ranges likely encompass any of the potential variations that are manifestations of effects based on the collision rate equation in Ref. Pohl et al. (2008). In other words, our experimental results are consistent with both the MK collision rate equations as well as those of Pohl et al. Using the equations of Pohl et al., more collisions are needed to give a certain amount of heating or cooling, but they also predict higher collision rates for small energy transfers than MK anyway, so the fundamental prediction is the same as that based on the equations presented by MK Mansbach and Keck (1969).
VI CONCLUSION
We have demonstrated experimentally both heating and cooling of electrons in UNPs using Rydberg atoms which are embedded in the plasma at its creation. The experimental behavior of the crossover between heating and cooling, and the amount of heating or cooling that can be achieved, are in agreement with the results of Monte-Carlo simulations. In particular, a significant degree of cooling can be achieved. In our experiment, when we added atoms to plasmas with K at an initial ion density of cm-3, the effective initial electron temperature changed to K, a decrease of 30% from the value for a bare plasma. While the simulations for this situation showed a more modest decrease in of 20%, the numerical modeling results show that the changes in are correlated with changes in . For instance, in the experiments where we added atoms to UNPs with K when at an ion density of cm-3, the Coulomb coupling parameter at an evolution time of ns, , increased from 0.009 to 0.0096, and at s, increased from 0.037 to 0.044. (For the same conditions with K, the values decreased by similar percentages.)
Unfortunately, while the decrease on values we have observed experimentally and the corresponding increase in values seen in the simulations when Rydberg atoms are added to cold plasmas are significant, the utility of the technique in reaching the strongly coupled regime for electrons in a UNP is not demonstrated by our results. The most favorable situation we investigated in the simulations was adding atoms ( K) to UNPs with K, for which increased from 0.09 to 0.15 when and cm-3. To date, one of the largest experimental values that has been reported is for a UNP with K and cm-3 Chen et al. (2017). It is possible that our technique could reach a comparable starting from a higher than 0.1 K and using a higher density. However, this would increase TBR, and it is not clear that adding Rydberg atoms to a UNP could significantly counteract this source of heat for plasma electrons. Additionally, the smaller the values of would require smaller values for the added Rydberg atoms, given the requirement that for the atoms to achieve cooling of the plasma electrons. Finally, as the value of gets smaller, such atoms would spontaneously evolve to plasma more rapidly, even at low density. This would inevitably lead to plasmas in which the electron properties are much more significantly determined by the parent Rydberg atom ensemble, rather than than those of the UNP created by photoionization. In particular, such Rydberg plasmas seem to have a fundamental limit where Forest et al. (2018) for densities in the range to cm-3.
VII ACKNOWLEDGEMENTS
The following former Colby undergraduates worked on preliminary experiments to those described here: J. L. Carini, L. P. Rand, C. Vesa, and R. O. Wilson. In addition, significant improvements to the apparatus were made by D. B. Branden and S. E. Galica. We are deeply indebted to K. A. Twedt for sharing the program described in Ref. Twedt and Rolston (2010) and advice on how to run it. In addition, we acknowledge extensive discussions with T. F. Gallagher, who first suggested this experiment and provided an equipment loan, C. W. S. Conover, and A. L. Goodsell. Preliminary experiments were carried out with an equipment loan from D. M. Thamattoor. D. A. T. acknowledges support from Colby College through the Division of Natural Sciences grants program, and from the National Science Foundation (1068191). F. Robicheaux was supported in part by the US Department of Energy (DE-SC0012193).
References
- Killian et al. (1999) T. C. Killian, S. Kulin, S. D. Bergeson, L. A. Orozco, C. Orzel, and S. L. Rolston, Phys. Rev. Lett. 83, 4776 (1999).
- Killian et al. (2007) T. Killian, T. Pattard, T. Pohl, and J. Rost, Phys. Rep. 449, 77 (2007).
- Lyon and Rolston (2017) M. Lyon and S. L. Rolston, Rep. Prog. Phys. 80, 017001 (2017).
- Morrison et al. (2008) J. P. Morrison, C. J. Rennick, J. S. Keller, and E. R. Grant, Phys. Rev. Lett. 101, 205005 (2008).
- Schulz-Weiling et al. (2016) M. Schulz-Weiling, H. Sadeghi, J. Hung, and E. Grant, J. Phys. B 49, 193001 (2016).
- Robinson et al. (2000) M. P. Robinson, B. Laburthe Tolra, M. W. Noel, T. F. Gallagher, and P. Pillet, Phys. Rev. Lett. 85, 4466 (2000).
- Li et al. (2004) W. Li, M. W. Noel, M. P. Robinson, P. J. Tanner, T. F. Gallagher, D. Comparat, B. Laburthe Tolra, N. Vanhaecke, T. Vogt, N. Zahzam, P. Pillet, and D. A. Tate, Phys. Rev. A 70, 042713 (2004).
- Forest et al. (2018) G. T. Forest, Y. Li, E. D. Ward, A. L. Goodsell, and D. A. Tate, Phys. Rev. A 97, 043401 (2018).
- Pohl et al. (2004a) T. Pohl, T. Pattard, and J. M. Rost, Phys. Rev. Lett. 92, 155003 (2004a).
- Chen et al. (2017) W.-T. Chen, C. Witte, and J. L. Roberts, Phys. Rev. E 96, 013203 (2017).
- Gupta et al. (2007) P. Gupta, S. Laha, C. E. Simien, H. Gao, J. Castro, T. C. Killian, and T. Pohl, Phys. Rev. Lett. 99, 075005 (2007).
- Mansbach and Keck (1969) P. Mansbach and J. Keck, Phys. Rev. 181, 275 (1969).
- Chen et al. (2004) Y. C. Chen, C. E. Simien, S. Laha, P. Gupta, Y. N. Martinez, P. G. Mickelson, S. B. Nagel, and T. C. Killian, Phys. Rev. Lett. 93, 265003 (2004).
- Kulin et al. (2000) S. Kulin, T. C. Killian, S. D. Bergeson, and S. L. Rolston, Phys. Rev. Lett. 85, 318 (2000).
- Simien et al. (2004) C. E. Simien, Y. C. Chen, P. Gupta, S. Laha, Y. N. Martinez, P. G. Mickelson, S. B. Nagel, and T. C. Killian, Phys. Rev. Lett. 92, 143001 (2004).
- Gorman et al. (2018) G. Gorman, T. Langin, and T. Killian, Bull. Am. Phys. Soc. 63, 138 (2018).
- Bannasch et al. (2013) G. Bannasch, T. C. Killian, and T. Pohl, Phys. Rev. Lett. 110, 253003 (2013).
- Kuzmin and O’Neil (2002) S. G. Kuzmin and T. M. O’Neil, Phys. Plasmas 9, 3743 (2002).
- Hahn (2002) Y. Hahn, Phys. Lett. A 293, 266 (2002).
- Robicheaux and Hanson (2002) F. Robicheaux and J. D. Hanson, Phys. Rev. Lett. 88, 055002 (2002).
- Fletcher et al. (2007) R. S. Fletcher, X. L. Zhang, and S. L. Rolston, Phys. Rev. Lett. 99, 145001 (2007).
- Morrison et al. (2009) J. P. Morrison, C. J. Rennick, and E. R. Grant, Phys. Rev. A 79, 062706 (2009).
- Vanhaecke et al. (2005) N. Vanhaecke, D. Comparat, D. A. Tate, and P. Pillet, Phys. Rev. A 71, 013416 (2005).
- Pohl et al. (2006) T. Pohl, D. Comparat, N. Zahzam, T. Vogt, P. Pillet, and T. Pattard, Eur. J. Phys. D 40, 45 (2006).
- Vriens and Smeets (1980) L. Vriens and A. H. M. Smeets, Phys. Rev. A 22, 940 (1980).
- Stevefelt et al. (1975) J. Stevefelt, J. Boulmer, and J. F. Delpech, Phys. Rev. A 12, 1246 (1975).
- Pohl et al. (2008) T. Pohl, D. Vrinceanu, and H. R. Sadeghpour, Phys. Rev. Lett. 100, 223201 (2008).
- Bannasch and Pohl (2011) G. Bannasch and T. Pohl, Phys. Rev. A 84, 052710 (2011).
- Branden et al. (2010) D. B. Branden, T. Juhasz, T. Mahlokozera, C. Vesa, R. O. Wilson, M. Zheng, A. Kortyna, and D. A. Tate, J. Phys. B 43, 015002 (2010).
- Littman and Metcalf (1978) M. G. Littman and H. J. Metcalf, Appl. Opt. 17, 2224 (1978).
- Trickl et al. (2007) T. Trickl, A. H. Kung, and Y. T. Lee, Phys. Rev. A 75, 022501 (2007).
- Harvey and Stoicheff (1977) K. C. Harvey and B. P. Stoicheff, Phys. Rev. Lett. 38, 537 (1977).
- Han and Gallagher (2009) J. Han and T. F. Gallagher, Phys. Rev. A 79, 053409 (2009).
- Twedt and Rolston (2010) K. A. Twedt and S. L. Rolston, Physics of Plasmas 17, 082101 (2010).
- Robicheaux and Hanson (2003) F. Robicheaux and J. D. Hanson, Phys. Plasmas 10, 2217 (2003).
- Twedt (2012) K. A. Twedt, Electron Distribution and Electrostatic Oscillations of an Ultracold Plasma, Ph.D. thesis, University of Maryland (2012).
- Pohl et al. (2004b) T. Pohl, T. Pattard, and J. M. Rost, J. Phys. B 37, L183 (2004b).