Galaxy Ellipticity Measurements in the Near-Infrared for Weak Lensing
Abstract
We investigate the value of the near-infrared imaging from upcoming surveys for constraining the ellipticities of galaxies. We select galaxies between that are brighter than expected Euclid sensitivity limits from the GOODS-S and N fields in CANDELS. The co-added CANDELS/HST V+I and J+H images are degraded in resolution and sensitivity to simulate Euclid-quality optical and near-infrared (NIR) images. We then run GALFIT on these simulated images and find that optical and NIR provide similar performance in measuring galaxy ellipticities at redshifts . At , the NIR-selected source density is higher by a factor of 1.4 and therefore the standard error in NIR-derived ellipticities is about 30% smaller, implying a more precise ellipticity measurement. The good performance of the NIR is mainly because galaxies have an intrinsically smoother light distribution in the NIR bands than in the optical, the latter tracing the clumpy star-forming regions. In addition, the NIR bands have a higher surface brightness per pixel than the optical images, while being less affected by dust attenuation. Despite the worse spatial sampling and resolution of Euclid NIR compared to optical, the NIR approach yields equivalent or more precise galaxy ellipticity measurements. If systematics that affect shape such as dithering strategy and point spread function undersampling can be mitigated, inclusion of the NIR can improve galaxy ellipticity measurements over all redshifts. This is particularly important for upcoming weak lensing surveys, such as with Euclid and WFIRST.
1 Introduction
Weak gravitational lensing (WL) is a slight deflection of light rays from distant galaxies when they propagate through the tidal gravitational field of intervening large scale structure. The amplitude of the WL distortion can be used to map dark matter and measure dark energy by statistically quantifying the shear distortions encoded in the observed shapes of background galaxies, namely galaxy ellipticities (e.g. Kaiser et al., 1995; Bartelmann & Schneider, 2001). The ellipticities of galaxies are typically distorted only about a per cent by WL (Troxel & Ishak, 2015), so the WL signal in individual galaxies is challenging to detect. WL measurements thus rely on averaging over a very large sample to obtain the distortions and sufficiently unbiased estimates of galaxy shapes, which in turn require a correction for the impact of the point spread function (PSF) of the telescope. In that sense, WL observations demand high quality images because it requires a large number density of resolved galaxies and high signal-to-noise ratio (SNR), while minimizing the PSF corrections and related systematic uncertainties, with well-sampled PSFs (Massey et al., 2013; Schrabback et al., 2018).
Euclid (Laureijs et al., 2011) is a survey mission designed to understand the expansion and growth history of the Universe, and is scheduled to launch in the next decade. Euclid will image 15,000 deg2 of sky in one broad optical band VIS spanning 550 to 920 nm, and three additional near-infrared (NIR) bands (, , and ). Euclid will detect cosmic shear with VIS by measuring ellipticities of resolved galaxies per arcmin2 with a resolution better than 0.18 (PSF FWHM) with 0.1 pixels. The near-infrared bands will primarily be used to derive photometric redshifts for the weak lensing sample, in conjunction with ground-based observations at visible wavelengths. The Euclid wide survey is expected to provide WL galaxy shape measurements for 1.5 billion galaxies with space-quality resolution.
To measure WL through surveys, one should measure galaxy ellipticities and its uncertainty, including systematics, very accurately. In particular, it is necessary to measure the shapes of typically faint and small, distant galaxies with high-SNR observations. In this work, we demonstrate that NIR bands result in a comparable or more precise galaxy ellipticity measurement compared to optical bands for WL studies despite their worse spatial resolution (0.3 compared to 0.18) and pixel sampling (0.3 vs. 0.1 pixel scale). There are several advantages to using NIR bands (Tung & Wright, 2017); first, NIR wavelengths sample the rest-frame optical light, which traces the older stellar population (hence the bulk of stellar mass) and is less affected by dust extinction. The VIS band covers the rest-frame UV and blue wavelengths, which predominantly traces emission from star-forming regions (Dickinson, 2000). In particular, the shapes of galaxies as seen in the rest-frame UV are more clumped and irregularly distributed than older stellar populations. The second advantage is that galaxies in the NIR bands have an intrinsically smoother light distribution resulting in a lower shape noise than in the optical (Schrabback et al., 2018). Third, NIR images of galaxies have a higher surface brightness with more than nine times the number of source photons per pixel, based on a calculation using images in this study; this is at least partly due to the relative importance of the bulge compared to the disk as a function of wavelength. Finally, we find that the NIR bands are sensitive to a larger number density of distant galaxies than the VIS band (see Section 2).
In this paper, we study the shapes of the galaxy sample expected from Euclid-quality imaging and forecast how we can improve the shape measurement by using co-added NIR images111The simulated Euclid images in this paper do not have Euclid-specific systematics dealing with dither strategy, field distortion, PSF variations and intrapixel quantum efficiency variations which will be investigated in the future. However, it should be noted that these affect both optical and near-infrared images.. To do that, we select galaxies from HST/CANDELS (Cosmic Assembly Near-infrared Extragalactic Legacy Survey; Grogin et al. (2011); Koekemoer et al. (2011)) observations satisfying the Euclid sensitivity limits and simulate Euclid-resolution images. The structure of this paper as follows. The sample selection using CANDELS data is introduced in Section 2. We describe the procedure of simulating Euclid-quality optical and NIR images from HST images in Section 3. In Section 4, we explain how GALFIT (Peng et al. 2010) is used to measure the ellipticity of galaxies after accounting for the PSF, and compare the ellipticities obtained from GALFIT in simulated-Euclid and CANDELS images. Finally, we present our conclusions in Section 5.
2 Initial Sample Selection
We select a sample of galaxies at optical and near-infrared (NIR) wavelengths from the HST/CANDELS survey that closely resembles the Euclid weak lensing (WL) sample. Among the five CANDELS fields, we use the GOODS-S and GOODS-N fields which include the CANDELS Deep survey and covers about 340 in V (0.606), I (0.814), J (1.25), and H (1.6). These fields are several magnitudes deeper than the Euclid survey. We use CANDELS photometric redshifts measured for all galaxies by Dahlen et al. (2013), unless spectroscopic redshifts are available. For the WL shape measurement, the Euclid survey will detect galaxies in a broad optical R+i+z band (VIS: 0.55–0.92) down to 24.5 mag (10 ). It will use three additional NIR bands (Y, J, H in the range of 0.92–2.0 ) reaching AB mag 24 (5 ) in each. To achieve the required dark energy figure of merit through weak lensing, the surface density of resolved galaxies needs to be at least 30 (Euclid Red book; Laureijs et al., 2011).
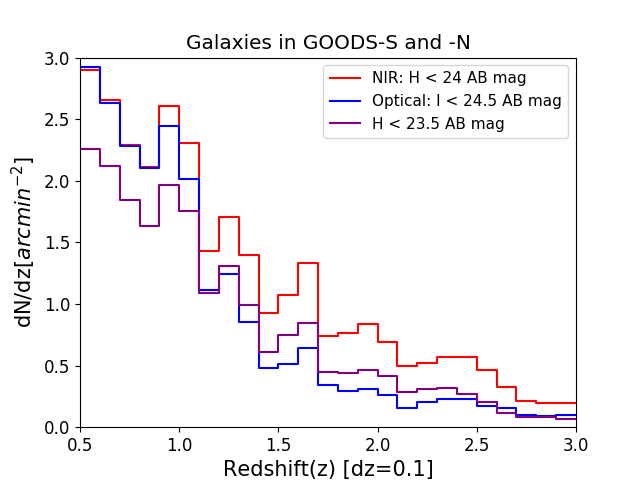
We start by replicating the Euclid expected sensitivity selection on the CANDELS catalogs. We find that I 24.5 AB mag results in about 30 galaxies per with a mean redshift of , which is consistent with the Euclid requirement. Applying the Euclid mag selection on the CANDELS NIR sample, results in a mean with about 37 galaxies per . The redshift distribution of each sample selection is shown in Figure 1. One clear advantage of the NIR is at , where the NIR bands select many more galaxies than the optical. This suppresses the shape noise induced by the intrinsic ellipticities of distant galaxies if the individual ellipticity uncertainties were similar to that in the optical; we assess the veracity of this in the following sections. In this study, we specifically use galaxies at a redshift range of to compare ellipticities estimated from optical and NIR images.
3 Euclid images made from CANDELS/HST images
We simulate Euclid VIS and NIR images using CANDELS/HST V (0.606), I (0.814), J (1.25), and H (1.6). Each of the Euclid VIS, Y, J and H bands will have four images taken per unit area of sky with 0.1 pixel scale in the VIS and 0.3 pixel scale in the NIR bands (Laureijs et al., 2011). For the VIS images, we combine the CANDELS V and I band images which span the bandwidth of the Euclid VIS band, 0.55–0.92. In both the VIS and NIR bands, there will be significant correlated noise if coadded images are made on finer pixel scale with just four frames. By combining the and band images, we can both increase the signal to noise in the NIR and drizzle on a factor of two oversampled pixel scale with a point-kernel (e.g. CANDELS WIDE survey; Grogin et al. (2011), HST/ACS COSMOS; Rhodes et al. (2007)), thereby minimizing the impact of correlated noise. We therefore combine the CANDELS and band images (Euclid : 1.16–1.58, : 1.52–2.04). We estimate that the Euclid survey strategy results in a median of between 10 and 11 valid frames per pixel when combining all three bands , and . However, the PSF undersampling in the shortest wavelength band and color gradients across such a wide wavelength range may introduce other systematics. The impact on the undersampled PSF as a result of the drizzling and the Euclid dither strategy is beyond the scope of this work and is currently being investigated. Furthermore, since the CANDELS band imaging does not cover the entire GOODS-S and -N fields, we avoid including the band in this analysis.
The step-by-step procedure to simulate the Euclid-quality images is outlined below:
-
1.
Produce cutouts of science and noise images () for each galaxy from the large HST/CANDELS V, I, J, and H mosaics.
-
2.
Combine V and I or J and H by weighting each pixel according to the weight map (inverse variance), i.e. , where and are the pixel values of science image and weight map, and . Because each pixel value has noise associated with it, and the noise is somewhat heterogeneous due to the observing strategy, an inverse variance weighting is the optimal approach to combine images and increase the signal-to-noise of co-added images (Koekemoer et al., 2011).
-
3.
Re-bin the pixel scale from 0.06 of CANDELS to 0.1 (V+I) or 0.15 (J+H). By using co-added J+H images, which will double the number of images, the co-added NIR images can be drizzled onto a 0.15 pixel scale, half of the original NIR pixel scale. This is challenging to do for VIS, since only four frames will be taken.
-
4.
Smooth the combined images with a Gaussian kernel to correct for the difference in PSF FWHM between HST and Euclid (for optical, 0.1 vs. 0.18; for NIR, 0.18 vs. 0.3).
-
5.
Make noise maps for the V+I and J+H following a random Gaussian distribution with 1 measured from the quoted sensitivity of Euclid VIS and NIR images. For the VIS images, the sensitivity is 24.5 mag at 10 (estimated from an extended source with a 0.3 radius; Cropper et al. (2012)). For the NIR images, the sensitivity is 24 mag at 5 in each band (measured from a point source), respectively. By combining the and bands, the effective sensitivity is therefore 24 AB mag at 7.
-
6.
Add the noise maps to the images to obtain the simulated Euclid VI(V+I) and JH(J+H) images. Since CANDELS’ background noise is negligible (more than 50 times smaller than that of Euclid), we do not remove the noise in the CANDELS images before adding Euclid noise maps.
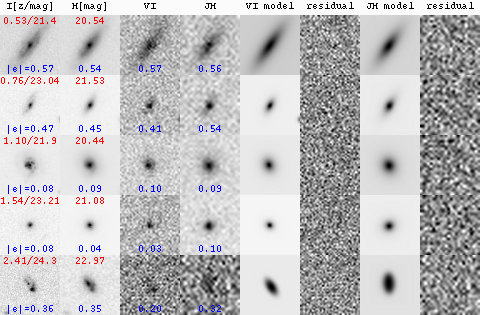
A few galaxies in the sample (1% and 3% in JH and VI, respectively) are not observed in J and V bands because the CANDELS coverage of the field at different bands varies slightly. Thus, after excluding these sources, we have 7,248 galaxies for VI and 9,887 galaxies for JH. For illustrative purposes, the images of 5 galaxies in the CANDELS I and H bands, the simulated Euclid VI and JH images, and their GALFIT fits are shown in Figure 2.
4 Ellipticity measurements using GALFIT
4.1 Masking sources
Weak lensing measurements, due to the small signal, typically rely on averages over a large number of galaxies. As a result, they usually require aggressive masks of samples to correct systematic effects. In particular, due to the sensitivity limit and spatial resolution, we find that Euclid will suffer from blending of galaxies with nearby objects and non-detections which the higher spatial resolution of the VIS band may be able to reveal. As demonstrated in Figure 2, the spatial resolution and SNR of simulated Euclid images (3rd and 4th columns) unsurprisingly appear to be significantly worse than CANDELS images (1st and 2nd). We therefore run a source detection algorithm, SExtractor (Bertin & Arnouts, 1996), on the VI and JH cutouts in Section 3 and remove sources for which the photometry as measured by the SEXtractor, AUTO MAG, deviates from the expected magnitude (I or H band magnitude from CANDELS photometry catalog) by more than two times the uncertainty in the difference between derived and expected magnitudes. In addition, we exclude galaxies from the original sample which are now offset by more than 0.7 (VI) and 0.75 (JH) relative to the original positions because it implies that the detection in the Euclid simulated image is either noise or affected by source confusion. After masking out about 13.3% and 11.4% sources from Section 3, we have 6,283 and 8,762 galaxies for VI and JH respectively. At the expected sensitivity limit, we find that we are about 80% complete at AB mag in VI and AB mag in JH.
4.2 GALFIT
We measure the ellipticities for the galaxies in the sample using GALFIT (Peng et al., 2002). GALFIT fits a Sérsic law to the surface brightness profile measured within elliptical isophotes of a galaxy. Importantly, GALFIT includes the PSF in the fitting process. The accounting for the PSF is crucial in WL because the smoothing from the PSF make galaxies appear rounder than they actually are (Holden et al., 2009) and significantly biases the ellipticity measurements. The appropriate PSF model is essential for the accuracy of the ellipticity estimation. It is inappropriate to derive a PSF for galaxies from the stars because stars typically have a Rayleigh-Jeans spectrum across the bandpass while galaxies are significant redder, implying a broader intrinsic PSF. We therefore construct a model PSF for the CANDELS using the TinyTim software package (Krist, 1995) for the ACS I band and WFC3 H band by assuming a flat galaxy spectrum (). They are then re-sampled to the CANDELS pixels scale, 0.06. For Euclid, we re-sample I and H Tinytim PSF to the Euclid pixel scales, 0.1 (VI) and 0.15 (JH) and, subsequently, smooth with a Gaussian smoothing kernel to correct for the difference in PSF FWHM between CANDELS and Euclid.
| Total (N/arcmin2) | ||||||||||||||||
|---|---|---|---|---|---|---|---|---|---|---|---|---|---|---|---|---|
| VI (I<24.5 & Re >0.1”) | 4634 (13.6) |
|
|
|
|
|
||||||||||
| JH (H<23.5 & Re >0.15”) | 4770 (14.0) |
|
|
|
|
|
We let GALFIT fit the images with central position, magnitude, half-light radius (Re) measured along the major axis, Sérsic index, axis ratio (q = semi-minor axis/semi-major axis), and position angle as free parameters. The SExtractor measurements are used to feed GALFIT with initial guesses for these parameters. In each image cutout, neighboring objects detected from the SExtractor are fit simultaneously or masked out if they are less than 2 magnitudes fainter than the target galaxy. Any fit resulting in problems (i.e., axis ratio errors 1.0) or non-existent results (fits crashed) are excluded. According to experiments undertaken by van der Wel et al. (2012), about 60% of galaxies have a good fit (GALFIT flag 0) from CANDELS GOODS-S GALFIT catalog, which can be used as reliable measures of ellipticity. We find a slightly higher percentage, 4,737 galaxies (65.4%) for VI and 6,449 galaxies (65.2%) for JH, after excluding all problematic galaxies as discussed in Section 4.1 and bad fits. Figure 2 illustrates best-fit GALFIT model images and residuals images showing the difference between model and original image which are dominated by noise. The absolute value of the ellipticity (see the definition in Section 4.3) computed using the GALFIT results for those galaxies are given in the bottom of I, H, VI, and JH images.
Although GALFIT is one of the most popular fitting tools for measuring galaxy shapes, we lose a large amount of our sample due to unreliable fits. Furthermore, it is known that the GALFIT is not suitable to fit small, faint galaxies, mainly high redshift galaxies (van der Wel et al., 2012; Sifón et al., 2015). This is mostly due to the number of parameters that GALFIT tries to fit for, which results in unreliable fits in the low signal to noise ratio regime (Jee et al., 2013). The widely used shear measurement algorithms uniquely developed for WL, such as the KSB (Kaiser, Squires & Broadhurst) algorithm (Kaiser et al., 1995; Hoekstra et al., 1998) and fit (Miller et al., 2007; Kitching et al., 2008), might provide better performance in measuring the ellipticity of galaxies. However, Sifón et al. (2015) compared the KSB results for bright cluster galaxies to GALFIT shapes and showed that the ellipticities measured by both methods are generally consistent. A detailed assessment of the accuracy of ellipticity measurements from different techniques is beyond of the scope of this paper and we use GALFIT for our main goal of comparing the ellipticities estimated from CANDELS to Euclid-quality images.
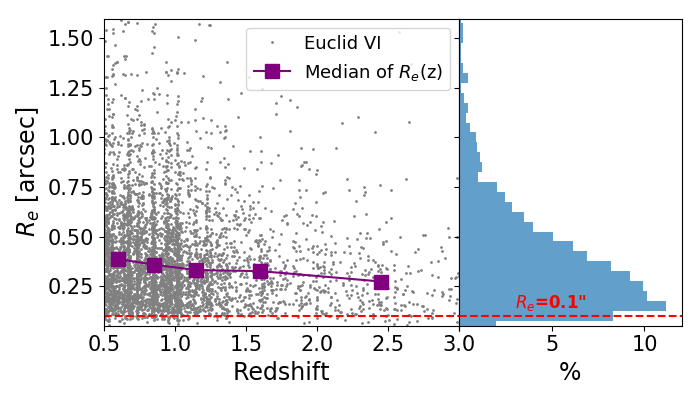
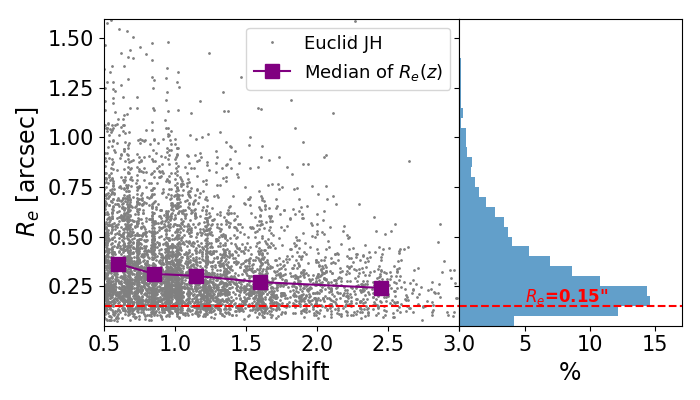
4.3 Comparison of ellipticities between CANDELS and Euclid-quality images
Typically, only galaxies with a size comparable or larger than the PSF have a well measured shape; so the shape of the smallest galaxies becomes ill-defined. Also, as the SNR decreases, the ability to measure galaxy shapes decreases since the imaging data is only sensitive to the highest surface brightness regions of the galaxy. Therefore, the galaxy samples for shape measurement require a lower limit to the SNR of about 10, and the radius of the galaxy larger than 1.25 times the PSF FWHM (Euclid Red book: Laureijs et al. (2011)). In order to satisfy those requirements, we restrict the galaxy sample in the NIR band to have H mag ( SNR for J+H), and a half-light radius () measured from GALFIT on the simulated Euclid JH image of larger than half of the NIR PSF FWHM of Euclid (R 0.15). For the optical, we select galaxies having I mag and SNR(I) with a size limit, measured from VI images . This is about half the FWHM of the PSF in the VIS band. In Figure 3, we show the distribution of as a function of a redshift for the optical and NIR sample with mag (left) and mag (right), respectively. About 2.2% of optical and 9.8% of NIR selected galaxies have and , respectively. As a final sample for analyzing ellipticities, we use 4,634 and 4,770 galaxies for the optical and NIR respectively. In Table 2, the number densities of the galaxy samples in the optical and NIR are listed at five different redshift bins. The relatively high SNR cut of H mag results in a similar total number density of galaxies with the VI band as also shown in Figure 1, but still translates to a higher number density by a factor of 1.4 at (6.9 vs. 5.1 arcmin-2).
In order to study galaxy shapes, the complex galaxy ellipticity is typically used in weak lensing studies (Miller et al., 2013; Schrabback et al., 2015). Using axis ratio (q) and position angle estimated from GALFIT, we compute the complex galaxy ellipticity () of our final sample which is defined as
| (1) |
where, the modulus of the ellipticity () is defined as (1-q)/(1+q) and corresponds to the position angle of the major axis. We then compare complex galaxy ellipticities () measured from Euclid-quality images with the CANDELS values. Here, we consider CANDELS-measured ellipticity as the original ellipticity of an observed galaxy because of the much larger depth and better resolution compared to Euclid data. Through this comparison, we can investigate the robustness of the galaxy shape measurements on the simulated Euclid images.
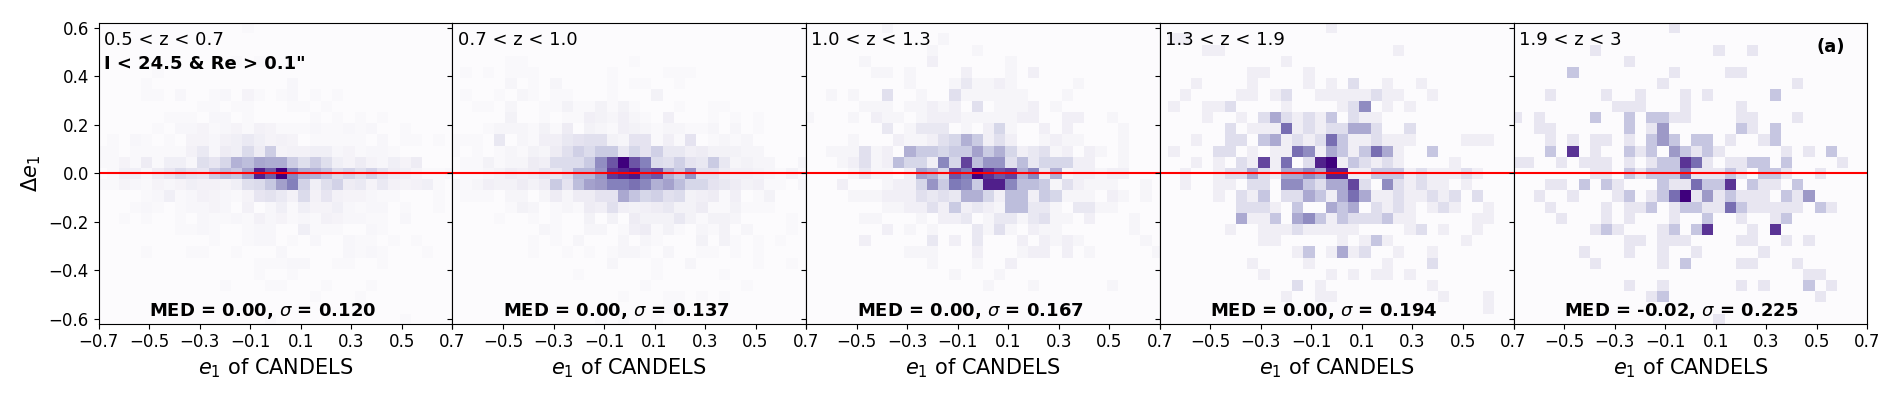
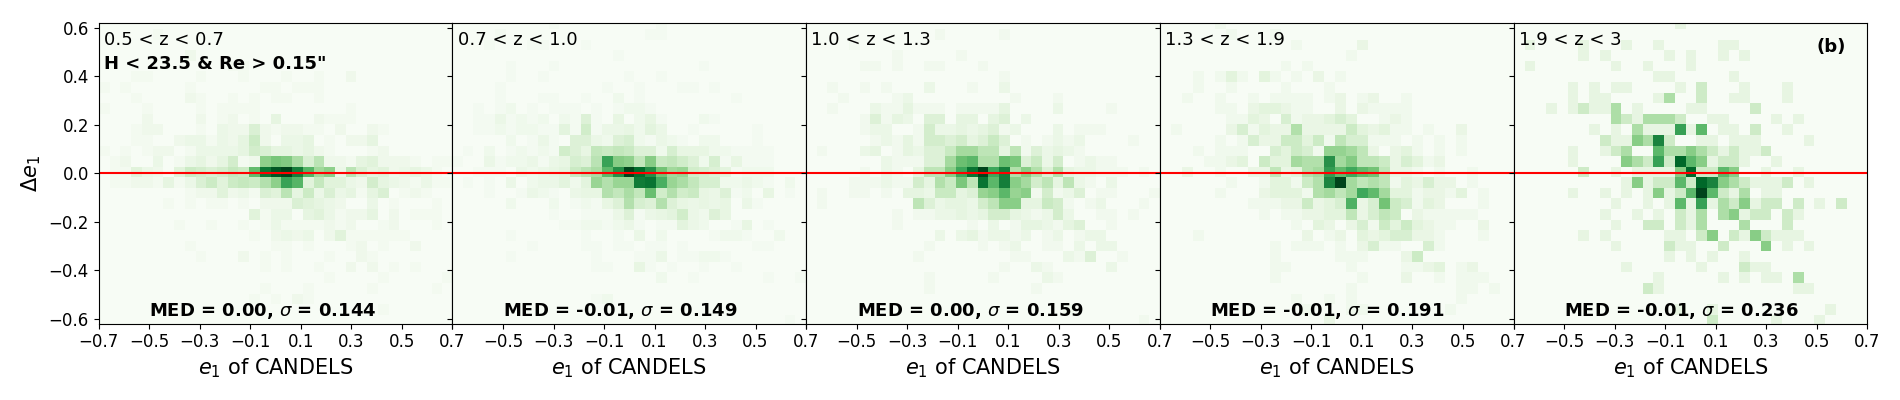
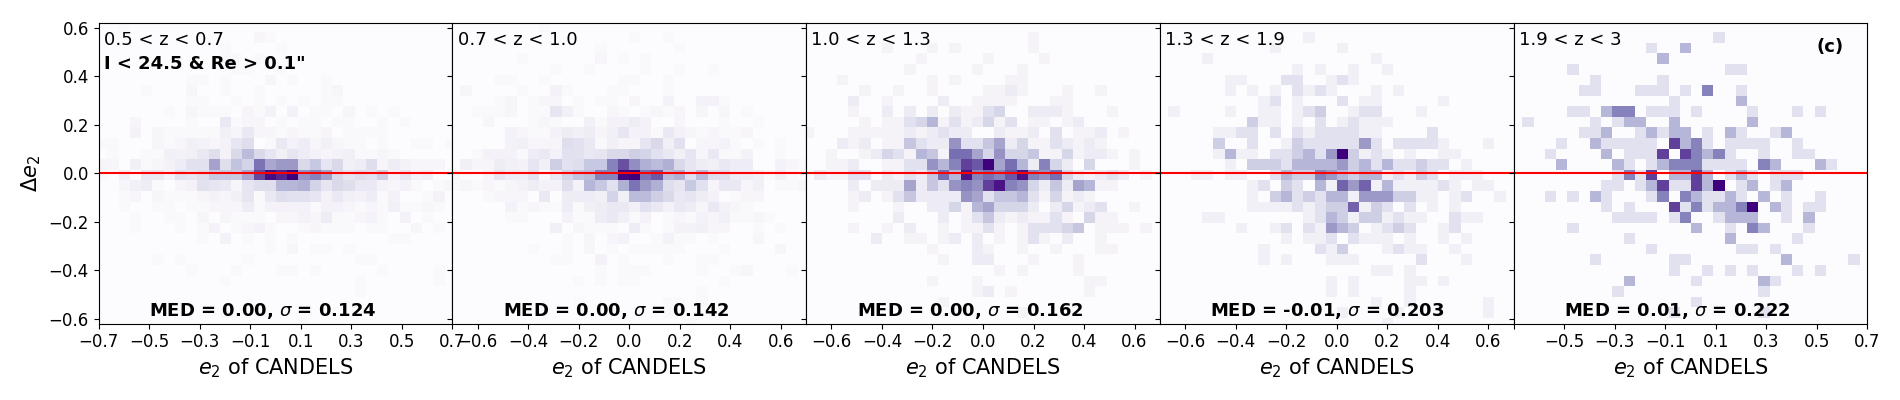
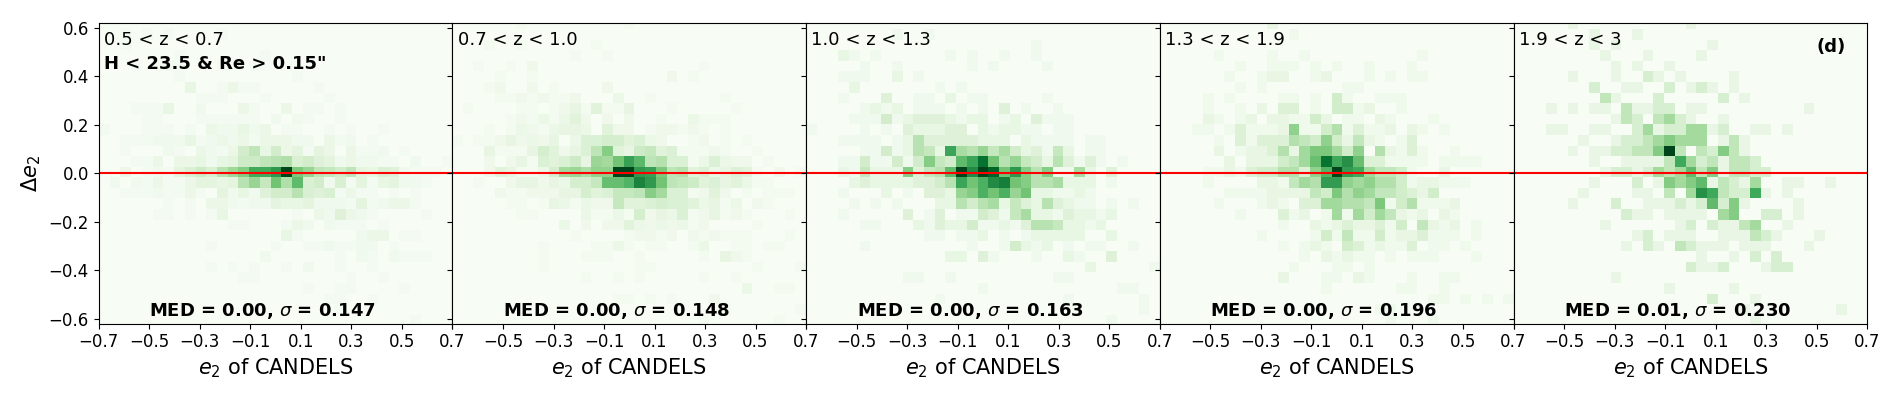
In Figure 4, we plot differences in ellipticities between CANDELS and Euclid-quality data, = ( of Euclid-quality – of CANDELS), as a function of of CANDELS for both ellipticity components, , in the range of . Most galaxies scatter systematically around for both optical (purple) and NIR (green) with a median at all redshift ranges considered in this study. The uncertainty in quantifies how well the galaxy shapes are recovered with Euclid-quality images. The lowest redshift bin has a measured scatter (, the standard deviation of ) in the NIR which is a factor of 1.2 larger than that in the VI-band. However, the measured scatter in the NIR is similar to that in the VI at all other redshifts, . Overall, we find that the ellipticities of individual galaxies can be measured with a similar scatter from the Euclid VIS- and NIR-like images. There is a weak trend that the scatter of increases with redshifts in both selections. Galaxies are fainter and smaller at higher redshift; so, the limited Euclid spatial resolution and sensitivity will result in a larger scatter in the measured shape. In particular, at higher redshifts, galaxies with larger ellipticities (in absolute values) tend to have larger discrepancies (see diagonal trends at ). This is likely because highly elongated galaxies in CANDELS appear to be rounder, and with less-constrained position angles at Euclid-quality resolution. This trend appears to be a bit stronger for the NIR high-z sample due to the pixelization in the JH data.
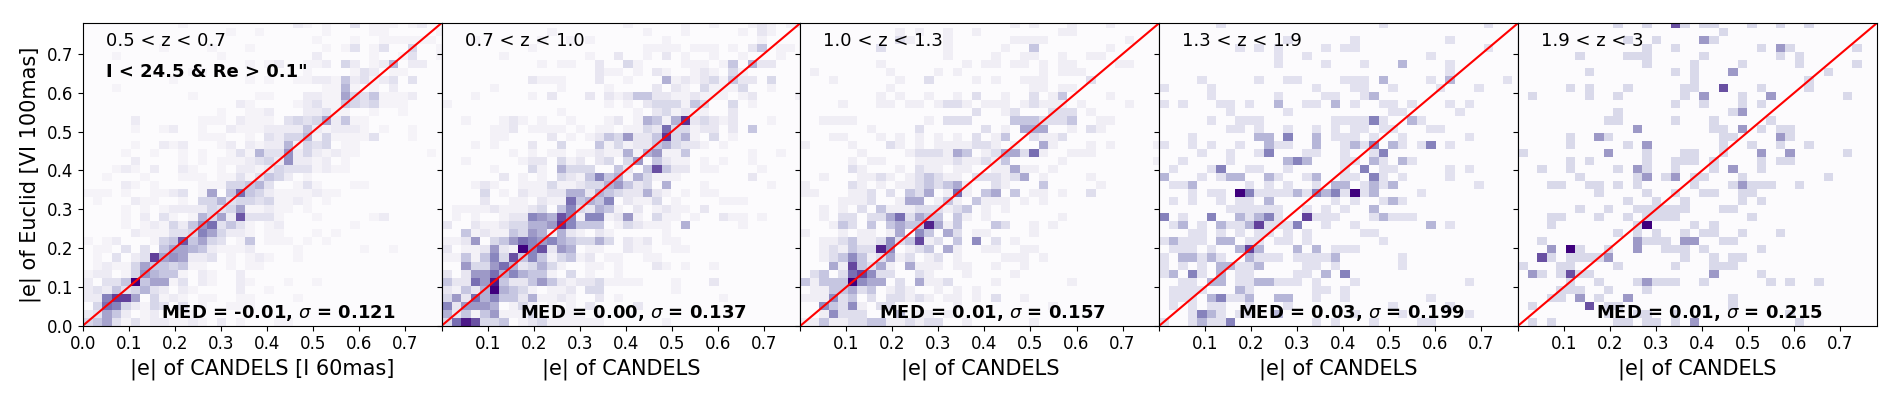
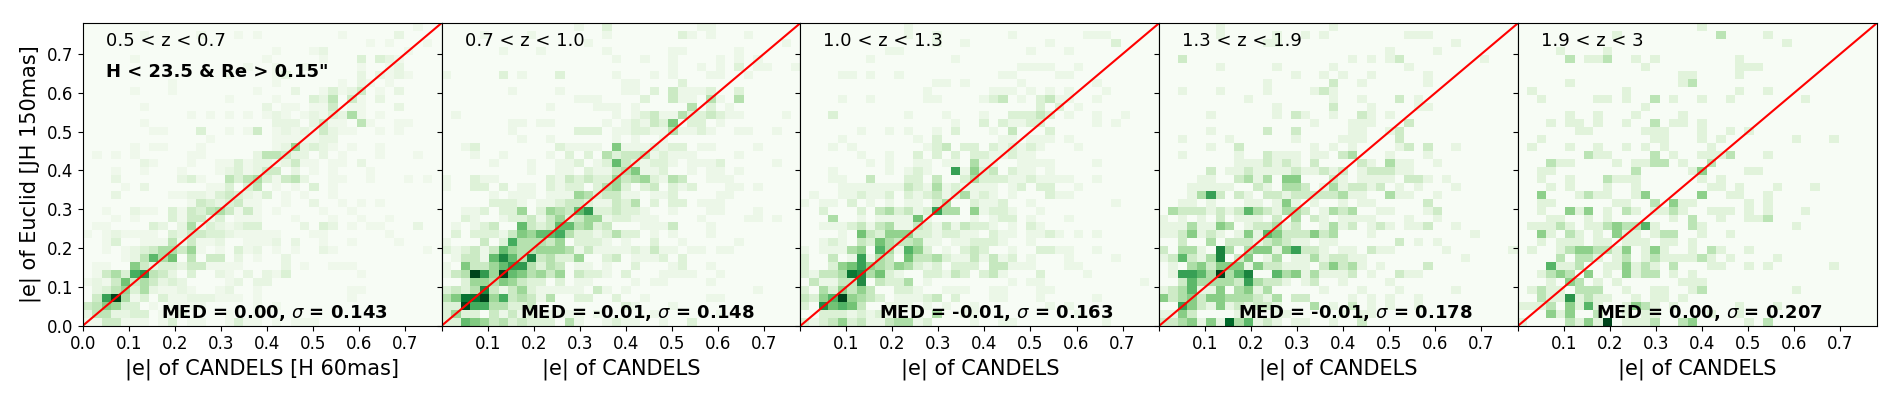
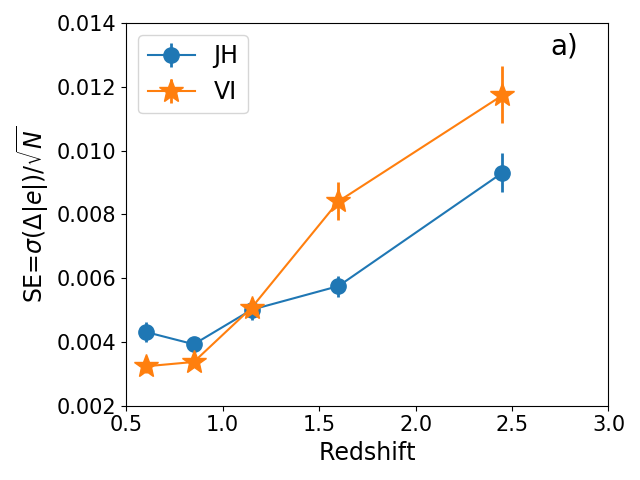
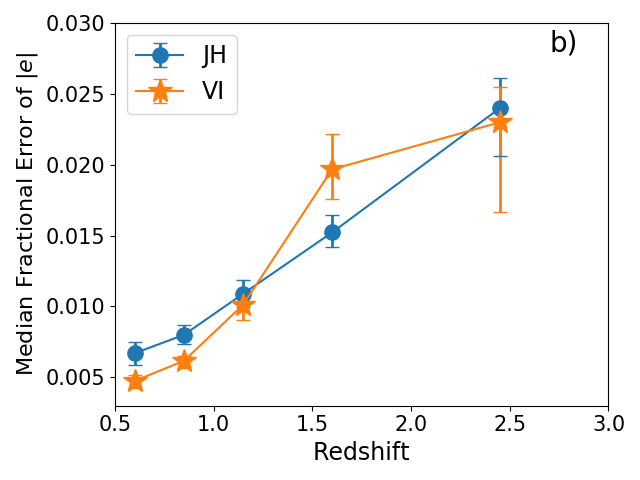
In Figure 5, we compare the modulus of the ellipticity, from Equation 1, derived using CANDELS I band to the simulated Euclid VI and CANDELS H band to the simulated Euclid JH. The ellipticities derived from the simulated Euclid images are correlated very well with the ellipticities derived from CANDELS images with a median of = ( of Euclid-quality – of CANDELS) for both optical and NIR imaging. At , NIR yields a similar to lower scatter than the optical, while the scatter in VI-derived ellipticities is significantly smaller at . This trend of the uncertainty in is more obvious in Figure 6–a). We compare the standard error (SE) of () at each redshift bin for JH (blue) and VI (red). At , the standard error of JH is 1.2–1.1 times larger than one of VI. But, the trend reverses at so that the standard error of JH is significantly smaller than VI by a factor of 1.5–1.3. As shown in Figure 5, the measured of galaxies in JH is very similar with that of VI over the redshift range considered here; thus, the higher number density of galaxies at drives a lower standard error of ellipticity differences in JH. In Figure 6–b, we show the median fractional error of ellipticity, which is defined as (median of ), as a function of redshift. The small values indicate that the derived ellipticity with -quality JH and VI imaging is very close to the true value from CANDELS on average. We find that the performance of the JH band in galaxy ellipticity measurements is comparable to the VI at all redshifts despite the significantly worse spatial resolution of JH. This result is very similar to that derived by Tung & Wright (2017) who found that for a 1.2m class telescope, the band yields an ellipticity measurement error which is a factor of 3 smaller than in an band selected catalog while the band is a factor of worse than the selected catalog. This is also consistent with the results of Schrabback et al. (2018) who found that ground-based imaging with a PSF FWHM0.35 yields an ellipticity dispersion for 1.4 galaxies, which is 0.76 times that of optically-selected galaxy samples with single-orbit HST imaging. A comparison between ellipticities derived from the simulated Euclid JH data and CANDELS I-band data indicates a correlation; however, the I-band ellipticities are larger than that in the NIR and the scatter is larger than shown in Figure 5. This is likely because the band ellipticities are dominated by disk light while the NIR ellipticities are tracing a combination of disk and more-compact bulge light. Thus, if systematics arising from PSF under-sampling and dither strategy on the NIR images can be accounted for in future work, the shape noise can be minimized by including ellipticity measurements from the NIR bands.
5 Conclusion: Precise Ellipticity Measurements in the NIR
We investigate galaxy ellipticities in simulated Euclid-quality optical (VIS) and near-infrared (NIR) images constructed from HST/CANDELS co-added V+I (VI) and J+H (JH) images. We select galaxies in CANDELS GOODS-S and -N fields (covering about 340 arcmin2) with photometry in I and H bands at similar depths as the planned Euclid survey. In this study, we specifically use galaxies at a redshift range of . After applying a SNR cut, the total number density of galaxies at is comparable in the NIR and optical; however, the NIR bands select 1.4 times higher number density of galaxies relative to the optical selection at , which enable us to reduce the statistical uncertainties in the shape measurements of distant galaxies. By co-adding Euclid-quality J and H-band images, which double the number of frames and the exposure time, we can generate images at 0.15 pixel scale (half of the original Euclid NIR detector pixel scale) and achieve at mag and at mag. Using GALFIT, we measure ellipticities of galaxies in CANDELS I and H band images with 0.06 pixel scale and the simulated Euclid VI and JH images with 0.1 and 0.15 pixel scale, respectively. We then compare ellipticities between CANDELS and simulated Euclid-quality images while considering HST/CANDELS ellipticity as the original ellipticity of a galaxy due to its superior depth and resolution.
A comparison between ellipticities derived from CANDELS and Euclid-quality VIS and NIR imaging shows that both wavelength ranges provide similar performance in measuring galaxy ellipticities at all redshifts included in this study despite the worse spatial resolution and pixel sampling of the NIR imaging. When combined with the higher source density in the NIR selection, we find that the standard error in NIR-derived ellipticities is about 30% smaller than the optical bands at , which implies a more precise ellipticity measurement than in the optical alone. Since the VIS and NIR galaxy shape measurements with Euclid have different fractional contributions of the bulge and disk, a combination of the two can improve the precision with which galaxy ellipticities are measured. The next step that is required before the NIR data can be used for WL studies is to assess how the drizzling affects both the undersampled telescope PSF, and the correlated noise (see e.g. Rhodes et al., 2007). However, even though the FWHM of the Euclid NIR imaging does not quite reach HST or WFIRST resolution, the NIR data provides a major advantage for weak lensing measurements compared to optical ground-based observations that typically achieve a PSF FWHM in good seeing conditions (e.g. Kuijken et al., 2015; Mandelbaum et al., 2018); while the latter provides good sensitivity to the weak lensing signal with a median redshift of the sample of z , about half the galaxy sample will be unresolved due to the small size of galaxies, as shown in Figure 3, implying a higher statistical uncertainty in their ellipticities.
In conclusion, by using co-added J+H band Euclid–quality images, we show that the galaxy sample selected at NIR wavelengths yields a more precise ellipticity measurement, especially at high redshifts. This suggests that a careful evaluation of NIR shape systematics for future weak gravitational lensing surveys, such as with Euclid and WFIRST, should be undertaken.
References
- Bartelmann & Schneider (2001) Bartelmann,M. & Schneider, P. 2001, Phys. Rep., 340, 291
- Bertin & Arnouts (1996) Bertin, E. & Arnouts, S. 1996, A&AS, 117, 393
- Dahlen et al. (2013) Dahlen, T., Bahram, M., Faber, S. M., Ferguson, H.C., et al. 2013, ApJ, 775, 93
- Dickinson (2000) Dickinson, M. 2000, Philos. Trans. R. Soc. London A, 358, 2001
- Grogin et al. (2011) Grogin, N. A., Kocevski, D. D., Faber,S. M. et al. 2011, ApJS, 197, 35
- Cropper et al. (2012) Cropper, M., Cole, R., James, A., et al. 2012, Arxiv:1208.3369
- Hoekstra et al. (1998) Hoekstra, H., Franx, M., Kuijken, K., & Squires, G. 1998, ApJ, 504, 636
- Holden et al. (2009) Holden, B. P., Franx, M., Illingworth, G. D., et al. 2009, ApJ, 693, 1
- Jee et al. (2013) Jee, M. J., Tyson, J. A., Schneider, M. D., et al. 2013, ApJ, 765, 74
- Kaiser et al. (1995) Kaiser, N., Squires, G., & Broadhurst, T. 1995, ApJ, 449, 460
- Koekemoer et al. (2011) Koekemoer, A. M., Faber, S. M., Ferguson, H. C. et al. 2011, ApJS, 197, 36
- Kitching et al. (2008) Kitching, T. D., Miller, L. Heymans, C. E. et al. 2008, MNRAS, 390, 149
- Kuijken et al. (2015) Kuijken, K., Heymans, C., Hildebrandt, H., et al. 2015, MNRAS, 454, 3500
- Krist (1995) Krist, J. 1995, Astronomical Data Analysis Software and Systems IV, 77, 349
- Laureijs et al. (2011) Laureijs, R., Amiaux, J., Arduini, S. et al. 2011, arXiv: 1110.3193
- Mandelbaum et al. (2018) Mandelbaum, R., Miyatake, H., Hamana, T. et al. 2018, PASJ, 70, S25
- Massey et al. (2013) Massey, R., Hoekstra, H., Kitching, T., et al. 2013, MNRAS, 429, 661
- Miller et al. (2007) Miller, L., Kitching, T. D., Heymans, C., et al. 2007, MNRAS, 382, 315
- Miller et al. (2013) Miller, L., Heymans, C., Kitching, T. D., et al. 2013, MNRAS, 429, 2858
- Peng et al. (2002) Peng, C. Y., Ho, L. C., Impey, C. D., & Rix, H.-W. 2002, AJ, 124, 266
- Rhodes et al. (2007) Rhodes, J. D., Massey, R. J., Albert, J., et al. 2007, ApJS, 172, 203
- Schrabback et al. (2015) Schrabback, T., Hilbert, S., Hoekstra, H., et al. 2015, MNRAS, 454, 1432
- Schrabback et al. (2018) Schrabback, T., Schirmer, M., van der Burg, R. F. J. et al. 2018, A&A, 610, A85
- Sifón et al. (2015) Sifón, C., Hoekstra, H., Cacciato, M. et al. 2015, A&A, 575, 48
- Troxel & Ishak (2015) Troxel, M., A., Ishak, M. 2015, Phys. Rep., 558, 1
- Tung & Wright (2017) Tung, N. & Wright, E. 2017, PASP, 129, 114501
- van der Wel et al. (2012) van der Wel, A. and Bell, E. F. and Häussler, B. et al. 2012, ApJS, 230, 24