Address: Willersbau (B-209), Zellescher Weg 12-14, 01069 Dresden, Germany.
Tel: +4935146335657.
Fax: +4935146337096.
Closing the gap between atomic-scale lattice deformations and continuum elasticity
Abstract
Crystal lattice deformations can be described microscopically by explicitly accounting for the position of atoms or macroscopically by continuum elasticity. In this work, we report on the description of continuous elastic fields derived from an atomistic representation of crystalline structures that also include features typical of the microscopic scale. Analytic expressions for strain components are obtained from the complex amplitudes of the Fourier modes representing periodic lattice positions, which can be generally provided by atomistic modeling or experiments. The magnitude and phase of these amplitudes, together with the continuous description of strains, are able to characterize crystal rotations, lattice deformations, and dislocations. Moreover, combined with the so-called amplitude expansion of the phase-field crystal model, they provide a suitable tool for bridging microscopic to macroscopic scales. This study enables the in-depth analysis of elasticity effects for macro- and mesoscale systems taking microscopic details into account.
Introduction
Strains and defect-induced deformations have tremendous effects on the macroscopic properties of single and poly-crystalline materials Sethna2017 . These effects have fostered a huge variety of studies for more than a century, starting with the first theories describing the elastic field generated by dislocations in solids Volterra1907 ; Taylor1934 .
Deformation of crystal lattices, although involving changes in the positions of atoms, are crucial for understanding the behavior of systems defined on larger length scales Rollett2015 . Continuum mechanics, and associated continuous elastic fields, are very useful for describing elastic effects on the mesoscopic and/or macroscopic scales. In this approach, a continuous representation of the displacement of atoms in a lattice with respect to a reference crystal is employed landau1986 . It is useful for either relatively simple distortions, as the one given by pure elastic deformations and rotation, or for deformations induced by the presence of dislocations landau1986 ; Lazar2005 ; Cai2006 ; anderson2017 . Indeed, it can be exploited to provide in-depth studies of material properties allowing for direct comparisons with experiments and/or a-priori predictions, as, e.g, for plasticity onset in complex heterostructures Montalenti2014 ; Isa2016 or elasticity effects on material transport mechanisms and morphological evolution Rovaris2016 ; Bergamaschini2016b .
For some applications, however, continuum mechanics is not enough as neglecting the description of atoms leads to a crucial loss of information. For instance, this applies to contributions of the dislocation core to the elastic field Ehrlacher2016 ; Braun2018 and, in turn, to dislocation nucleation, motion, and reaction. In these cases, in order to describe material properties by elasticity theory, the elastic field must be described within mesoscale Bulatov2006 ; Devincre2008 or atomistic approaches. Typically, severe restrictions are present for these methods in the description of long time- and large length-scales.
An attempt to overcome the timescale limits of atomistic approaches, by focusing on diffusive timescales, lead to the development of the so-called phase-field crystal (PFC) model. It focuses on the dimensionless atomic density field difference, , filtering out vibrations on lattice sites Elder2002 ; Elder2004 ; Emmerich2012 . It provides good descriptions of elasticity Heinonen2014 and dislocation dynamics Berry2014 even if it usually requires fine spatial discretizations. This latter limitation is overcome by the complex amplitude expansion (APFC)Goldenfeld2005 ; Athreya2006 ; GoldenfeldJSP2006 ; SpatschekPRB2010 of the PFC model for which both long time scales and large length scales can be examined. It consists of a coarse-grained representation of the density that is expressed by the sum of Fourier modes representing specific lattice symmetries. The slowly-oscillating complex amplitudes of these modes, , are then the variables used to characterize the crystalline lattice. Real amplitudes, which may be regarded as a special case of the APFC model, have been also considered Khachaturyan1983 ; Khachaturyan1996 , delivering long-range order parameters as in the classical phase-field approaches based on atomistic descriptions. They can be used to account for bridging-scale descriptions of elasticity effects by means of additional contributions as, e.g. in the presence of precipitates, alloys or point defects Chen1991 ; Bugaev2002 ; Tewary2004 ; Varvenne2012 ; Varvenne2017 . However, they do not directly encode rotational invariance and elasticity associated to the deformations of the crystal lattice.
Although some intrinsic limitations for large deformations and tilts exist SpatschekPRB2010 , APFC has proved useful in the advanced modeling of materials as illustrated in studies of elasticity effects SpatschekPRB2010 ; Heinonen2014 , compositional domains Geslin2015 , binary alloys ElderPRE2010 , dislocation dynamics Skaugen2018 ; Skaugen2018b , morphology and motion of dislocation networks at grain boundaries SalvalaglioGB2018 , and control of material properties Choudhary2012 ; SalvalaglioAPFC2017 ; Ofori-Opoku2018 . However, the basic concept of APFC, namely the coarse-graining of an explicit lattice representation by focusing on the complex coefficients of Fourier modes, can be readily applied to any atomistic description as obtained, e.g, from theoretical modeling, atomistic simulations, or experimental imaging. Still, a direct connection to continuum elasticity is missing.
In this work we first show how to exploit the representation delivered by the complex amplitudes expansion of the PFC model to derive expressions for elastic field components independent of lattice symmetry and system dimensionality. In practice, we describe how to reconstruct strain and rotation fields from the atomic density provided that the complex amplitudes functions of the corresponding Fourier modes are known. Then, we consider numerical simulations for some generic systems involving strained/tilted crystals and apply the new framework in order to depict and analyse the resulting deformations. To this purpose, we numerically solve the equations of the APFC model directly delivering the amplitudes function. Standard simulations as well as simulations which extend the current state of the art for APFC and PFC approaches are presented and discussed. The combination of using a coarse-grained approach as APFC with the detailed analysis of deformations proposed here results in a bridging-scale framework enabling the study of elasticity effects from the micro- to macro-scale while describing microstructural evolution, at variance with many other methods focused only on some of these aspects at once. Moreover, using the APFC model allows us for its further assessment as a reliable coarse-grained method accounting for microscopic effects. The elastic field in presence of defects, derived from complex amplitudes as computed by APFC simulations, reproduce predictions of continuum mechanics as expected from PFC-based modeling Elder2002 ; Elder2004 ; SpatschekPRB2010 . Moreover, the results also indicate that APFC includes some deviation from continuum mechanics that may be ascribed to atomistic structure at the dislocation cores, as it has also been observed and discussed in other continuum or atomistic approaches Lazar2017 ; Ehrlacher2016 ; Braun2018 .
Results and Discussions
Strain and rotation fields from complex amplitudes
The complex amplitude functions, , entering the APFC model (see Methods section) are connected to the deformation of a crystal with respect to a reference lattice by the following equation:
| (1) |
with a specific set of reciprocal space vectors describing the lattice of an undeformed crystal. Eq. (1) defines independent equations. ’s are the real values corresponding to the amplitudes in a relaxed, unrotated crystal. They can be computed by the minimization of the energy functional in Eq. (9) assuming constant, real amplitudes for each different length of . The quantity delivers an order parameter which is constant in the solid/ordered phase, decreases at defects and interfaces, and vanishes when approaching the liquid/disordered phase. Eq. (1) can be rewritten as
| (2) |
with . In order to determine the components of the deformation field from amplitudes (with = in 2D and = in 3D), Eq. (2) must be inverted, resulting in a system of equations with the dimensionality of the system. In 2D, by selecting amplitudes labelled by generic indexes and , results in
| (3) |
with the two components of the displacement field obtained by index permutations on the group and the 2D Levi-Civita symbol. In 3D, by selecting amplitudes labelled by generic indexes , , and , and we obtain
| (4) |
with the three components of the displacement field obtained by index permutations on the group . Amplitudes must be chosen in order to have a non vanishing denominator of the prefactor entering Eq. (4). Without loss of generality we fix here , and , referring to with the same length for each symmetry considered here. For small deformations, the strain tensor can be written . The strain components can then be explicitly computed from by means of spatial derivatives of Eq. (3) () or Eq. (4) (). This leads to terms. Notice that, are inherently discontinuous due to their functional form. However, are, by definition, continuous complex functions in both their real and imaginary part and
| (5) |
Since almost everywhere in the crystal phase, the terms and then can be readily computed. only vanishes exactly at the dislocation core position for some indexes, , consistent with continuum elasticity theory. By exploiting the components of the displacement field, rotations of the crystal structure with respect to the reference orientation can also be evaluated as . corresponds to the rotational angle in the --plane. For , , describing the rotation in the two-dimensional domain. For the sake of readability, the expressions of and for , as functions of , are reported in the Supplementary Information S2. The resulting deformation fields deliver descriptions similar to advanced continuum theories, as e.g. in Refs. Lazar2013 ; Po2014 ; Lazar2017 , directly connected here to atomic arrangements via functions.
Deformations induced by dislocations
Let us consider pairs of dislocations in a 2D triangular lattice that form at the interface between layers of different atomic spacing in order to accommodate a misfit strain. As performed in Ref. SalvalaglioAPFC2017 , the dislocations can be described by APFC by setting an initial condition for in order to reproduce opposite deformations (namely initial strains) . This can be done using Eq. (1) with an in-plane displacement field defined by and , where ( in 3D).
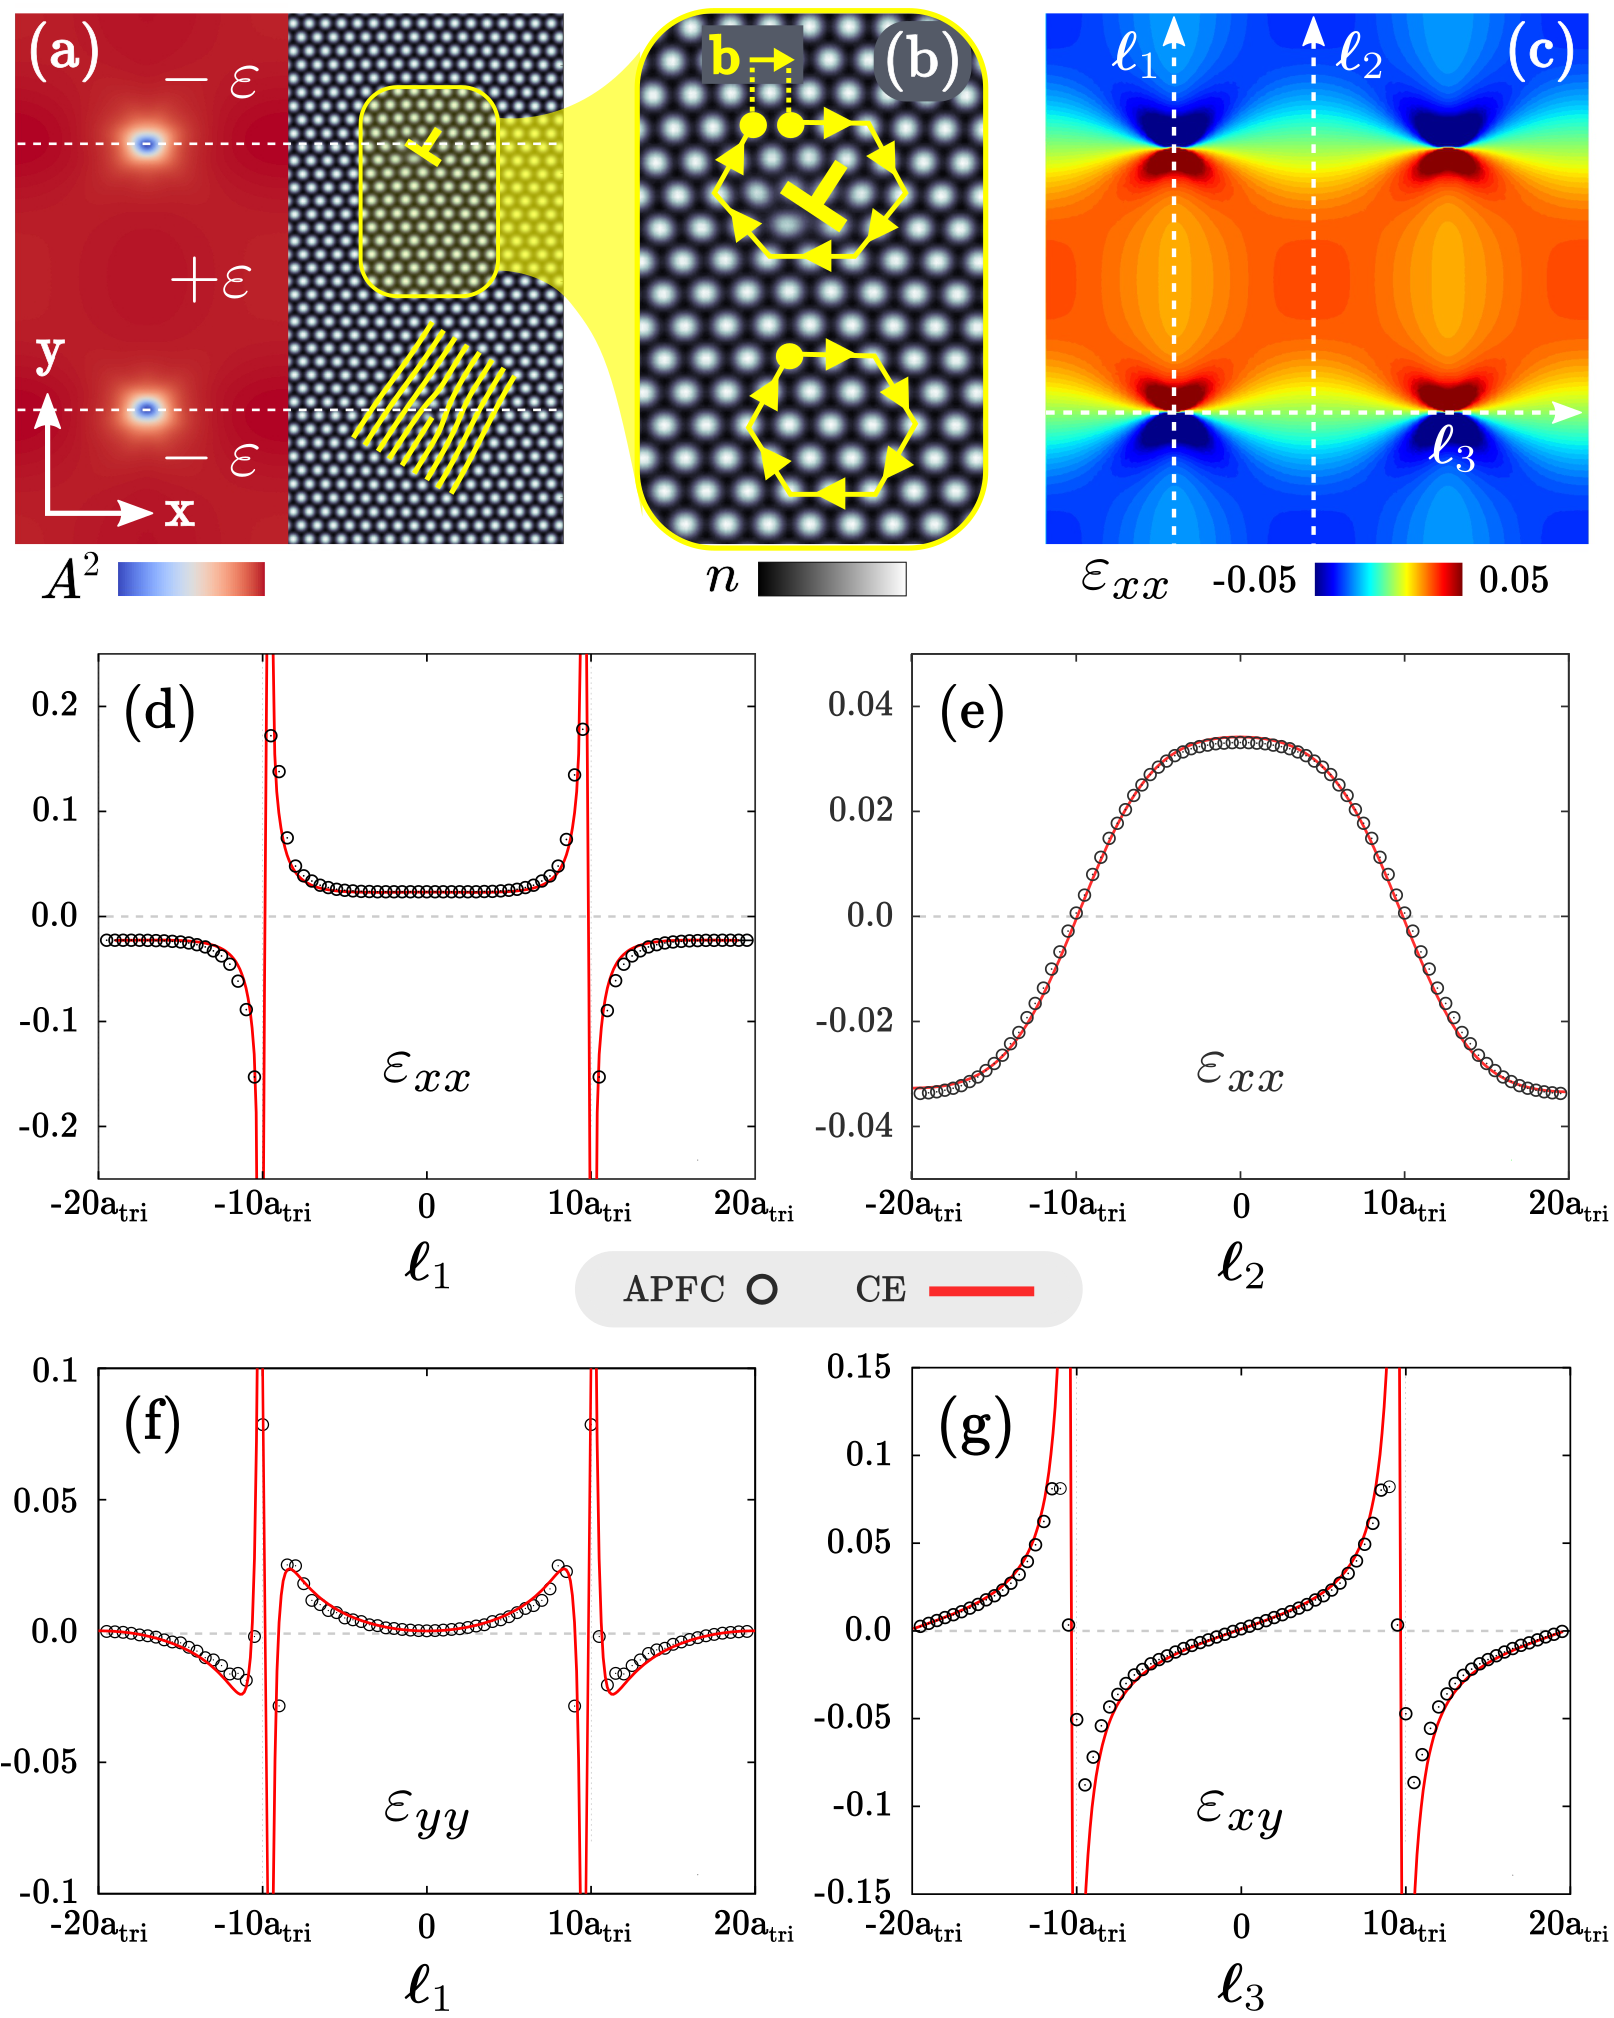
is the distance between maxima of the density as in Eq. (8) for triangular symmetry and is the size of the computational domain, both evaluated along the axis. These opposite displacements are imposed as illustrated in Fig. 1(a).
The relaxation of such an initial condition until the defect shape is stationary in a square system of linear dimension is illustrated in Fig. 1(a) (details about simulations are reported in the Methods section and references therein). is shown on the left and the reconstructed density from Eq. (8) is shown on the right. Two pairs of dislocations form within the simulation domain where is constant in the solid and decreases at defects. Although the APFC approach does not allow for the exact representation of atoms at the dislocation-core, the lattice distortion is well described as shown by the illustration of atomic planes by solid lines, highlighting the presence of one specific defect. The deformation of the lattice can be quantified at the atomic level by evaluating the Burgers vector, , as shown in Fig. 1(b). Notice that it corresponds to a lattice spacing in direction, i.e. . is shown in Fig. 1(c) while, for the sake of completeness, other components are shown in the Supplementary Information S3.
The elastic field as computed from the complex amplitudes matches very well with continuum elasticity as shown in Fig. 1(d)-(g). The latter can be computed provided that the dislocation character, namely edge, screw or mixed anderson2017 , as well as and elastic constants are known. Within the APFC model the elastic constants are determined by the parameters entering the energy (see Methods section and Eq. (9)) as discussed in Ref. Heinonen2014 . They do not appear explicitly in the equations reported above but affect amplitude values and their spatial derivatives. As reported in the Supplementary Information S4, the defects in Fig. 1(c) can be modeled as a 2D array of edge dislocations and the strain field according to continuum elasticity (CE) can be computed as superposition of the elastic field of single dislocations. The elastic constant entering this equations is the Poisson ratio set here to 1/3 as in Elder2002 ; Elder2004 (see also Supplementary Information S4). Figs. 1(d)-(g) show by solid red lines along , , and as defined in Fig. 1(c). The strain components computed from ’s are shown by black circles. An almost perfect agreement is found far away from dislocation cores as observed along for . The same holds true for the other cases except for regions close to the dislocation cores, namely at where, however, a continuous description of lattice deformations is not well-posed.
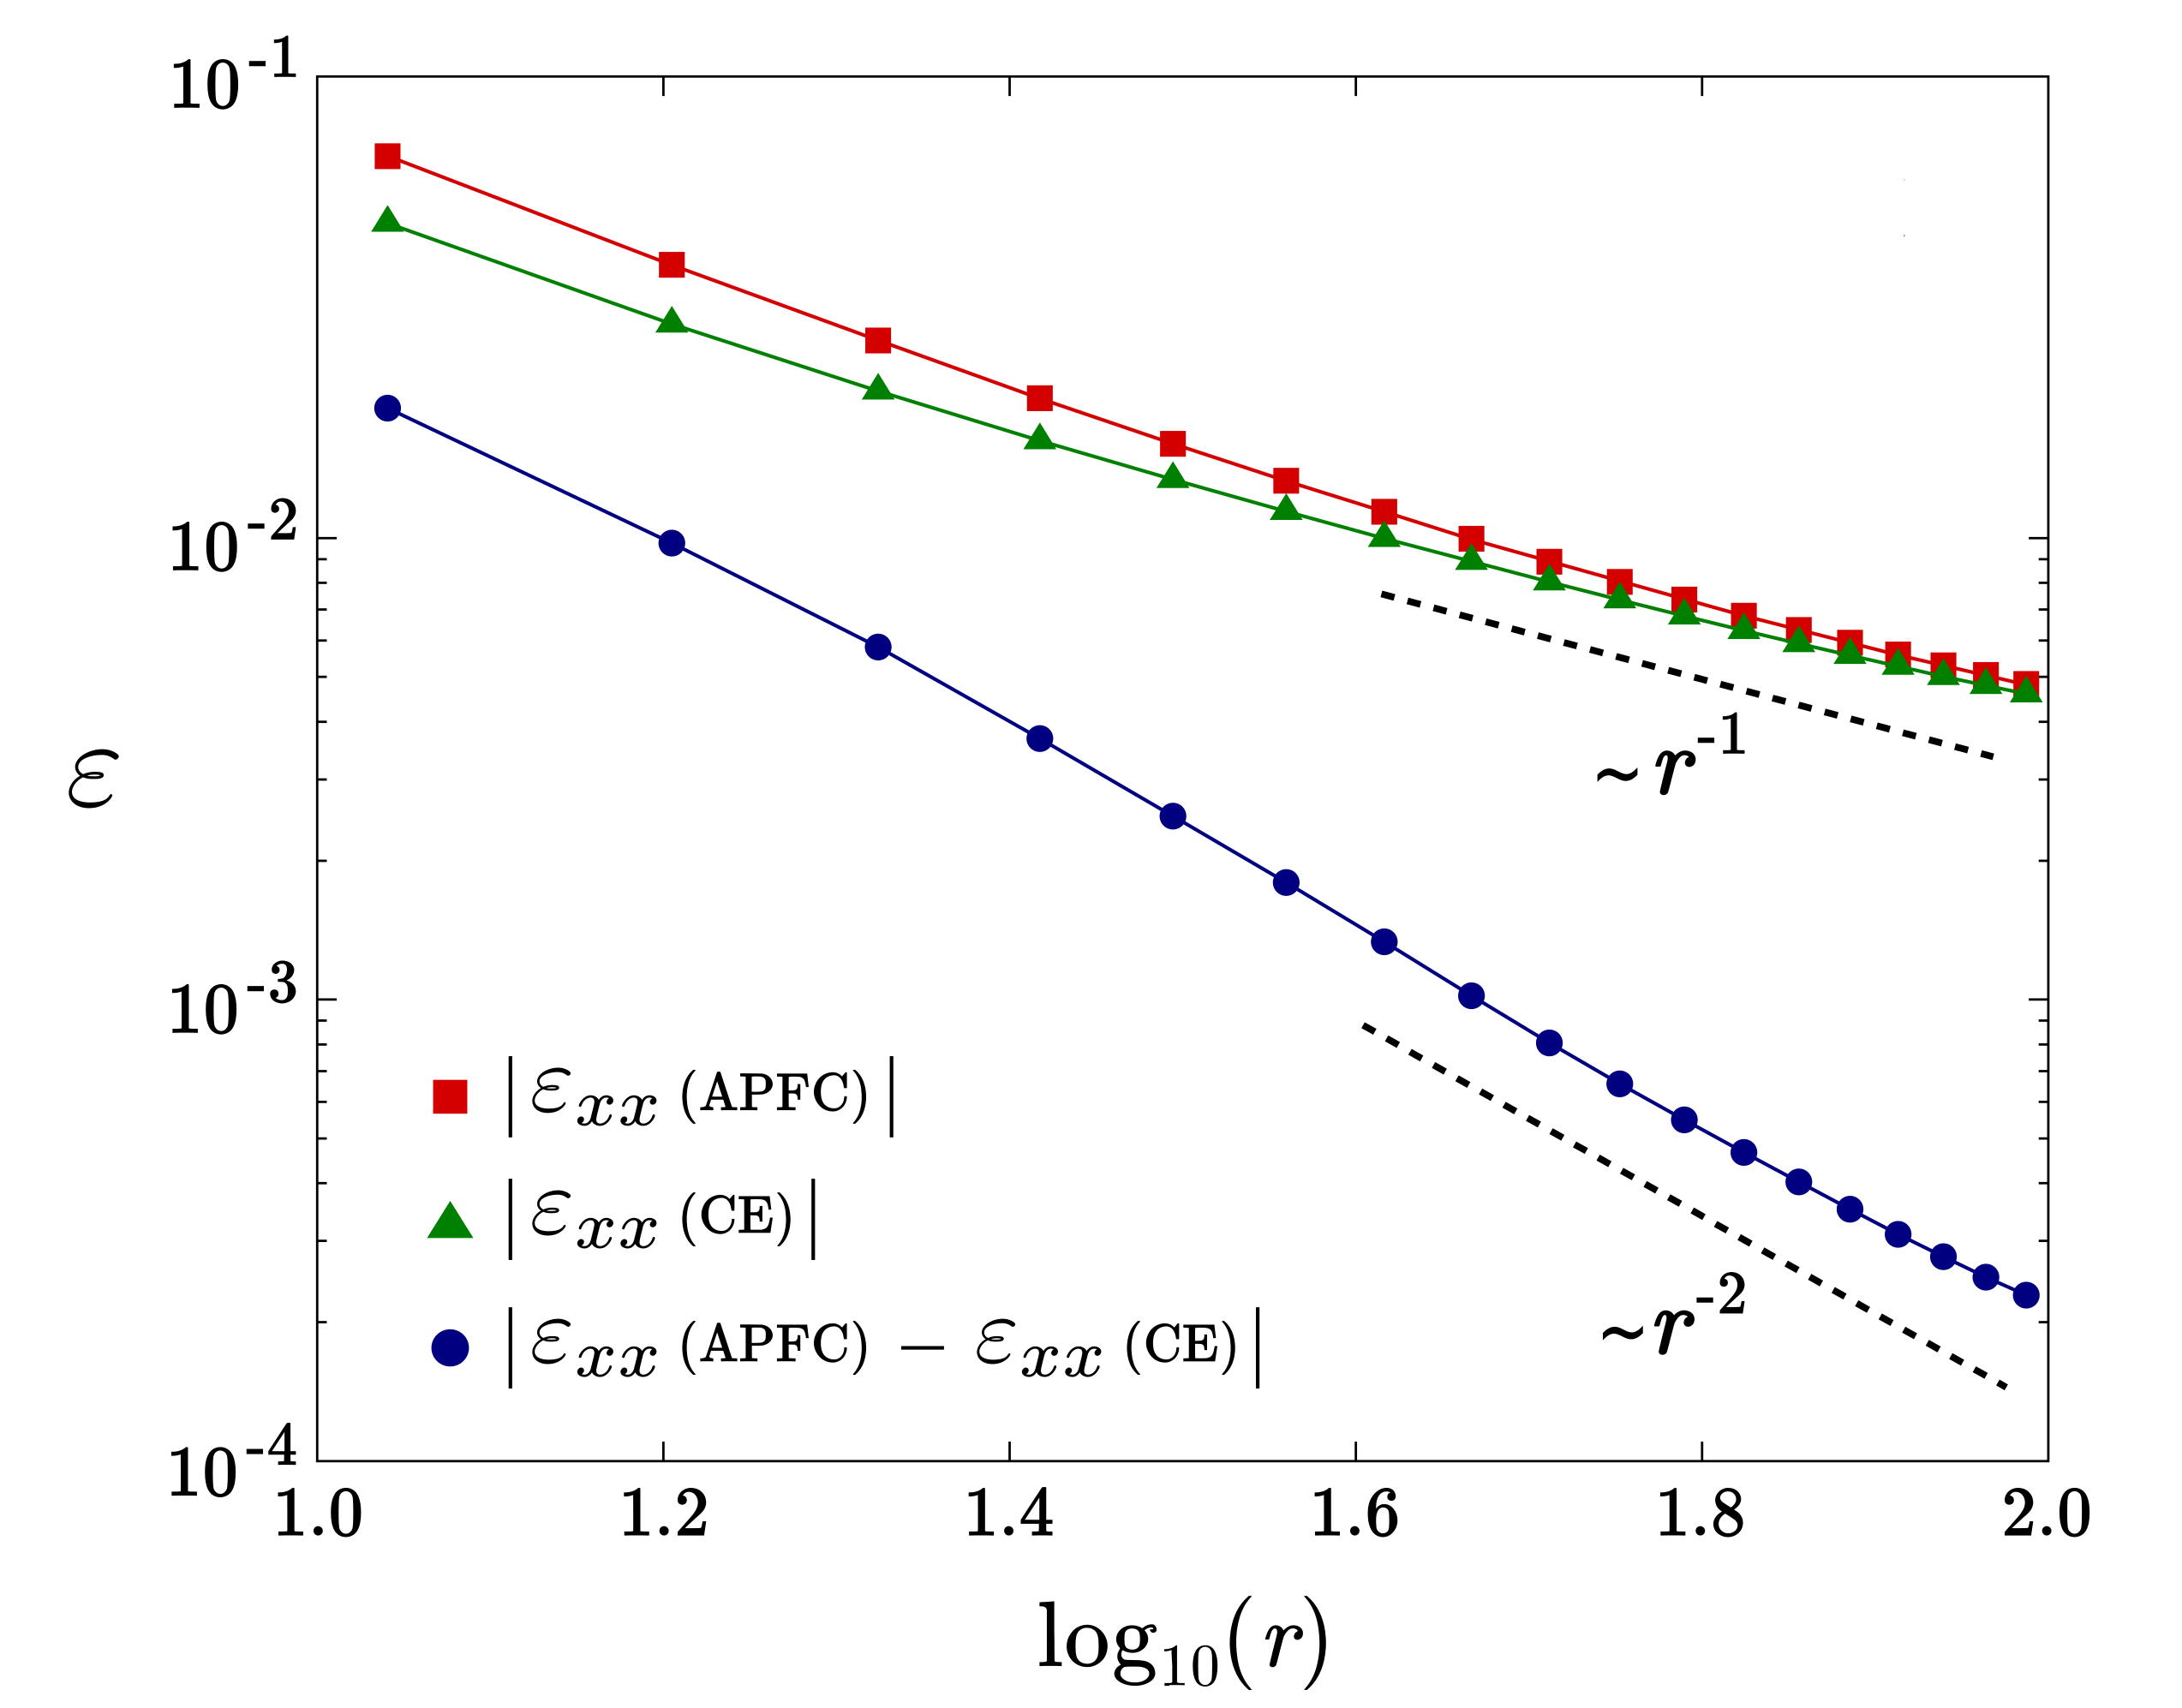
Deeper insight can be obtained by focusing on the analysis of the elastic field as in Refs. Ehrlacher2016 ; Braun2018 . Therein, the components of the strain field in the presence of a straight dislocation, , are decomposed as , with a far-field predictor of the elastic field and a correction due to the core effects. A decay , with the distance from the dislocation core, is expected in agreement with continuum elasticity theory. The dislocation core effects are characterized by a decay independently on the lattice symmetry, except for some high-symmetry nominal position of the core where with Ehrlacher2016 ; Braun2018 . corresponds to an explicit expression of . The contribution of the dislocation core can then be analysed by evaluating , with the elastic field components computed from . The scaling of these quantities is illustrated in Fig. 2 where a system as in Fig. 1 is considered with . (red squared) and (green triangles) are shown along the line (see Fig. 1(c)) with the position of one of the defects. In the large limit the strain shows a decay that is very close to , but some small deviations are observed. By evaluating the difference, , (blue circles) we observe a faster decay that scales as with recalling the more localized correction given by the dislocation core. We can then conclude that the elastic field description proposed here not only matches the description of continuum elasticity far from dislocation cores but also includes a correction that may be ascribed to atomic-scale effects.
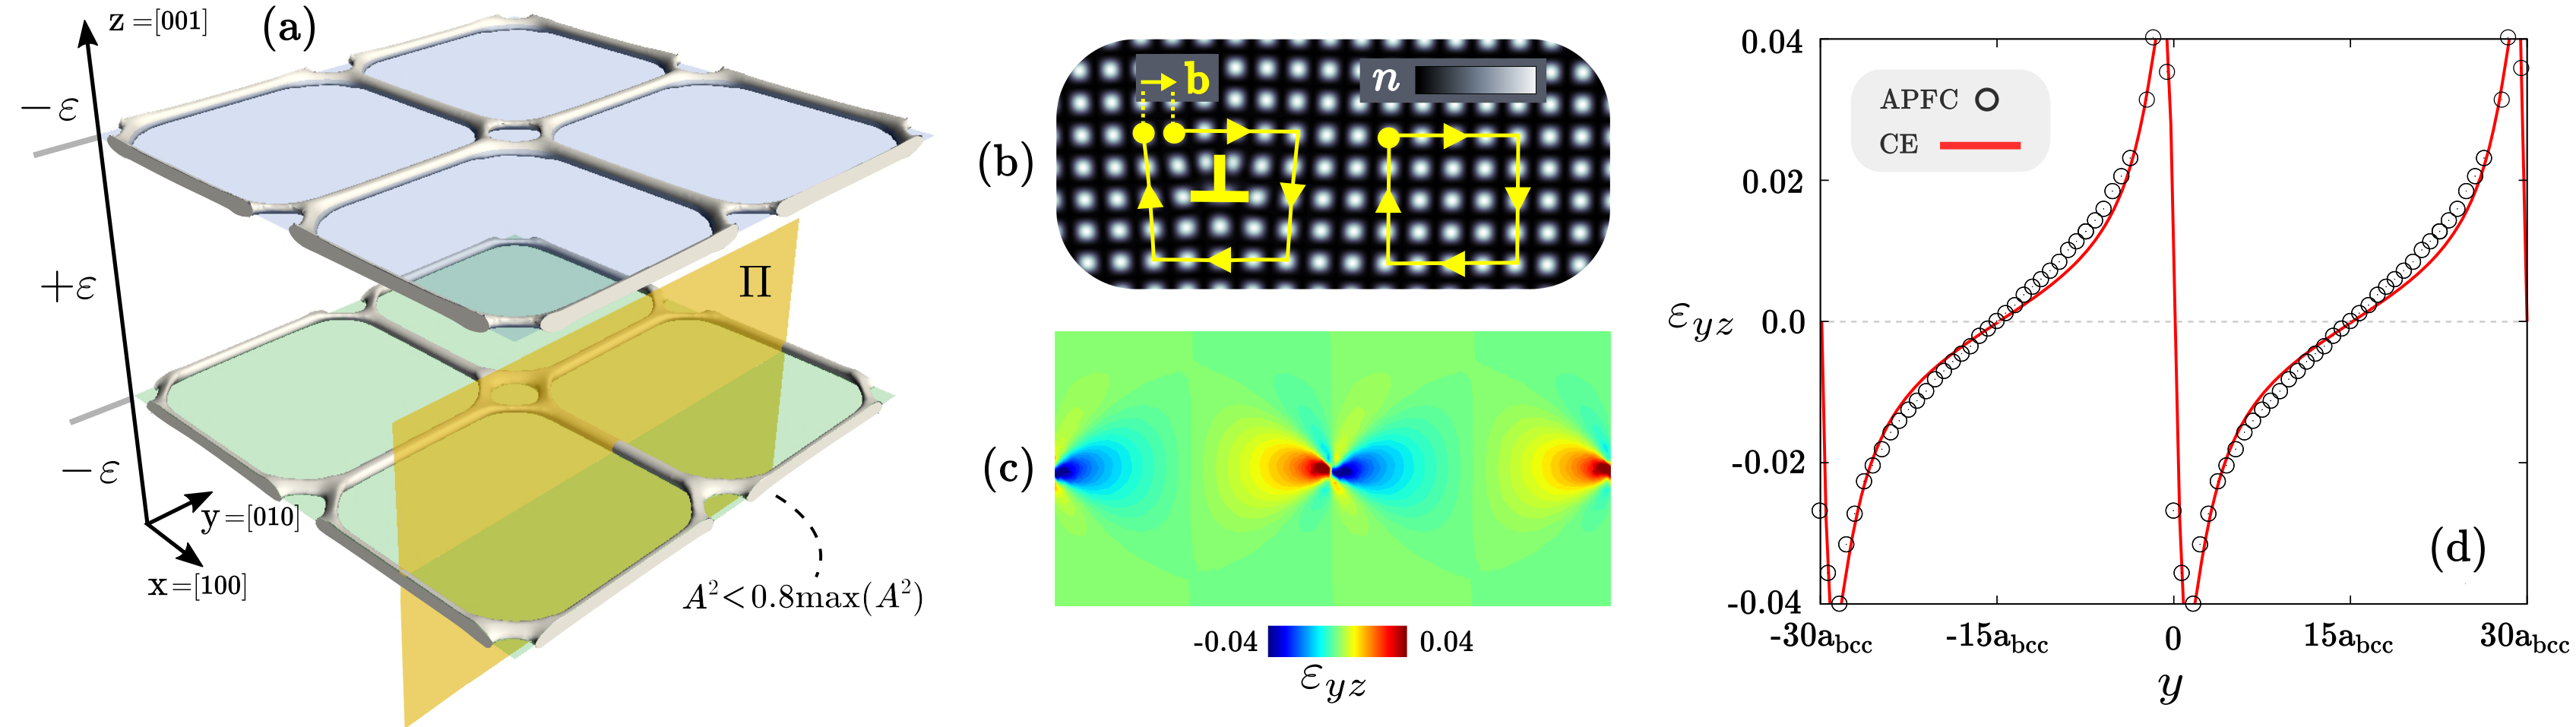
The evaluation of the elastic field can be readily provided also in 3D regardless the lattice symmetry (see also Supplementary Information S2). We consider now a configuration with peculiar 3D features as shown in Fig. 3. An initial condition mimicking layers with opposite, biaxial strain along the and direction is considered. ’s are initialized as in Fig. 1 with SalvalaglioAPFC2017 and, without loss of generality, we select a crystal having bcc lattice symmetry (by setting accordingly, see Supplementary Information S1). The size of the domain is set to , with the lattice constant for bcc arrangements. Interfaces between layers are (001) planes. APFC simulations account for the formation of dislocation networks at the interface as shown in Fig. 3(a). In this figure, the grey structure corresponds to the region where , i.e. to the defects as significantly decreases. The initial interfaces between layers are higlighted by blue (top) and green (bottom) planes. The atomic structure at the defects as constructed by Eq. (8) and the Burgers vector (here ) are illustrated in Fig. 3(b) in a small 2D region around the defect lying on the yz-plane highlighted in Fig. 3(a). The strain field computed from amplitudes is illustrated by means of in Fig. 3(c). By accounting for the parallel dislocations forming along both the in-plane directions, the elastic field can be approximated by continuum elasticity (CE). A comparison of as obtained from amplitudes (APFC), computed by the simulations illustrated in Fig. 3(a), and from CE, by adapting the equations of Supplementary Information S2 (accounting then for two sets of dislocations oriented along and directions and having perpendicular Burgers vector as in Fig. 3(b)), is reported in Fig. 3(d) showing a general agreement similar to Fig. 1. Large length-scale decays as in Fig. 2, not explicitly addressed here, are expected also in this case Ehrlacher2016 ; Braun2018 .
Lattice rotations and polycrystalline systems
We focus here on the analysis of deformations and rotations in polycrystalline systems, which involve the evolution of small-angle GBs. We study first a simple system made of a straight GB forming between two crystals with a symmetric tilt. In particular, a rectangular domain, with and , is considered with a straight vertical GB at the center. The relative tilt angle between the two crystals, namely , is set by initializing the functions as
| (6) |
with and the counterclockwise rotation matrix. A tilt is imposed for the left and the right part of the simulation domain respectively (see also Fig. 4(a)). By using periodic boundary conditions a GB with infinite extension is considered. A second GB is also expected, that is shared between the left and right periodic boundary of the simulation domain. can be chosen arbitrarily while has to match the periodicity of amplitudes along . Specific details about this simulation setup can be found in Ref. SalvalaglioAPFC2017 .
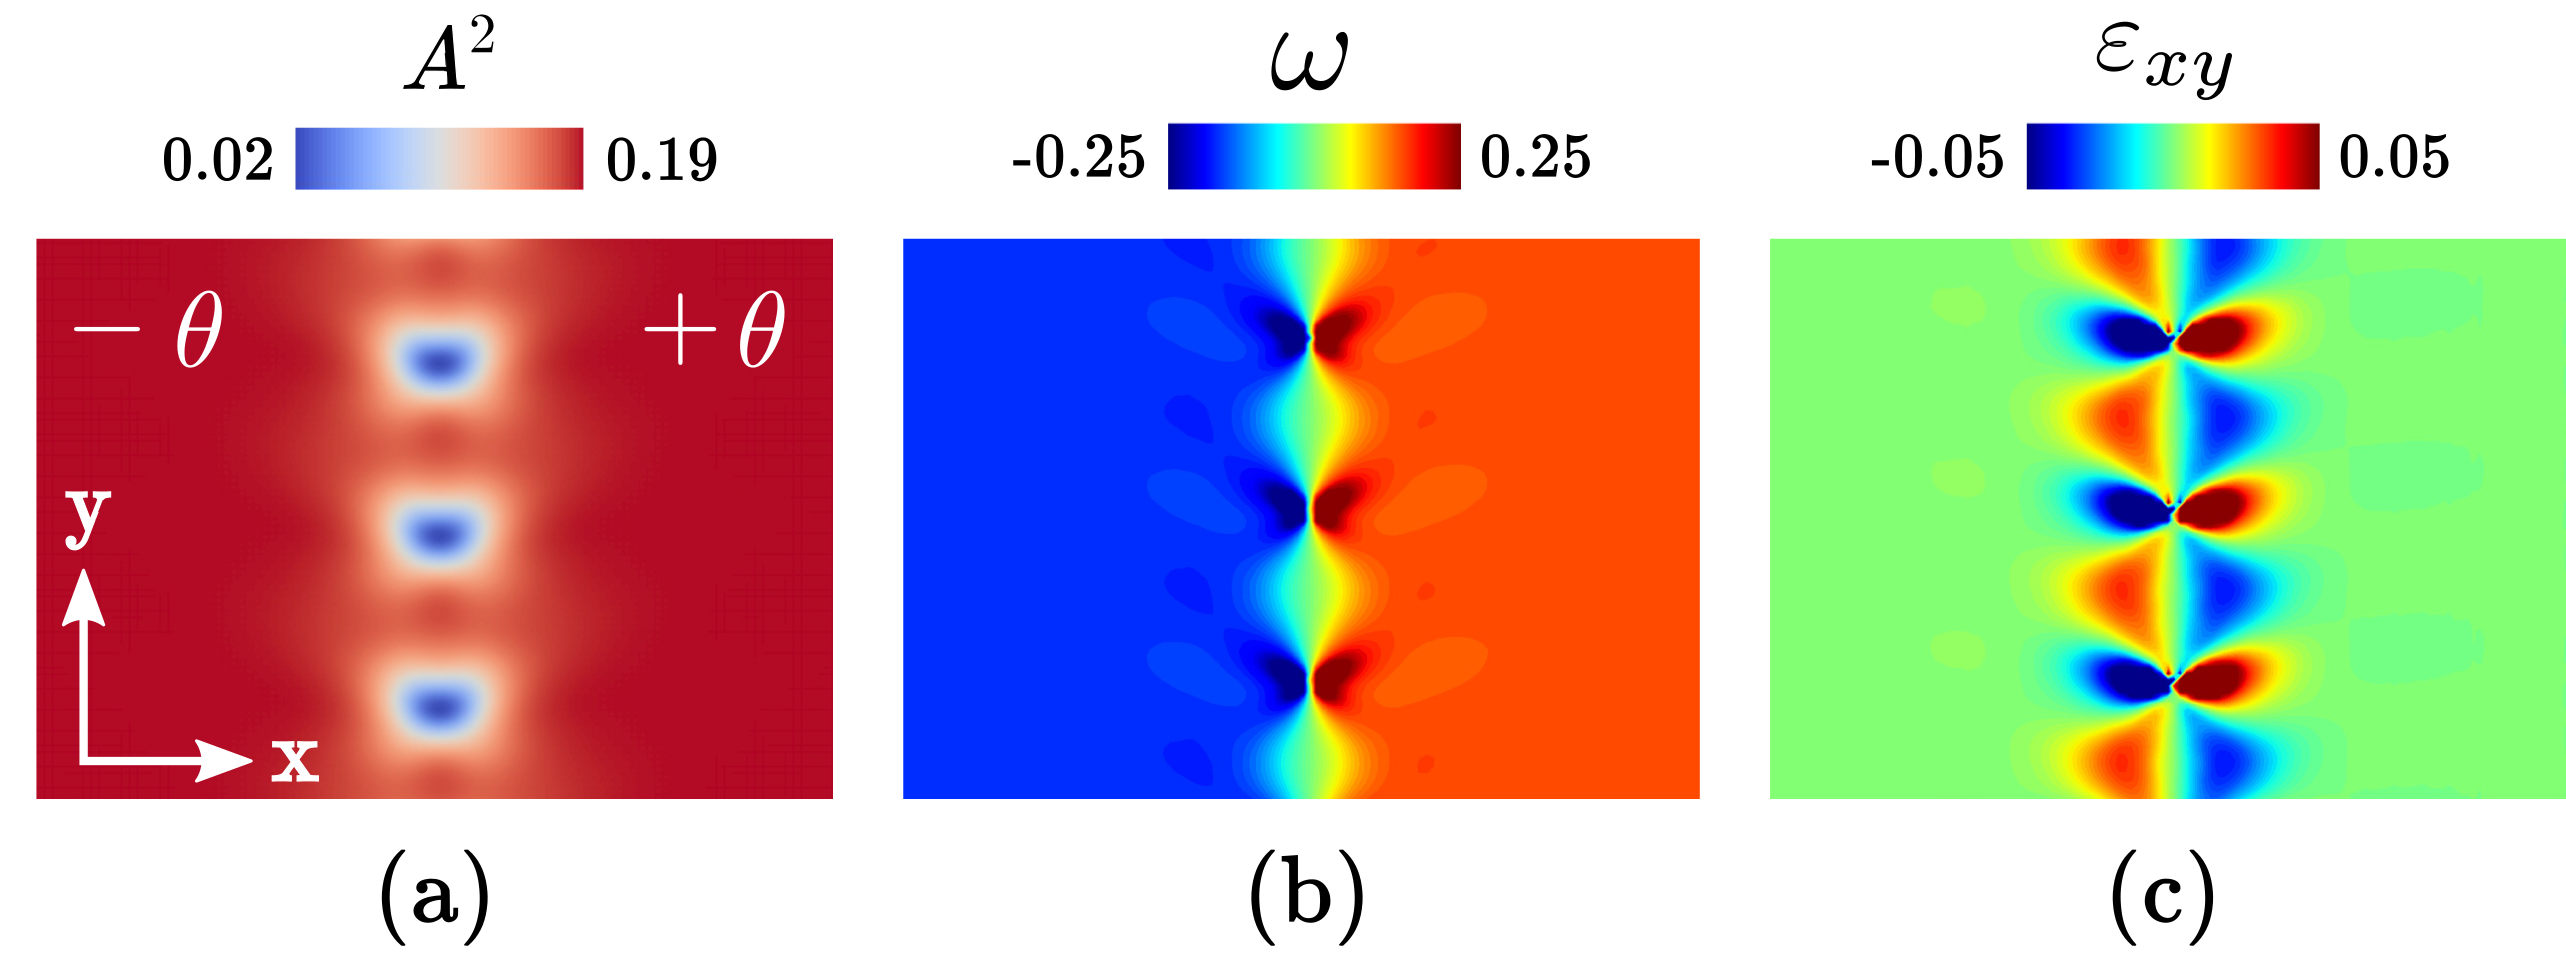
Fig. 4(a) illustrates the result of relaxing the aforementioned initial condition by means of the field in a small region at the GB, formed by an array of dislocations, showing three defects as minima of . is reported in Fig. 4(b). A constant value of this field is obtained when moving away from the GB, while a modulation at the defects and at the GB is observed, reproducing the effect of the dislocation on the local orientation of the crystal lattice. The values at which saturates in the crystals correspond to imposed in the initial condition. A measure of the tilt angle is then obtained by exploiting the deformation field. It should be noted, however, that it is not possible to directly obtain the tilt angle by inverting Eqs. (6) due to the phase term. Fig. 4(c) also illustrates the strain component , calculated from amplitudes as discussed previously. In this instance a significant superposition of the strain lobes is obtained, due to the proximity of the dislocations.
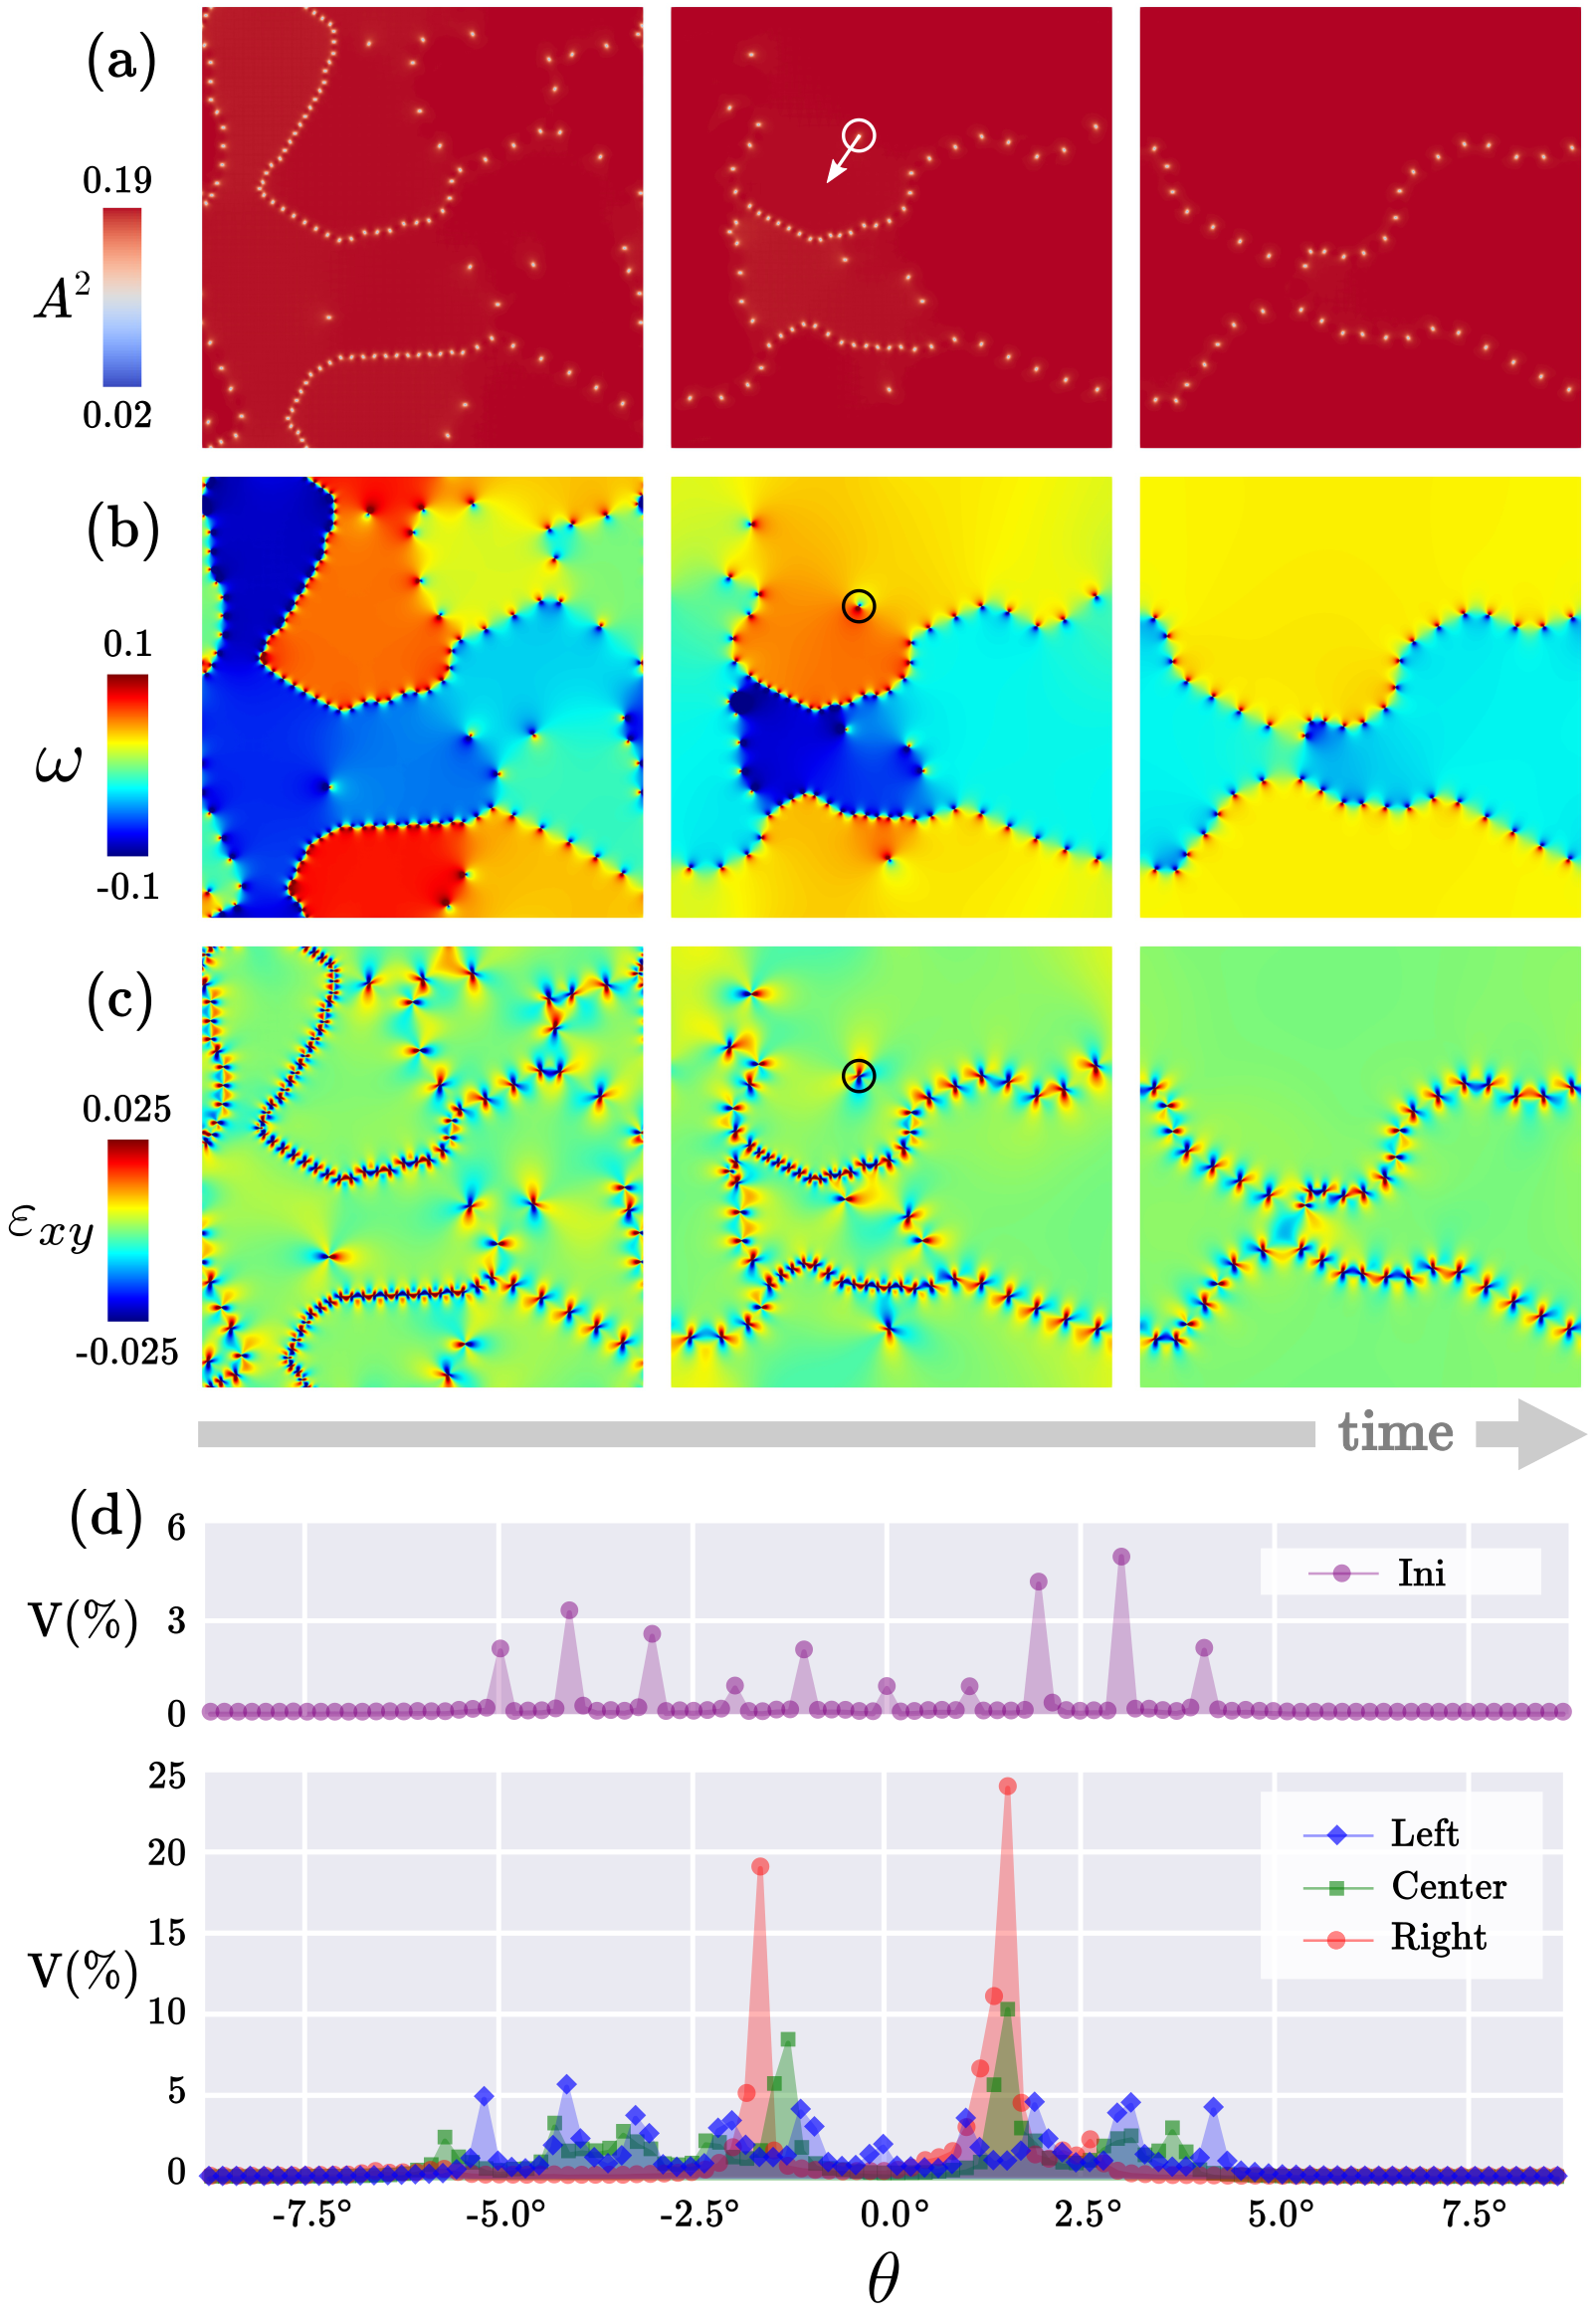
The importance of extracting the rotation of grains by means of a scalar field defined everywhere becomes more evident when looking at poly-crystalline systems, as illustrated in Fig. 5. Therein a system with is considered. The initial condition contains 10 crystal seeds, namely circular regions with with random positions, random radii ranging from to and uniformly distributed values of . According to the parameters of the free energy, the crystal phase has the lowest energy so that the crystals grow and merge forming a complex network of small-angle GBs made of dislocations. Afterward, these GBs evolve resulting in the shrinkage of some grains and the annihilation of dislocations. This is illustrated in details in Fig. 5 by means of , and starting from the merged crystal as well as by an analysis of the tilt-angle distribution over time. Faceted GBs are obtained (here in 2D corresponding to closed polygonal chains). Moreover, the motion of dislocations leading to the shrinkage of grains occurs along preferred directions related to the crystal lattice and the local tilt, revealing the accurate description achieved by APFC despite its coarse-grained nature. The velocity of a specific defect (within the white and black circles) is highlighted in Fig. 5. is nearly constant within the grains and varies at the GBs, thus it can be used to identify single grains as they are characterized by different tilts. Moreover, accounts for the contribution of single dislocations. Indeed, the features of the extracted rotation field allows for the analysis of grains as reported in Fig. 5(d). Here, the relative volume of regions having the same tilt angle within bins of is shown. The top panel illustrates the initial condition where the crystal seeds cover just a portion of the entire system. The panel at the bottom shows the analysis of the three stages shown in Fig. 5(a)-(c). By this analysis important information can be extracted, such as the volume fraction (V) occupied by grains in a specific orientation. Peaks in correspond to the grains with different orientations as shown in Fig. 5(d). Their broadening is related to the presence of defects, missing in the first stages as the crystals are separated with no dislocations. During the evolution, the relative volume of grains changes and some of them eventually disappear. Notice that before vanishing some peaks shift to larger tilts pointing out a rotation due to the proximity of the dislocations. This is in agreement with 2D atomistic calculations showing an increase of the interface energy and a rotation of the grains during similar processes Cahn04 ; Wu2012 ; Heinonen2014 .
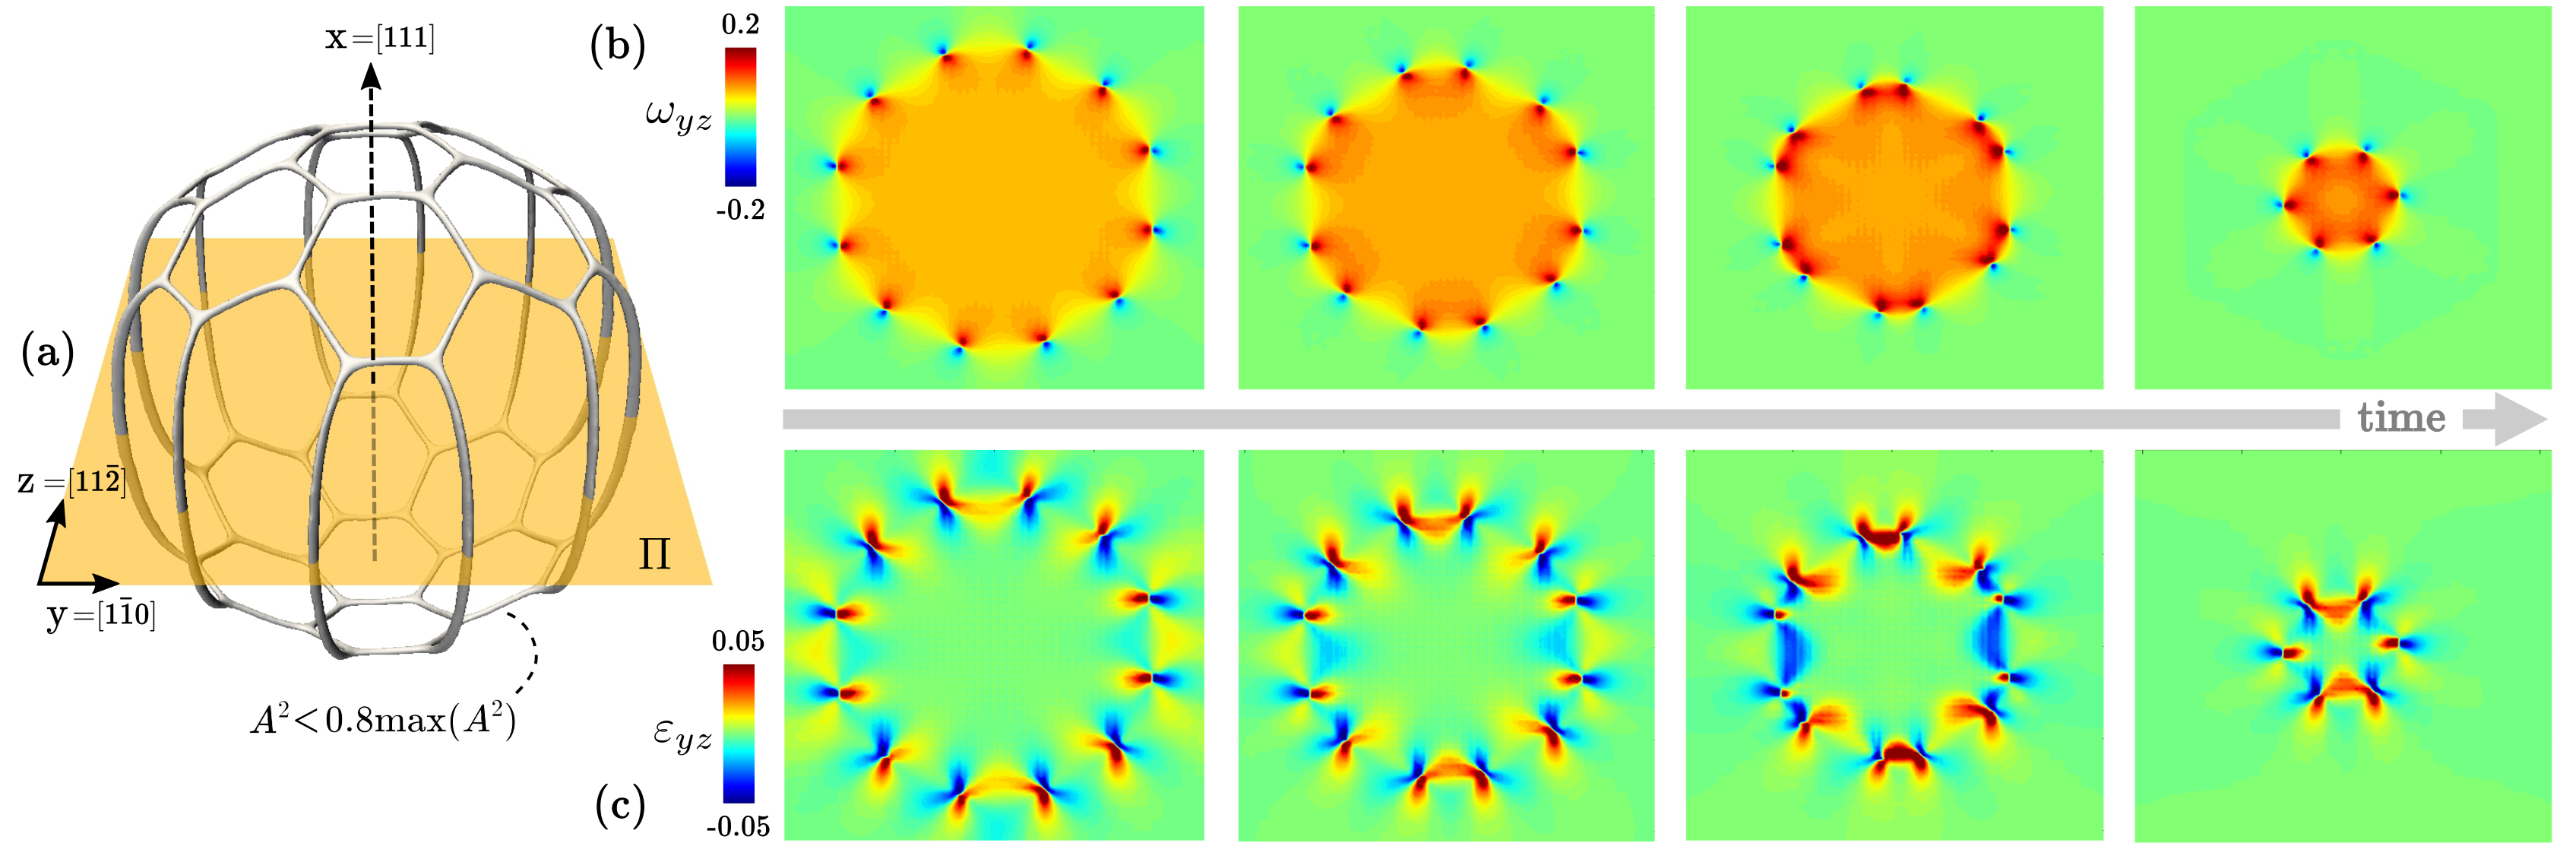
A three-dimensional system involving rotations and consisting of a single spherical crystal that is rotated with respect to the larger single crystal surrounding it is shown in Fig. 6. with the lattice constant for fcc arrangements. A rotation of about the direction is set. The initial condition for is set by exploiting Eq. (6) (see also Ref. SalvalaglioGB2018 ). The resulting dislocation network after a first relaxation phase is shown in Fig. 6(a). As in Fig. 3(a), the grey structure corresponds to the dislocations. A closed network of defects forms, having the peculiar structure of defects at twisted GBs when the surface normal of the spherical inclusion approaches the rotational axis. As expected by classical grain growth theory Doherty1997 and 3D simulations SalvalaglioGB2018 this defect network evolves leading to the shrinking of the rotated inclusion. As noticed first in Ref. Yamanaka2017 , where PFC simulations of a similar configuration with bcc lattice symmetry are reported, an anisotropic shrinkage of the grain occurs, that is faster along the rotational axis as a result of the dynamics and reaction of dislocations. However, an almost linear scaling of the grain boundary extension is expected Yamanaka2017 ; SalvalaglioGB2018 . The extraction of the rotation field on the yz-plane highlighted in Fig. 6(a) is illustrated in Fig. 6(b) at different stages during the evolution. is zero outside the inclusion and almost constant inside. Similarly to Fig. 5(a), a short wavelength modulation is observed at defects. From the color map, a rotation of the grain is observed Cahn04 ; Wu2012 ; Heinonen2014 ; Yamanaka2017 . The corresponding field is shown in Fig. 6(c).
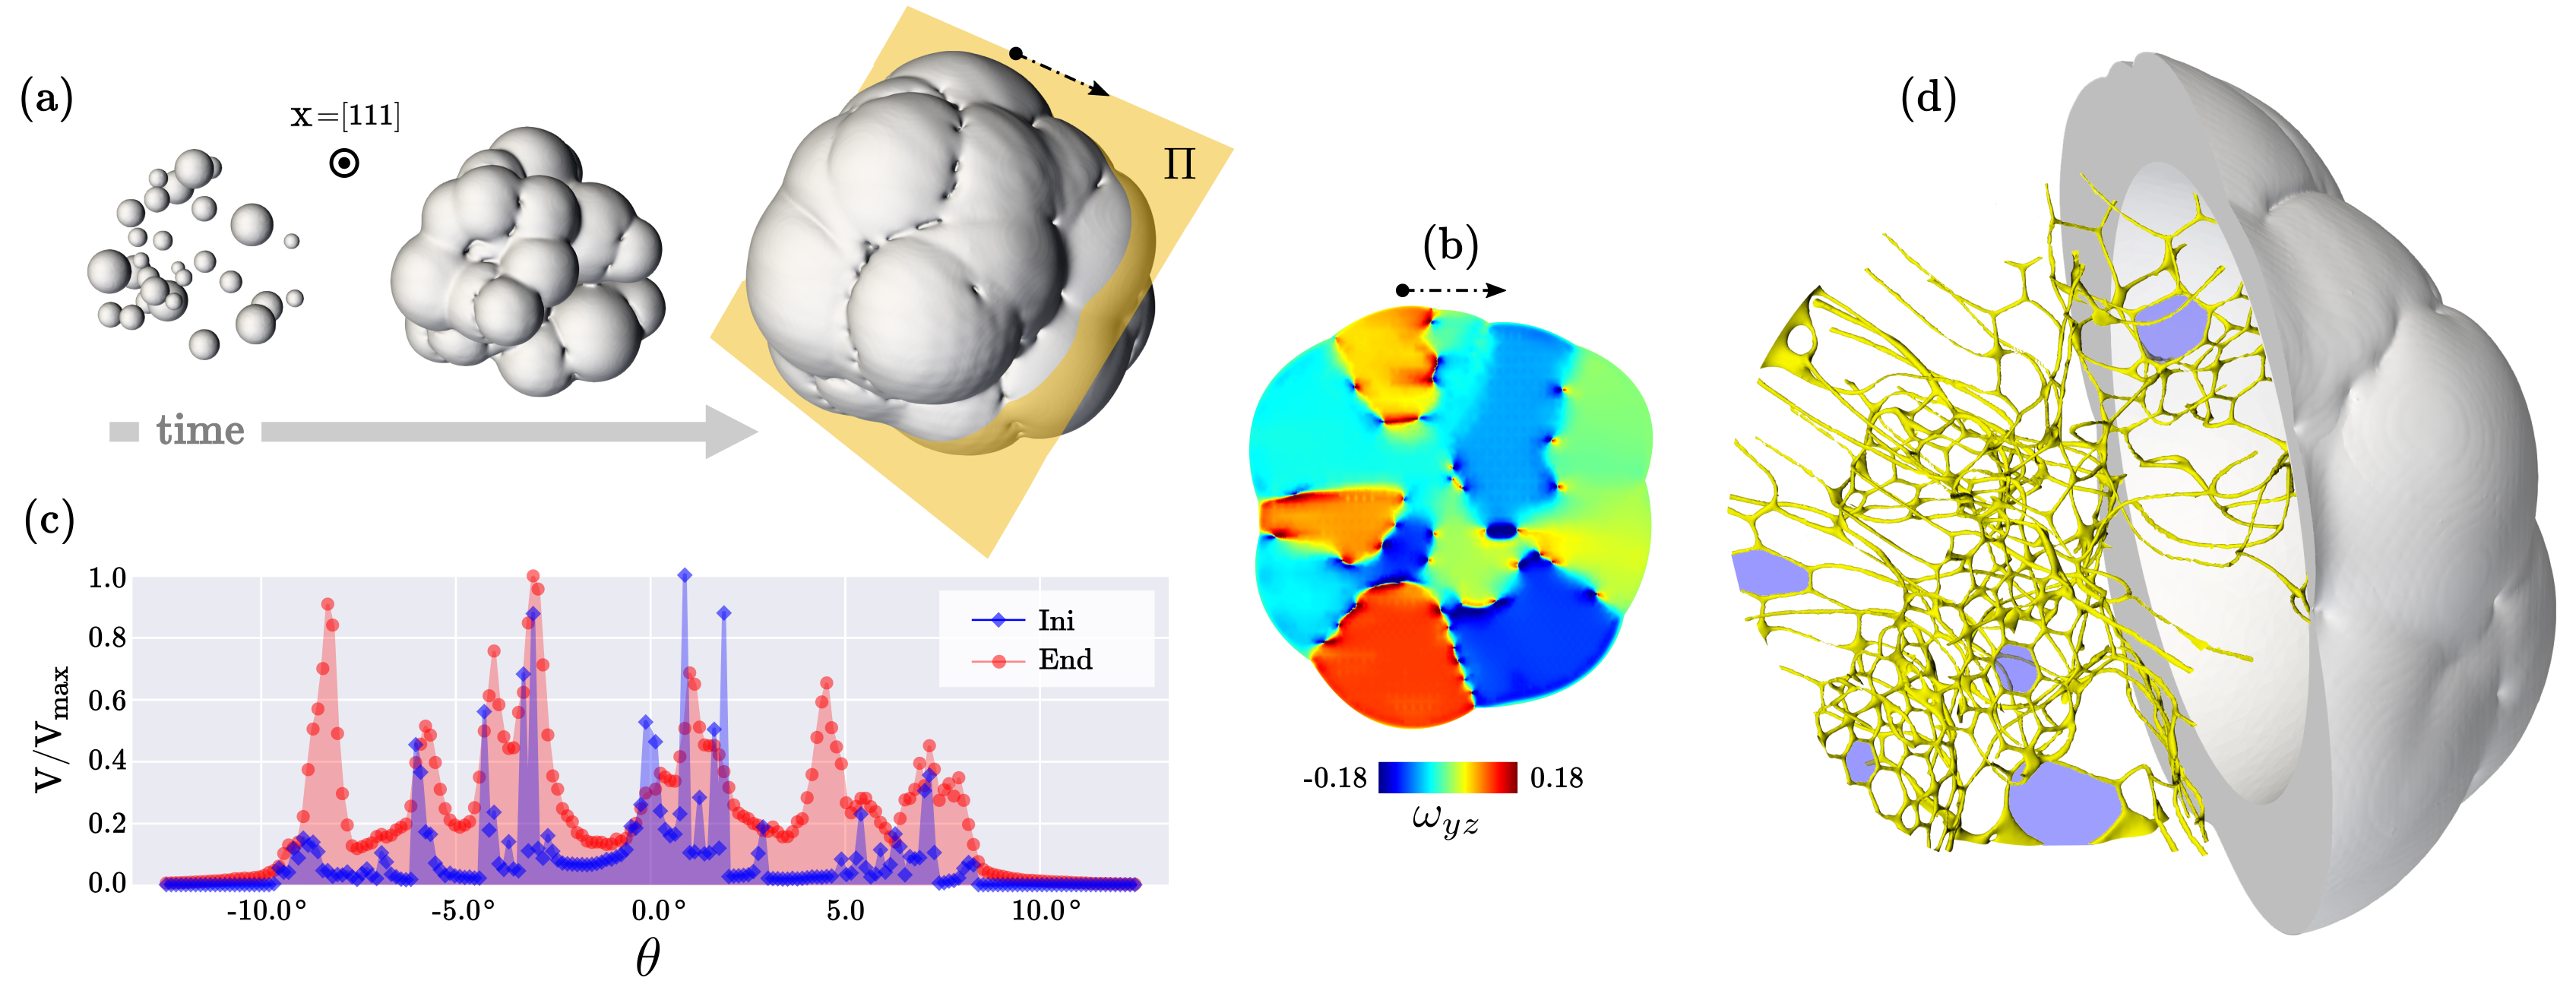
A 3D ploycrystalline system is shown in Fig. 7, where the growth of 30 crystal seeds having fcc lattice symmetry with random rotation about the [111] direction, random position and size is simulated. while the seeds are generated within a distance from the center. The evolution is illustrated in Fig. 7(a) by means of three snapshots showing the region where is significantly larger than zero. The rotation field in the plane is shown in Fig. 7(b). Fig. 7(c) illustrates the analysis of the local rotations in terms of the volume of regions with the same angles within bins of normalized with respect to the larger one. It delivers similar features as discussed Fig. 5(b). In particular, the initial configuration exhibits smaller angular dispersion than later stages, while peaks broaden due to the formation of dislocations. The capability of the adopted framework can be further appreciated in Fig. 7(d), where the complex dislocation network forming in a central (spherical) region of the growing polycrystal (last step of Fig. 7(a)) is shown. Features of the dislocation network observed in Fig. 6(a) can be here recognized, as hexagonal arrangements and elongated defects according to direction of the normal of the interface between grains. Similar dislocation networks with different spacing (e.g. see the presence of hexagons with different sizes at GB highlighted as blue shaded region) are obtained within the polycrystal due to the different relative rotations between grains.
The analysis of polycrystalline systems allows us to summarize the main findings of this work. A continuous description of lattice deformations exploiting the complex amplitudes of Fourier modes representing the periodicity of crystal lattices has been derived. Deformation fields can then be readily computed from an atomistic representation of crystals, provided that amplitude functions can be extracted, without any ad-hoc post-processing procedure and independently of system dimensionality and lattice symmetry. This framework has been shown to achieve its full potential combined with the APFC approach. Other than trivially providing a direct access to amplitudes and allowing for describing either strain or rotated crystals, the APFC model easily allows for large length-scale simulations approaching the ones typical of continuum theories, still retaining essential microscopic features. This has been further demonstrated by showing that APFC encodes dislocation-core contributions to the elastic field, which are missing in standard continuum elasticity and usually requires more refined theories Lazar2017 . The connection between amplitudes and displacements or strains enables the detailed study of the effect of any deformation which are encoded by continuous deformation fields such as displacements or strain/stress due to single dislocations or due to external loads. We explicilty illustrated that extracting the local orientation as continuous field directly enables microstructural analysis. In addition, it will enable the development of optimized numerical method as, e.g., orientation-based meshing criterion for APFC PrecondAPFC2019 .
It is worth recalling that the limitation of the APFC model in describing large deformations SpatschekPRB2010 poses some constraints to the numerical approach adopted here, but not on the derivation of the deformation fields and on the possible analysis of deformations extracted from other atomistic frameworks (e.g. the PFC model itself or experiments). Moreover, some attempts to overcome this APFC limit have been recently proposed Bercic2018 . Notice that several PFC type models, which are based on a continuous probability density can be easily converted in the proper set of amplitudes, and are therefore naturally compatible with the descriptions illustrated in this work (see e.g. Refs. Kocher2015 ; Wang2016 ). In addition, work on extensions of the PFC model can be done in order to derive the corresponding amplitude expansions as done, for instance, in Ref. Ofori-Opoku2013 with the so-called XPFC model Greenwood2010 .
Methods
Amplitude expansion of phase-field crystal model
The PFC model accounts for the lattice structure by means of a continuous periodic field describing the dimensionless atomic probability density Elder2002 ; Elder2004 ; Emmerich2012 . It is based on a free-energy functional, , that reads
| (7) |
where , , and are parameters as in Ref. Elder2007 . In the crystalline state can be generally approximated as sum of plane waves as
| (8) |
with the average density, the amplitude of each plane wave and the reciprocal space vector representing a specific crystal symmetry (see Supplementary Information S1). In the so-called amplitude expansion of the PFC model (APFC) Goldenfeld2005 ; Athreya2006 ; GoldenfeldJSP2006 , these amplitudes are the variables used to describe a given crystalline system. Lattice symmetries are described by means of a fixed set of vectors . Complex amplitudes functions allow for distortions and rotations of the crystal lattice with respect to a reference state accounted for by vectors. The free energy, expressed in terms of ’s, reads
| (9) |
with and . The term corresponds to a complex polynomial of and and depends on the specific crystalline symmetry as reported in Ref. SalvalaglioAPFC2017 for triangular, body-centered cubic (bcc) and face-centered cubic (fcc) lattices. The evolution laws for ’s read
| (10) |
Simulations
The simulations reported in this work are performed with the aid of High Performance Computing facilities JURECA exploiting the finite element toolbox AMDiS Vey2007 ; Witkowski2015 with a semi-implicit integration scheme and mesh adaptivity as reported in Ref. SalvalaglioAPFC2017 . Large, three-dimensional simulations as reported in Fig. 7 have been obtained thanks to an improvement of the numerical approach described elsewhere PrecondAPFC2019 . Periodic boundary conditions are used for all the boundaries of the simulation domains. To describe crystalline phases, the parameters entering the free energy are set to favor the crystal phase as follows: , , and ElderPRE2010 ; SalvalaglioAPFC2017 ; SalvalaglioGB2018 .
Acknowledgements
We acknowledge C. Ortner for fruitful discussions about the decay of the elastic field in the presence of dislocations and S. Praetorius for the optimization of numerical simulations. M.S. acknowledges the support of the Postdoctoral Research Fellowship awarded by the Alexander von Humboldt Foundation. A.V. acknowledges support from the German Research Foundation under Grant No. Vo899/20 within SPP 1959. K.R.E. acknowledges financial support from the National Science Foundation under Grant No. DMR1506634. We acknowledge support by the Open Access Publication Funds of the SLUB/TU Dresden. We also gratefully acknowledge the computing time granted by the John von Neumann Institute for Computing (NIC) and provided on the supercomputer JURECA at Jülich Supercomputing Centre (JSC), within the Project No. HDR06, and by the Information Services and High Performance Computing (ZIH) at TU Dresden.
References
- (1) Sethna, J. P. et al. Deformation of Crystals: Connections with Statistical Physics. Annu. Rev. Mater. Res. 47, 217–246 (2017).
- (2) Volterra, V. Sur l’équilibre des corps élastiques multiplement connexes. Annales scientifiques de l’Ecole Normale Supérieure 24, 401–517 (1907).
- (3) Taylor, G. I. The mechanism of plastic deformation of crystals. Part I. Theoretical. Proc. Royal Soc. Lond. A 145, 362–387 (1934).
- (4) Rollett, A., Rohrer, G. & Suter, R. Understanding materials microstructure and behavior at the mesoscale. MRS Bulletin 40, 951–960 (2015).
- (5) Landau, L. & Lifshitz, E. Theory of Elasticity. Course of theoretical physics (Pergamon Press, 1970).
- (6) Lazar, M. & Maugin, G. A. Nonsingular stress and strain fields of dislocations and disclinations in first strain gradient elasticity. Int. J. Eng. Sci. 43, 1157 – 1184 (2005).
- (7) Cai, W., Arsenlis, A., Weinberger, C. & Bulatov, V. A non-singular continuum theory of dislocations. J. Mech. Phys. Solids 54, 561–587 (2006).
- (8) Anderson, P., Hirth, J. & Lothe, J. Theory of Dislocations (Cambridge University Press, 2017).
- (9) Montalenti, F. et al. Fully coherent growth of Ge on free-standing Si(001) nanomesas. Phys. Rev. B 89, 014101 (2014).
- (10) Isa, F. et al. Highly Mismatched, Dislocation-Free SiGe/Si Heterostructures. Adv. Mater. 28, 884–888 (2016).
- (11) Rovaris, F., Bergamaschini, R. & Montalenti, F. Modeling the competition between elastic and plastic relaxation in semiconductor heteroepitaxy: From cyclic growth to flat films. Phys. Rev. B 94, 205304 (2016).
- (12) Bergamaschini, R., Salvalaglio, M., Backofen, R., Voigt, A. & Montalenti, F. Continuum modelling of semiconductor heteroepitaxy: an applied perspective. Adv. Phys. X 1, 331–367 (2016).
- (13) Ehrlacher, V., Ortner, C. & Shapeev, A. V. Analysis of Boundary Conditions for Crystal Defect Atomistic Simulations. Arch. Ration. Mech. Anal. 222, 1217–1268 (2016).
- (14) Braun, J., Buze, M. & Ortner, C. The Effect of Crystal Symmetries on the Locality of Screw Dislocation Cores. SIAM J. Numer. Anal. In Press (2019).
- (15) Bulatov, V. V. et al. Dislocation multi-junctions and strain hardening. Nature 440, 1174–1178 (2006).
- (16) Devincre, B., Hoc, T. & Kubin, L. Dislocation Mean Free Paths and Strain Hardening of Crystals. Science 320, 1745–1748 (2008).
- (17) Elder, K. R., Katakowski, M., Haataja, M. & Grant, M. Modeling Elasticity in Crystal Growth. Phys. Rev. Lett. 88, 245701 (2002).
- (18) Elder, K. R. & Grant, M. Modeling elastic and plastic deformations in nonequilibrium processing using phase field crystals. Phys. Rev. E 70, 051605 (2004).
- (19) Emmerich, H. et al. Phase-field-crystal models for condensed matter dynamics on atomic length and diffusive time scales: an overview. Adv. Phys. 61, 665–743 (2012).
- (20) Heinonen, V., Achim, C. V., Elder, K. R., Buyukdagli, S. & Ala-Nissila, T. Phase-field-crystal models and mechanical equilibrium. Phys. Rev. E 89, 032411 (2014).
- (21) Berry, J., Provatas, N., Rottler, J. & Sinclair, C. W. Phase field crystal modeling as a unified atomistic approach to defect dynamics. Phys. Rev. B 89, 214117 (2014).
- (22) Goldenfeld, N., Athreya, B. P. & Dantzig, J. A. Renormalization group approach to multiscale simulation of polycrystalline materials using the phase field crystal model. Phys. Rev. E 72, 020601 (2005).
- (23) Athreya, B. P., Goldenfeld, N. & Dantzig, J. A. Renormalization-group theory for the phase-field crystal equation. Phys. Rev. E 74, 011601 (2006).
- (24) Goldenfeld, N., Athreya, B. P. & Dantzig, J. A. Renormalization Group Approach to Multiscale Modelling in Materials Science. J. Stat. Phys. 125, 1015–1023 (2006).
- (25) Spatschek, R. & Karma, A. Amplitude equations for polycrystalline materials with interaction between composition and stress. Phys. Rev. B 81, 214201 (2010).
- (26) Khachaturyan, A. G. The Theory of Structural Tranformation in Solids (Wiley, New York, 1983).
- (27) Khachaturyan, A. G. Long-range order parameter in field model of solidification. Philos. Mag. A 74, 3–14 (1996).
- (28) Chen, L.-Q., Wang, Y. & Khachaturyan, A. G. Transformation-induced elastic strain effect on the precipitation kinetics of ordered intermetallics. Phil. Mag. Lett. 64, 241–251 (1991).
- (29) Bugaev, V. N. et al. q-space configurational energy and short-range order in alloys with atomic size mismatch. Phys. Rev. B 65, 180203 (2002).
- (30) Tewary, V. K. Multiscale Green’s-function method for modeling point defects and extended defects in anisotropic solids: Application to a vacancy and free surface in copper. Phys. Rev. B 69, 094109 (2004).
- (31) Varvenne, C., Finel, A., Le Bouar, Y. & Fèvre, M. Alloy microstructures with atomic size effects: A monte carlo study under the lattice statics formalism. Phys. Rev. B 86, 184203 (2012).
- (32) Varvenne, C. & Clouet, E. Elastic dipoles of point defects from atomistic simulations. Physical Review B 96, 224103 (2017).
- (33) Geslin, P.-A., Xu, Y. & Karma, A. Morphological Instability of Grain Boundaries in Two-Phase Coherent Solids. Phys. Rev. Lett. 114, 105501 (2015).
- (34) Elder, K. R., Huang, Z.-F. & Provatas, N. Amplitude expansion of the binary phase-field-crystal model. Phys. Rev. E 81, 011602 (2010).
- (35) Skaugen, A., Angheluta, L. & Viñals, J. Dislocation dynamics and crystal plasticity in the phase-field crystal model. Phys. Rev. B 97, 054113 (2018).
- (36) Skaugen, A., Angheluta, L. & Viñals, J. Separation of elastic and plastic timescales in a phase field crystal model. Phys. Rev. Lett. 121, 255501 (2018).
- (37) Salvalaglio, M., Backofen, R., Elder, K. R. & Voigt, A. Defects at grain boundaries: A coarse-grained, three-dimensional description by the amplitude expansion of the phase-field crystal model. Phys. Rev. Materials 2, 053804 (2018).
- (38) Choudhary, M. A., Kundin, J. & Emmerich, H. Phase-field crystal modeling of anisotropic material systems of arbitrary poisson’s ratio. Philos. Mag. Lett. 92, 451–458 (2012).
- (39) Salvalaglio, M., Backofen, R., Voigt, A. & Elder, K. R. Controlling the energy of defects and interfaces in the amplitude expansion of the phase-field crystal model. Phys. Rev. E 96, 023301 (2017).
- (40) Ofori-Opoku, N., Warren, J. A. & Voorhees, P. W. Self-consistent modeling of anisotropic interfaces and missing orientations: Derivation from phase-field crystal. Phys. Rev. Materials 2, 083404 (2018).
- (41) Lazar, M. Non-singular dislocation continuum theories: strain gradient elasticity vs. peierls-nabarro model. Philos. Mag. 97, 3246–3275 (2017).
- (42) Lazar, M. The fundamentals of non-singular dislocations in the theory of gradient elasticity: Dislocation loops and straight dislocations. Int. J. Solids Struct. 50, 352 – 362 (2013).
- (43) Po, G., Lazar, M., Seif, D. & Ghoniem, N. Singularity-free dislocation dynamics with strain gradient elasticity. J. Mech. Phys. Solids 68, 161 – 178 (2014).
- (44) Cahn, J. W. & Taylor, J. E. A unified approach to motion of grain boundaries, relative tangential translation along grain boundaries, and grain rotation. Acta Mater. 52, 4887 (2004).
- (45) Wu, K.-A. & Voorhees, P. W. Phase field crystal simulations of nanocrystalline grain growth in two dimensions. Acta Mater. 60, 407 (2012).
- (46) Doherty, R. et al. Current issues in recrystallization: a review. Mater. Sci. Eng. A 238, 219–274 (1997).
- (47) Yamanaka, A., McReynolds, K. & Voorhees, P. W. Phase field crystal simulation of grain boundary motion, grain rotation and dislocation reactions in a BCC bicrystal. Acta Mater. 133, 160–171 (2017).
- (48) Praetorius, S., Salvalaglio, M. & Voigt, A. An efficient numerical framework for the amplitude expansion of the phase-field crystal model. Modelling Simul. Mater. Sci. Eng. 27, 044004 (2019).
- (49) Berčič, M. & Kugler, G. Adaptive mesh simulations of polycrystalline materials using a Cartesian representation of an amplitude expansion of the phase-field-crystal model. Phys. Rev. E 98, 033303 (2018).
- (50) Kocher, G. & Provatas, N. New Density Functional Approach for Solid-Liquid-Vapor Transitions in Pure Materials. Phys. Rev. Lett. 114, 155501 (2015).
- (51) Wang, N., Bevan, K. H. & Provatas, N. Phase-Field-Crystal Model for Electromigration in Metal Interconnects. Phys. Rev. Lett. 117, 155901 (2016).
- (52) Ofori-Opoku, N., Stolle, J., Huang, Z.-F. & Provatas, N. Complex order parameter phase-field models derived from structural phase-field-crystal models. Phys. Rev. B 88, 104106 (2013).
- (53) Greenwood, M., Provatas, N. & Rottler, J. Free Energy Functionals for Efficient Phase Field Crystal Modeling of Structural Phase Transformations. Phys. Rev. Lett. 105, 045702 (2010).
- (54) Elder, K. R., Provatas, N., Berry, J., Stefanovic, P. & Grant, M. Phase-field crystal modeling and classical density functional theory of freezing. Phys. Rev. B 75, 064107 (2007).
- (55) Jülich Supercomputing Centre. JURECA: Modular supercomputer at Jülich Supercomputing Centre. Journal of large-scale research facilities 4 (2018).
- (56) Vey, S. & Voigt, A. Amdis: adaptive multidimensional simulations. Comput. Visual. Sci. 10, 57–67 (2007).
- (57) Witkowski, T., Ling, S., Praetorius, S. & Voigt, A. Software concepts and numerical algorithms for a scalable adaptive parallel finite element method. Adv. Comput. Math. 41, 1145 (2015).
![[Uncaptioned image]](/html/1808.05190/assets/x1.png)
![[Uncaptioned image]](/html/1808.05190/assets/x2.png)
![[Uncaptioned image]](/html/1808.05190/assets/x3.png)
![[Uncaptioned image]](/html/1808.05190/assets/x4.png)