A Primary Radiation Standard Based on Quantum Nonlinear Optics
Abstract
The spectrum of vacuum fluctuations of the electromagnetic field is determined solely from first physical principles and can be seen as a fundamental property that qualifies as a primary radiation standard. We demonstrate that the amplitude of these quantum fluctuations triggering nonlinear optical processes can be used as a reference for radiometry. In the spontaneous regime of photon pair generation, the shape of the emitted spectrum is nearly independent of laboratory parameters. In the high-gain regime, where spontaneous emission turns to stimulated emission, the shape of the frequency spectrum is uniquely determined by the number of created photons. Both aspects allow us to determine the quantum efficiency of a spectrometer over a broad range of wavelengths without the need of any external calibrated source or detector.
The desire to understand thermal radiation helped lead to the development of quantum mechanics. For its part, quantum mechanics was crucial for the accurate description of electromagnetic radiation. As a consequence, the black body—a perfect absorber at thermal equilibrium—remains to this day the primary source of light for radiometry hollandt20055 . Currently, the only alternative is synchrotron radiation, whose description relies on classical electrodynamics and which requires costly and large facilities lemke1967synchrotron . In our article, we exploit the quantum properties of nonlinear optical processes to introduce a primary radiometric standard that is straightforwardly realized with equipment available in most quantum optics labs.
The quantum-mechanical fluctuations of the electromagnetic vacuum, originating from the non-vanishing bosonic commutation relation of the photons, exhibit a unique frequency spectrum. At the same time, the rate of spontaneous photon generation crucially depends on the amplitude of those fluctuations. We use the spectrum of the vacuum, as well as its nonlinear amplification, as a primary standard to infer the spectral response and efficiency of an optical system. Parametric down-conversion (PDC), a nonlinear optical process based on three-wave mixing with only one input field, gives us direct access to the bare spectrum of the vacuum. In fact, the vacuum fluctuations are the dominant frequency-dependent contribution to phase-matched spontaneous PDC, resulting in a spectral shape that is nearly independent of any laboratory parameters. In the high-gain regime, the nonlinear amplification distorts this spectrum in a specific way, allowing one to extract the number of down-converted photons only from the spectral shape of the emission. Thus, the spectrum of the vacuum fluctuations that leads to the creation of the biphoton field is a standard that gives us access to a radiometric realization, which is here the number of emitted photons.
Photon-pair generation lies at the heart of other radiometric calibration methods. Coincidence measurements, for instance, have been used to determine the quantum efficiency of photodetectors klyshko1980use ; malygin1981absolute ; polyakov2007high ; rarity1987absolute . In another strategy, which also relies on the brightness of the vacuum, the ratio between seeded and unseeded PDC allows one to measure the spectral radiance of a light source klyshko1977utilization ; kitaeva1979measurement ; migdall1998measuring . However, in contrast to the latter, our method exploits the spectrum of the vacuum itself, as well as its unique behaviour in the strong-coupling regime. In that respect, the same radiometric principles pertaining to black-body radiation can be applied to our source. Using these insights, we determine the absolute quantum efficiency of a spectrometer over a broad spectral range, without using any reference detector. As a first step, we obtain the spectral response of the spectrometer using spontaneous PDC—this is a relative calibration. Then, we deduce the parametric gain and the spectral quantum efficiency from the shape of high-gain PDC spectra. Our experimental results compare well against the ones obtained with a reference lamp, and the quantum efficiency agrees with expected values, thereby demonstrating a promising novel method to produce a primary radiation standard.
In general, a source can serve as a primary radiation standard if, within a specified bandwidth centered on the wavelength , the exact number of emitted photons is known. However, the number of counts recorded by a detector do not, usually, coincide with due to a non-perfect quantum efficiency of the detecting device. These quantities are simply connected through the relation
| (1) |
Measuring while having a precise knowledge of allows the determination of , which is at the heart of the absolute calibration of spectrometers. The spectral efficiency can be further separated into its relative spectral shape , i.e. the response function of the measurement device, and a wavelength-independent proportionality constant —through . While a relative calibration procedure gives , obtaining the full spectral quantum efficiency requires an absolute calibration. In the following we demonstrate in a two-step procedure that both relative and absolute calibration can be performed using PDC.
The total number of photons reaching the detector depends on the photon-number distribution per plane-wave mode characterizing the source, and on the modes that are detected. Using standard radiometric formalism, this fact translates to the expression suppl
| (2) | ||||
where the first integral can be approximated by the transverse area of the source and the duration of the emission multiplied by the speed of light . The second integral incorporates the modes that are detected and can be approximated by the bandwidth and solid-angle of the detector, if does not vary significantly over these quantities. In order to connect the plane waves to the solid angle and the wavelength, which are the relevant quantities for a spectrometer 111In radiometry, the quantity is the spectral radiance, or the energy per units of time, area of the source, solid angle and bandwidth (in wavelength) of the detector., we also introduced the quantity , which is proportional to the mode density klyshko1989photons . If is known, we have all the necessary quantities for the absolute calibration of a spectrometer. For black-body radiation, is derived from physical principles, namely the photon-distribution at thermal equilibrium with a certain temperature.
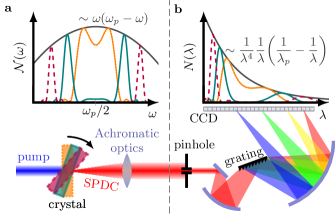
During the three-wave mixing process of PDC, pump photons (of frequency ) interact with the vacuum field within a crystal with a nonlinearity. This process leads to the generation of pairs of photons known as the signal and the idler. In the spontaneous regime (low pump intensity), the photon distribution , a function of frequency and emission angle, depends on the amplitude of the vacuum fluctuations, the profile of the pump beam, the gain of the amplification process and a phase-matching function. For a monochromatic plane wave pump of amplitude and a crystal of thickness , the photon-number distribution of spontaneous PDC is given by
| (3) |
where and are the signal and idler refractive indices, and is the mismatch between the longitudinal wave vectors of the pump, the signal, and the idler, respectively klyshko1989photons ; lemieux2016engineering . The frequency-dependent factors and arise from the quantization of the electric field for the signal and for the idler. In the spontaneous regime of pair creation, those factors embody the amplitude of the vacuum fluctuations for the biphoton field. To denote the coupling strength, we use the gain parameter , which we can assume to be constant over the frequency range of interest suppl .
The last factor of equation (3) is the well-known phase-matching function of a bulk crystal. At exact phase-matching, vanishes and the phase-matching function takes on the value unity. Thus, the phase-matched distribution takes its maximal value and reads
| (4) |
where we assumed that photon energy is conserved in the parametric process, such that . For absolute calibration, we need a complete knowledge of , but it is difficult to determine experimentally in the spontaneous regime of PDC. However, we note that the photon number for different phase-matching conditions follows a parabola, as illustrated in Fig. 1a. Because does not depend on laboratory parameters, we can make use of the shape of and perform a relative calibration [Seesupplementarymaterialof]lemieux2016engineering.
By introducing a pinhole in the far-field of the crystal, we can limit the emission solid-angle, thereby suppressing the frequency content in the other angular modes suppl . A spectrometer then disperses the light and images it onto a CCD chip; see Fig. 1b. Since the position on the chip corresponds to a particular wavelength, we expect a specific functional behavior that originates in the parabola but is modified by the different mode density spasibko2012spectral . However, any deviation of the phase-matched wavelength from this function can be assigned to detector inefficiencies and therefore to .
Since is proportional to the ratio between and the shape of , we can write
| (5) |
where and where we used the proportionality symbol because has yet to be determined. The right-hand side is evaluated at the wavelength that satisfies the phase-matching condition.
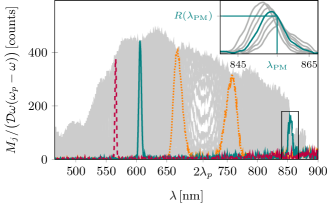
In our experiment, we pump a BBO crystal with a pulsed laser of wavelength and acquire a large number of spectra corresponding to different phase-matching conditions over a broad spectral range. The phase-matched wavelengths are tuned by tilting the nonlinear crystal, as shown in the bottom panel of Fig. 1a. We overlap all the measured spectra in Fig. 2 and highlight three of them to show their twin-peak structure. Importantly, the peak number of counts in a measured spectrum does not always occur at . In fact, any nonzero slope to displaces the peak and a simple analysis shows that it shifts in the order of , where is the standard deviation of the phase-matching function, approximated by a Gaussian. We see that the displacement from increases for a steep and a wide phase-matching function. Hence, can differ significantly from the wavelength of the peak. However, when overlapping different spectra, the maximum number of counts at one particular wavelength always yields the phase-matched measurement which follows directly from the fact that . We show this effect in the inset of Fig. 2 and give more details on the data analysis in the supplementary material suppl .
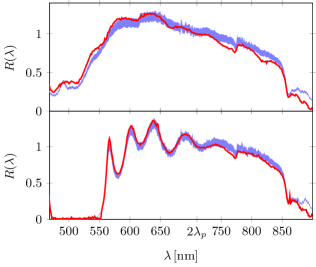
We perform the experiment in the spontaneous regime of PDC, where the number of generated photons scales linearly with the pump intensity, in order to ensure the validity of equation (3). We retrieve directly from the spectra by virtue of equation (5), where we find by taking the maximum of many spectra and we apply the arbitrary normalization , such that . The response function obtained from the spontaneous PDC agrees very well with the response function measured with a reference lamp (Fig. 3). The experiment was repeated with an additional dichroic filter to demonstrate that the method resolves rich and rapidly varying spectral features. For a proper comparison, it is crucial that the light from spontaneous PDC and from the reference lamp undergo the exact same transfer function. Thus, deviations stem from chromatic aberration, non-perfect polarization filtering as well as inaccuracies in the reference spectrum of the lamp.
To improve the precision of our method, one could include the frequency dependence of if the linear and nonlinear dispersion relations of the crystal are known. In this case, it is also straightforward to generalize equation (3) so that it incorporates the spatial and temporal profiles of the pump beam hsu2013absolute . Since we want to stress the simplicity of our procedure, we refrain from applying these corrections, but nonetheless obtain excellent results. With a knowledge of —the form of —we can accurately measure the shape of any spectrum. In the following, we perform the second step of our calibration procedure, the establishment of an absolute calibration method. In particular, we extract the number of photons from the shape of high-gain PDC spectra, based on our previous measurement of .
For an arbitrary value of the gain, the photon-number distribution under phase matching and for a monochromatic, plane-wave undepleted pump, becomes
| (6) |
which reduces to equation (4) in the spontaneous regime, i.e., for klyshko1989photons . In the high-gain regime, the phase-matched photon-number spectrum is therefore a distorted parabola, whose spectral shape (curvature) and photon number are uniquely determined by the gain parameter . In complete analogy to equation (5) we obtain the relation
| (7) |
where we introduced, for a more convenient notation, the constant for the emission and detection parameters. Note that, in contrast to equation (5), we now have an equality. Except for , all the quantities are known: we obtained from spontaneous PDC, and the shape of the phase-matched spectrum uniquely determines . We approximate by the transverse area of the pump beam, and by , with being the pump pulse duration and the number of pulses during an acquisition time. Further, we calculate the solid angle from the pinhole size in the far field of the crystal, and obtain from the bandwidth associated with a pixel of the spectrometer’s camera. The only remaining free parameter, , is obtained via fitting.
The experimental procedure for absolute calibration with high-gain PDC is very similar to the one for spontaneous PDC. We acquire a large number of densely packed spectra for different crystal tilt angles with a much higher pump energy per pulse to reach a large parametric gain. After taking the maxima of these dense spectra, we perform a bivariate curve fit using the free parameter and the pump-normalized gain , a quantity that allows us to suppress the pulse energy drift of our pump laser over the acquisition time, and where a relative measurement of is sufficient. We then obtain the spectral quantum efficiency by taking the product , with inferred from the spontaneous measurement and from the high-gain regime.
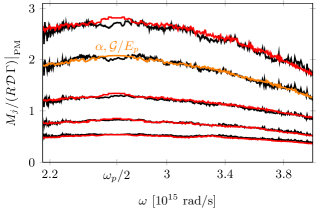
In the absolute calibration measurement, we use a pump energy four times higher than in the spontaneous configuration. We show the maxima of the spectra and the fit (orange curve) in Fig. 4. The quantum efficiency at , extracted from fitting, is , where the error is mainly due to our uncertainty in the pulse duration and transverse profile of the pump. Note that includes all the losses in the optical setup, from the nonlinear crystal to the detector. The estimated quantum efficiency of the experimental setup, based on the efficiency of each optical component, is . The largest source of loss is the diffraction grating of the spectrometer, with an efficiency of 60% at , as reported by the manufacturer. In addition, we tested the consistency of the fit parameters by repeating the measurement with other pump energies. Using the previously obtained value of , and estimating the gain from and a new measurement of , we obtain the red curves (Fig. 4), which also show excellent agreement with experimental data.
We note that equation (6) is based on a theoretical description where the pump is a monochromatic plane wave. The validity of this model in the context of a pulsed laser has been discussed dayan2007theory and verified experimentally by looking at the exponential increase in the number of photons with the pump power agafonov2010two ; allevi2014coherence ; brida2009systematic ; perez2014bright ; spasibko2012spectral . To our knowledge, the results presented in Fig. 4 are the first experimental demonstrations of the distortion of the phase-matched spectral shape of light generated by a pulsed laser for increasing gain, and as such provide additional support for this description of PDC.
In contrast to the relative calibration, the absolute calibration using high-gain PDC cannot be straightforwardly generalized to arbitrary pump beams. Corrections to the model could be implemented, for instance by taking into account the spatial profile and frequency spectrum of the pump as well as the frequency dependence of . However, our results demonstrate that even without a more sophisticated treatment, which would require the determination of many additional laboratory parameters and solving Heisenberg’s equations of motion numerically, we measure the quantum efficiency accurately.
In summary, our work is based on the spontaneous generation of photon pairs triggered by the fluctuations of the joint vacuum field associated with the biphoton. We demonstrated that the amplitude of vacuum fluctuations and its parametric amplification can serve as a primary radiation standard, and we used this insight to completely characterize a spectrometer. As a first step, we used spontaneous PDC to correct for the instrument response function of a spectrum-measuring apparatus. Then, we retrieved the spectral quantum efficiency of the apparatus using the gain-dependent frequency spectrum of PDC in the high-gain regime. The spectrum of our biphoton source is based on fundamental physical principles and is therefore comparable to Planck’s law of radiation. In fact, the absolute calibration based on black-body radiation is also a two-step process, since the temperature must be accurately determined as well, often involving another measuring protocol such as filter radiometry hollandt20055 . In contrast to that, our two-step process is based solely on PDC and can therefore be performed with only one measuring apparatus, which could improve the accuracy, reliability, and reproducibility of metrological measurements.
Methods. The third harmonic (nm wavelength, ps pulse duration, Hz repetition rate, J pulse energy in the spontaneous regime, up to J in the high-gain regime) of a pulsed Nd:YAG laser is the pump for PDC from a nonlinear crystal (-BBO, 3-mm thickness, type-I phase-matching, uncoated, cut for degenerate PDC) whose phase-matching frequencies are tuned using a motorized rotation mount. A set of dichroic mirrors remove the pump after the crystal. The pump energy drift over time is monitored using a photodiode. A concave mirror of focal length is used to bring the down-converted light to the far field, where a pinhole ( diameter) selects a small solid angle. To ensure a fixed polarization, a broadband polarizing beam splitter is placed before the pinhole. A pair of lenses is used to image the pinhole onto the entrance slit of the spectrometer. The spectrometer is an imaging spectrograph (Acton SP-2558) with a CCD camera (PIXIS:100BR_eXcelon, pixels of size 20 µm 20 µm). Transverse binning is enabled, so that the signal at a certain wavelength is the sum of the photoelectron counts over all the pixels that correspond to that wavelength. The integration time for each of the 411 spectra is . Each spectrum spans the range from to . To cover this range, we need to repeat the acquisition for different angular positions of the grating (600 grooves per mm, 500-nm blaze). To reduce errors, we filter out the noise (rapidly fluctuating signal) in each spectrum with an algorithm based on fast-Fourier-transform. The spectrometer is calibrated in wavelength using a neon-argon lamp along with Princeton Instruments Intellical system. The reference lamp (an LED-stack with a diffuser, Princeton Instruments) is introduced at the crystal plane. Its spectrum is acquired using the same experimental settings.
The datasets generated during and/or analysed during the current study are available from the corresponding author on reasonable request.
References
- (1) Hollandt, J. et al. 5. primary sources for use in radiometry. Optical Radiometry. Series: Experimental Methods in the Physical Sciences, ISBN: 9780124759886. Elsevier, vol. 41, pp. 213-290 41, 213–290 (2005).
- (2) Lemke, D. & Labs, D. The synchrotron radiation of the 6-GeV DESY machine as a fundamental radiometric standard. Applied Optics 6, 1043–1048 (1967).
- (3) Klyshko, D. N. Use of two-photon light for absolute calibration of photoelectric detectors. Quantum Electronics 10, 1112–1117 (1980).
- (4) Malygin, A. A., Penin, A. N. & Sergienko, A. V. Absolute calibration of the sensitivity of photodetectors using a biphotonic field. JETP Lett. 33, 477–480 (1981).
- (5) Polyakov, S. V. & Migdall, A. L. High accuracy verification of a correlated-photon-based method for determining photon-counting detection efficiency. Optics Express 15, 1390–1407 (2007).
- (6) Rarity, J. G., Ridley, K. D. & Tapster, P. R. Absolute measurement of detector quantum efficiency using parametric downconversion. Applied Optics 26, 4616–4619 (1987).
- (7) Klyshko, D. N. Utilization of vacuum fluctuations as an optical brightness standard. Soviet Journal of Quantum Electronics 7, 591 (1977).
- (8) Kitaeva, G. Kh., Penin, A. N., Fadeev, V. V. & Yanait, Y. A. Measurement of brightness of light fluxes using vacuum fluctuations as a reference. In Soviet Physics Doklady, vol. 24, 564 (1979).
- (9) Migdall, A., Datla, R., Sergienko, A., Orszak, J. S. & Shih, Y. H. Measuring absolute infrared spectral radiance with correlated visible photons: technique verification and measurement uncertainty. Applied Optics 37, 3455–3463 (1998).
- (10) See Supplemental Material at the publisher’s website for details about the theory, the experimental method and the data analysis.
- (11) Klyshko, D. N. Photons and Nonlinear Optics (Gordon and Breach, 1989).
- (12) Lemieux, S. et al. Engineering the frequency spectrum of bright squeezed vacuum via group velocity dispersion in an SU(1, 1) interferometer. Physical Review Letters 117, 183601 (2016).
- (13) Spasibko, K. Yu., Iskhakov, T. Sh. & Chekhova, M. V. Spectral properties of high-gain parametric down-conversion. Optics Express 20, 7507–7515 (2012).
- (14) Hsu, F.-K. & Lai, C.-W. Absolute instrument spectral response measurements using angle-resolved parametric fluorescence. Optics Express 21, 18538–18552 (2013).
- (15) Dayan, B. Theory of two-photon interactions with broadband down-converted light and entangled photons. Physical Review A 76, 043813 (2007).
- (16) Agafonov, I. N., Chekhova, M. V. & Leuchs, G. Two-color bright squeezed vacuum. Physical Review A 82, 011801 (2010).
- (17) Allevi, A. et al. Coherence properties of high-gain twin beams. Physical Review A 90, 063812 (2014).
- (18) Brida, G., Meda, A., Genovese, M., Predazzi, E. & Ruo-Berchera, I. Systematic study of the PDC speckle structure for quantum imaging applications. Journal of Modern Optics 56, 201–208 (2009).
- (19) Pérez, A. M. et al. Bright squeezed-vacuum source with 1.1 spatial mode. Optics Letters 39, 2403–2406 (2014).
Acknowledgements.
We thank Orad Reshef for valuable discussions. This research was performed as part of a collaboration within the Max Planck-University of Ottawa Centre for Extreme and Quantum Photonics, whose support we gratefully acknowledge. This work was supported by the Canada First Research Excellence Fund award on Transformative Quantum Technologies and by the Natural Sciences and Engineering Council of Canada. R.F. acknowledges the financial support of the Banting postdoctoral fellowship of the NSERC and S.L. the financial support from Le Fonds de Recherche du Québec Nature et Technologies (FRQNT).Additional information. Supplementary information is available in the online version of the paper.
Author contributions. M.V.C. conceived the idea for relative calibration; S.L., E.G. and R.F. extended that idea to the absolute scheme. S.L. and R.F designed the experiment, S.L. conducted the experiment and performed the data analysis. S.L., E.G. and R.F. wrote the manuscript. M.V.C. and R.W.B. supervised the project. All authors contributed to scientific discussions.
Competing Interests. S.L., M.V.C. and R.W.B., along with coinventors Mathieu Manceau et Gerd Leuchs, and the University of Ottawa and the Max Planck Institute for the Science of Light, have a patent application (PCT/IB2017/056450) currently pending, about the relative calibration using parametric down-conversion. E.G. and R.F. declare that they have no competing financial interests.