Scale-Out Processors & Energy Efficiency
Abstract.
Scale-out workloads like media streaming or Web search serve millions of users and operate on a massive amount of data, and hence, require enormous computational power. As the number of users is increasing and the size of data is expanding, even more computational power is necessary for powering up such workloads. Data centers with thousands of servers are providing the computational power necessary for executing scale-out workloads. As operating data centers requires enormous capital outlay, it is important to optimize them to execute scale-out workloads efficiently. Server processors contribute significantly to the data center capital outlay, and hence, are a prime candidate for optimizations. While data centers are constrained with power, and power consumption is one of the major components contributing to the total cost of ownership (TCO), a recently-introduced scale-out design methodology optimizes server processors for data centers using performance per unit area. In this work, we use a more relevant performance-per-power metric as the optimization criterion for optimizing server processors and reevaluate the scale-out design methodology. Interestingly, we show that a scale-out processor that delivers the maximum performance per unit area, also delivers the highest performance per unit power.
1. Introduction
Companies like Google, Facebook, and Microsoft rely on their data centers to deliver scale-out services like streaming, social networking, and search. Such high-throughput data centers consume enormous energy while executing scale-out applications. As such, data centers consume more than three percent of total global energy and contribute to two percent of the total CO2 emissions (IEE, 2007). Economical and environmental concerns necessitate making data centers more energy efficient.
Server processors contribute significantly to the power consumption of data centers (Barroso et al., 2013). Data centers use conventional server processors (Ferdman et al., 2012a; Reddi et al., 2010) where highly speculative general-purpose processor cores are surrendered with large last-level caches (LLCs). As technology scaling provides more transistors, more cores with highly capable memory controllers and larger caches are employed in conventional processors. Prior work reveals that cores’ capabilities, off-chip memory bandwidth, interconnection networks’ bandwidth and cache size are over-provisioned with respect to what scale-out workloads need (Ferdman et al., 2012a, b, 2014; Bakhshalipour et al., 2018b; Bakhshalipour et al., 2018a). Accordingly, using the conventional methodology for scale-out data centers is a poor choice with respect to both performance and energy efficiency.
In another approach, tiled processors, which have many small and energy-efficient cores, replace conventional processors for the purpose of increasing per-server throughput as a result of using more processor cores (Wheeler, 2011). Just like conventional processors, more cores and larger caches are placed in tiled processors as a result of technology scaling. Although tiled processors improve energy efficiency and performance as compared to conventional processors (Lim et al., 2008), they make suboptimal use of silicon real estate (Lotfi-Kamran et al., 2012). Large caches found in tiled designs are not effective for scale-out workloads because such caches are much smaller than the size of the data sets and much larger than the instruction footprint. So they cannot capture the data sets anyway and are beyond what is needed for instructions. Not only large caches have long access latencies, but also they impose high power usage. Moreover, in tiled processors, as the number of tiles increases, the access latency of LLC also increases (Wheeler, 2011). Consequently, tiled methodology is not a good candidate for today’s and especially tomorrow’s energy-efficient designs.
Recent work proposed a scalable processor architecture that is based on the scale-out design methodology to maximize performance density (i.e., performance per unit area) (Lotfi-Kamran et al., 2012). The building block of the resulting processors named scale-out processors is a pod. A pod is a module that combines a few cores with a small LLC to form a server. A pod runs an operating system and has its own software stack. A scale-out processor consists of one or more pods with no inter-pod connectivity. With scale-out processors, technology scaling results in increasing the number pods. Prior work showed that scale-out processors maximize performance density (PD) (Lotfi-Kamran et al., 2012) and improve total cost of ownership (TCO) (Grot et al., 2012) as compared to tiled and conventional processors.
Previous work optimized scale-out processors using performance per unit area due to the importance of die area at 40 nm fabrication technology. But in technologies below 20 nm, both at the chip level and at data centers, power and energy are number one constraints (Esmaeilzadeh et al., 2011; Barroso et al., 2013). While scale-out processors offer the highest performance density (Lotfi-Kamran et al., 2012), it is not clear if they are optimal with respect to energy efficiency. To shed light on this issue, in this work, we use a similar methodology as prior work (Lotfi-Kamran et al., 2012) but use performance per power as the optimization criterion.
Our experiments show that scale-out processors that are optimized for performance density are also optimal with respect to energy efficiency and vice versa. In this work, we make the following contributions:
-
•
We use a system that consists of both processors and DRAM to evaluate the energy efficiency of various processor organizations.
-
•
We show that for the technology node that we considered, the optimal pod configuration using performance per power is the same as what has been obtained using performance density.
-
•
We show that the optimal pod configuration does not change for a large variety of technology nodes and DRAM parameters.
2. Methodology
Prior work (Lotfi-Kamran et al., 2012) came up with a methodology to allocate the limited resources (mainly area) to the various components of a multi-core processor targeting maximization of throughput per unit area. In this work, we attempt to efficiently allocate power to various components targeting maximization of energy efficiency. Furthermore, we discuss how the optimal pod configuration changes if various characteristics of the system change. We use a combination of cycle-accurate simulation, analytic models and technical reports for this study.
2.1. Design and technology parameter
We analyze various designs in 14 nm technology using 0.8 volts for chip supply voltage. Our area constraints set to 280 , our power budget for all designs sets to 95 W. We also use up to 6 single-channel DDR4 interfaces in our chip designs.
| Components | Area | Power | ||||||||||
| Cores |
|
|
|
|||||||||
| LLC | 16-way SA | 0.62 Per MB | 0.2 W per MB | |||||||||
| Interconnect | 0.2-4.5 | 5 W | ||||||||||
| DDR4 controller (PHY+controller) | 12 | 5.7 W | ||||||||||
| SoC components | 42 | 5 W | ||||||||||
Table 1 contains a summary of design parameters. Reported powers are estimation of real power on our workloads. We use three different core types in our study. Conventional processors represent aggressive, 4-way, highly speculative core microarchitecture. Tiled and scale-out processors are evaluated by two different core types. The first model is a 3-way high-performance out-of-order core representing ARM Cortex-A15 (Turley, 2010) and the second model is a dual-issue in-order core, similar to Cortex-A8 (Baron, 2006). We set all cores’ frequency to 2 GHz in order to make comparison between different architectures convenient. Cache area and power parameters are extracted from CACTI 6.5 (Muralimanohar et al., 2007).
Area of different SoC components derived from scaling micrograph of a Nehalem processor in 45 nm technology (Kumar and Hinton, 2009). We extract DDR4 DRAM power consumption parameters using published DDR4 power characteristics (Vogelsang, 2010). As DRAM cannot easily be scaled beyond 20 nm technology (dra, 2007; Sohail et al., ), we assume 20 nm DRAM in this study. We consider at most 70% utilization for DDR4 memory channels (David et al., 2011). Power of other SoC components estimated by modeling Sun UltraSPARC T2 configured using McPAT v0.8 (Li et al., 2009).
2.2. Chip organizations
For each design, we use as many cores and as much cache as we can without violating any constraints in area, power or memory bandwidth. Maximum required memory bandwidth determines the number of memory controllers in our designs. Performance and power estimation methodologies are described in Sections 2.4 and 2.5, respectively.
2.2.1. Conventional
Conventional processor can accommodate at most 17 cores before reaching the specified power budget. Three DDR4 memory controllers are sufficient to serve the off-chip demands. We use 48 MB of LLC in the processor. Cores and caches are connected through a crossbar interconnect.
2.2.2. Tiled with OoO cores
Tiled OoO processor can accommodate 139 cores before reaching the power constraint. We use 80 MB of LLC in this processor. A mesh interconnect with 3-cycle delay per hop for both link and router is used for all tiled designs.
2.2.3. Tiled with in-order cores
By keeping the same LLC size as tiled OoO design, tiled in-order design has 225 cores and 80 MB of LLC. In this design, power constraint restricts the number of cores.
2.2.4. Scale-out
For determining core count and cache size of scale-out design, we have done an extensive evaluation changing the cache from 1 to 8 MB and core count from 1 to 256.
2.3. Scale-out workloads
We take scale-out workloads from CloudSuite. Our workloads include Data Serving, MapReduce, SAT Solver, Web Frontend, and Web Search. We have two MapReduce workloads in our suite, classification (MapReduce-C) and word count (MapReduce-W).
2.4. Performance evaluation
As cycle-accurate full-system simulation is 100,000 times slower than real hardware (Wenisch et al., 2006), it is impractical to search the whole design space with time-consuming simulations. Instead, we use an analytic model (Hardavellas, 2009; Lotfi-Kamran et al., 2012) that its parameters derived from simulations. This model predicts performance based on cache size, cache miss ratio, core count, cache access latency and memory access latency.
To derive parameters of the analytic model, we use full-system simulation. For full-system simulation of different pod sizes, we use Flexus (Flexus, 2012), which is built on top of Virtutech Simics. Flexus extends Simics functional model with detailed models of OoO and in-order cores and the cache hierarchy.
We evaluate 10 seconds of execution of each workload using SimFlex sampling methodology (Wenisch et al., 2006). For each measurement, we load checkpoints with warmed caches and branch predictors, and then run 100 K cycles to reach the steady state before collecting measurements for the subsequent 50 K cycles. For Data Serving workload, we need to run the simulations for 2000 K cycles to reach the steady state. We use the ratio of the number of application instructions to the total number of cycles (including the cycles spent executing operating system code) to measure performance; this metric has been shown to accurately reflect overall system throughput (Wenisch et al., 2006). Throughput measured with 95% accuracy and an average error rate lower than 4%.
2.5. Power evaluation
We use McPAT for power estimation of SoC components. For cores, however, recent studies show that McPAT is not accurate for power analysis due to the differences between core structure and its implementation (Xi et al., 2015). As an alternative, prior work has shown that Instruction per Cycle (IPC) is strongly correlated to the power consumption (Rodrigues et al., 2013; Contreras and Martonosi, 2005; Bircher and John, 2012). For example, Bircher and John (Bircher and John, 2012) report an average of only 3% error in core’s power usage when compared to the measured CPU power. Moreover, Rodrigues et al. show that it is possible to estimate a core’s power usage with an average error rate of less than 3.9% using performance counters (Rodrigues et al., 2013). Using these approaches requires having power and energy numbers of the examined cores. For this purpose, we use the empirical power reports from the published technical report (Vasilakis and Katevenis, 2015) for cores’ power estimation.
3. Results
We first find the optimal pod size for each core type and then replicate pods in each design to reach one of the constraints. Subsequently, we compare the resulting scale-out processor with tiled and conventional architectures. Finally, we compare performance-density optimal scale-out processors against their performance-per-power optimal counterparts.
3.1. System with out-of-order cores
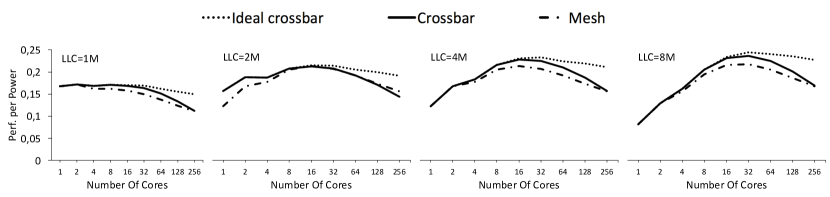
Average performance per power () across all workloads for four different LLC sizes is shown in Figure 1. Larger cache sizes are not investigated as they deteriorate performance per power. Each graph contains three lines corresponding to three different interconnect types.
We observe that in all designs and regardless of cache size and interconnect, performance per power diminishes as the number of cores starts to exceed 32. A system with 16 cores, 4 MB of LLC and a crossbar interconnect maximizes . This is identical to the pod that maximizes performance per unit area (Lotfi-Kamran et al., 2012).
Based on circumstances discussed in Section 2, our scale-out processor design at 14 nm is power-limited and can accommodate eight pods. The resulting system area and power are 253 and 87 W (with DRAM 130 W), respectively.
Scale-out design with out-of-order cores achieves higher as compared to the conventional processor due to using simpler cores and a smaller LLC. Also, a scale-out design has notable advantages over tiled designs with respect to : its overall is 26% higher than the tiled design. This advantage stems from inefficient large cache size and long inter-hop latency in tiled architectures.
3.2. System with in-order cores
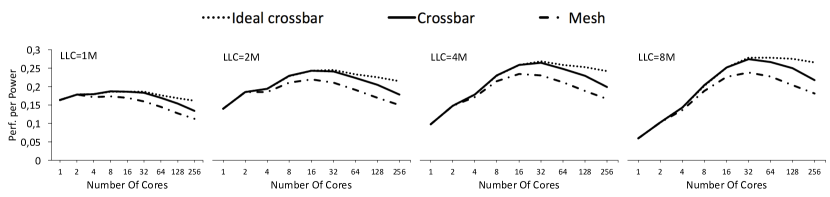
Figure 2 shows the average performance per power of different processors across all workloads. Based on these results, a -optimal pod contains 32 cores with 4 MB of LLC and a crossbar interconnect. Again, the -optimal pod with in-order cores is identical to the performance-density optimal pod (Lotfi-Kamran et al., 2012). This is because scale-out processors are tuned for the characteristics of scale-out workloads: (1) massive request-level parallelism, (2) large instruction footprint, and (3) enormous datasets in the main memory.
Resulting scale-out processor with in-order cores can afford seven pods before violating the power budget. With all peripherals and interconnect, scale-out chip’s total die-area is 193 and consumes 86 W (with DRAM 139 W).
The scale-out chip with in-order cores offers 43% higher as compared to a tiled design. Furthermore, it achieves higher over conventional designs.
3.3. Sensitivity of Optimal Pod Configuration to Design Parameters
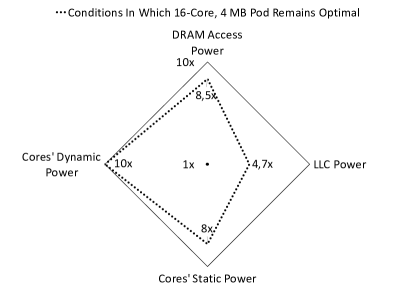
We perform a study on how the optimal pod will change if parameters of the design change. We use OoO small cores in this study. All the remaining design aspects are the same as previous experiments. LLC power usage, core’s static and dynamic power, and DRAM access energy are the main elements of this study. We sweep the energy usage of these components from to of the current values to see how these changes affect the optimal pod configuration. Figure 3 shows the results of our study. The solid rectangles indicate the state space while the dotted rectangles show parts of the state space in which the optimal pod configuration does not change. The figure clearly shows that the 16-core, 4-MB pod remains the optimal pod configuration for a large range of parameters.
Figure 3a shows that changing cores’ dynamic power by 10 does not change the optimal pod configuration. Moreover, cores’ static power affects the optimal pod configuration only when it is increased by of its current value. Power-hungry cache system that at least consumes more power, moves us towards having a smaller pod with fewer cores and a smaller LLC. On the other hand, increasing the DRAM access energy by more than does the exact opposite. A power-hungry DRAM calls for a pod with a larger LLC to filter out more data accesses.
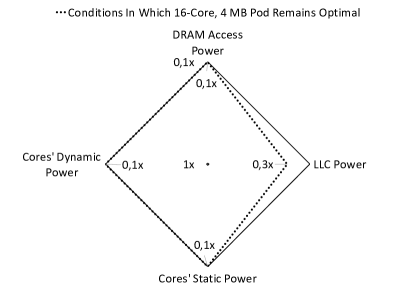
Figure 3b shows that a 10 decrease in core power or DRAM access energy does not change the optimal pod configuration. Moreover, a low-power LLC only affects the optimal pod configuration when its power usage becomes of its current value. This means that in more advanced technology nodes in which the energy of the core, cache, and DRAM is not expected to change significantly, the optimal pod configuration is likely to remain the same.
| 14 nm | |||||||||
|---|---|---|---|---|---|---|---|---|---|
| Processor Design | Constraint | Cores | LLC (MB) | MCs | Area () | Performance | Power (Watt) | PD | |
| Conventional | Power-limited | 17 | 48 | 3 | 161 | 23 | 105 | 0.14 | 0.22 |
| Tiled (OoO) | Power-limited | 139 | 80 | 3 | 280 | 86 | 128 | 0.31 | 0.67 |
| Scale-Out (OoO) | Power-limited | 128 | 32 | 5 | 253 | 109 | 130 | 0.43 | 0.84 |
| Tiled (In-Order) | Power-limited | 225 | 80 | 5 | 224 | 80 | 137 | 0.36 | 0.58 |
| Scale-Out (In-Order) | Power-limited | 224 | 28 | 6 | 193 | 116 | 139 | 0.60 | 0.83 |
3.4. Summary
Table 2 summarizes our chip-organization, power consumption, limiting factor, area, performance, power, PD and in 14 nm technology. As we consider DRAM dynamic power in our study, reported powers are more than the power budget that we set in Section 2, however, all chips consume less power than the limit. Performance column shows average user-instruction per clock cycle (Wenisch et al., 2006) that the corresponding design can deliver.
Our study indicates that a single pod configuration is optimal for both energy efficiency and performance density. Also, many technological changes in the cache, core or DRAM do not change the optimal pod configuration. We also showed how the pod configuration would change if characteristics of the components change significantly.
4. Related Work
There are proposals that optimize data-center cost, power, and/or area with an efficient processor architecture. Such pieces of prior work (Kgil et al., 2006; Hardavellas et al., 2011; Lotfi-Kamran et al., 2012; Grot et al., 2012) partially share some of the insights and/or conclusions of this work. Our work is different from prior work on scale-out processors (Lotfi-Kamran et al., 2012; Grot et al., 2012) in many aspects. Unlike those studies that target area as the optimization criterion, we use energy efficiency. While prior work (Grot et al., 2012) showed that a performance-density (PD) optimal processor also offers better energy efficiency, this work is the first to show that a PD-optimal processor is also optimal with respect to energy efficiency. Moreover, unlike prior work, we included DRAM energy in our study. Finally, we study the effect of variations of subsystem characteristics on the optimal pod configuration.
5. Conclusion
As the primary constraint of data centers is power usage, server processors that are optimized for scale-out workloads should exhibit excellent energy efficiency. For this purpose, we revisited the scale-out design methodology with respect to energy efficiency. We found that in many real-world conditions (like the ones in our study), the scale-out processors that are optimal with respect to performance density are also optimal with respect to energy efficiency.
References
- (1)
- IEE (2007) 2007. Report to congress on server and data center energy efficiency public law 109-431. Public Law 109 (2007), 431.
- dra (2007) 2007. Semiconductor Industry Association. International technology roadmap for semiconductors, 2007.
- Bakhshalipour et al. (2018b) Mohammad Bakhshalipour, Pejman Lotfi-Kamran, Abbas Mazloumi, Farid Samandi, Mahmood Naderan, Mehdi Modarressi, and Hamid Sarbazi-Azad. 2018b. Fast Data Delivery for Many-Core Processors. IEEE Transactions on Computers (TC) (2018).
- Bakhshalipour et al. (2018a) Mohammad Bakhshalipour, Pejman Lotfi-Kamran, and Hamid Sarbazi-Azad. 2018a. Domino Temporal Data Prefetcher. In International Symposium on High Performance Computer Architecture (HPCA). IEEE, 131–142.
- Baron (2006) Max Baron. 2006. The F1: TI’s 65nm Cortex-A8. Microprocessor Report 20, 7 (July 2006), 1–9.
- Barroso et al. (2013) Luiz André Barroso, Jimmy Clidaras, and Urs Hölzle. 2013. The Datacenter as a Computer: An Introduction to the Design of Warehouse-Scale Machines (2nd ed.). Morgan and Claypool Publishers.
- Bircher and John (2012) W. L. Bircher and L. K. John. 2012. Complete System Power Estimation Using Processor Performance Events. IEEE Trans. Comput. 61, 4 (April 2012), 563–577. DOI:http://dx.doi.org/10.1109/TC.2011.47
- Contreras and Martonosi (2005) Gilberto Contreras and Margaret Martonosi. 2005. Power Prediction for Intel XScale®Processors Using Performance Monitoring Unit Events. In Proceedings of the International Symposium on Low Power Electronics and Design (ISLPED). 221–226. DOI:http://dx.doi.org/10.1145/1077603.1077657
- David et al. (2011) Howard David, Chris Fallin, Eugene Gorbatov, Ulf R. Hanebutte, and Onur Mutlu. 2011. Memory Power Management via Dynamic Voltage/Frequency Scaling. In Proceedings of the 8th ACM International Conference on Autonomic Computing. 31–40.
- Esmaeilzadeh et al. (2011) Hadi Esmaeilzadeh, Emily Blem, Renee St. Amant, Karthikeyan Sankaralingam, and Doug Burger. 2011. Dark Silicon and the End of Multicore Scaling. In Proceeding of the 38th Annual International Symposium on Computer Architecture (ISCA). 365–376.
- Ferdman et al. (2012a) Michael Ferdman, Almutaz Adileh, Onur Kocberber, Stavros Volos, Mohammad Alisafaee, Djordje Jevdjic, Cansu Kaynak, Adrian Daniel Popescu, Anastasia Ailamaki, and Babak Falsafi. 2012a. Clearing the Clouds: A Study of Emerging Scale-Out Workloads on Modern Hardware. In Proceedings of the 17th International Conference on Architectural Support for Programming Languages and Operating Systems (ASPLOS). 37–48.
- Ferdman et al. (2012b) Michael Ferdman, Almutaz Adileh, Onur Kocberber, Stavros Volos, Mohammad Alisafaee, Djordje Jevdjic, Cansu Kaynak, Adrian Daniel Popescu, Anastasia Ailamaki, and Babak Falsafi. 2012b. Quantifying the Mismatch between Emerging Scale-Out Applications and Modern Processors. ACM Transactions on Computer Systems 30, 4 (Nov. 2012), 15:1–15:24.
- Ferdman et al. (2014) M. Ferdman, A. Adileh, O. Kocberber, S. Volos, M. Alisafaee, D. Jevdjic, C. Kaynak, A. D. Popescu, A. Ailamaki, and B. Falsafi. 2014. A Case for Specialized Processors for Scale-Out Workloads. IEEE Micro 34, 3 (May 2014), 31–42. DOI:http://dx.doi.org/10.1109/MM.2014.41
- Flexus (2012) Flexus. 2012. http://parsa.epfl.ch/simflex. (2012).
- Grot et al. (2012) Boris Grot, Damien Hardy, Pejman Lotfi-Kamran, Babak Falsafi, Chrysostomos Nicopoulos, and Yiannakis Sazeides. 2012. Optimizing Data-Center TCO with Scale-Out Processors. IEEE Micro 32, 5 (Sept. 2012), 52–63.
- Hardavellas (2009) Nikos Hardavellas. 2009. Chip Multiprocessors for Server Workloads.
- Hardavellas et al. (2011) Nikos Hardavellas, Michael Ferdman, Babak Falsafi, and Anastasia Ailamaki. 2011. Toward Dark Silicon in Servers. IEEE Micro 31, 4 (July-August 2011), 6–15.
- Kgil et al. (2006) Taeho Kgil, Shaun D’Souza, Ali Saidi, Nathan Binkert, Ronald Dreslinski, Steven Reinhardt, Krisztian Flautner, and Trevor Mudge. 2006. PicoServer: Using 3D Stacking Technology to Enable a Compact Energy Efficient Chip Multiprocessor. In Proceedings of the 12th International Conference on Architectural Support for Programming Languages and Operating Systems (ASPLOS). 117–128.
- Kumar and Hinton (2009) Rajesh Kumar and Glenn Hinton. 2009. A Family of 45nm IA Processors. In Proceedings of the IEEE International Solid-State Circuits Conference. 58–59.
- Li et al. (2009) Sheng Li, Jung Ho Ahn, Richard D. Strong, Jay B. Brockman, Dean M. Tullsen, and Norman P. Jouppi. 2009. McPAT: An Integrated Power, Area, and Timing Modeling Framework for Multicore and Manycore Architectures. In Proceedings of the 42nd Annual IEEE/ACM International Symposium on Microarchitecture (MICRO). 469–480.
- Lim et al. (2008) Kevin Lim, Parthasarathy Ranganathan, Jichuan Chang, Chandrakant Patel, Trevor Mudge, and Steven Reinhardt. 2008. Understanding and Designing New Server Architectures for Emerging Warehouse-Computing Environments. In Proceedings of the 35th Annual International Symposium on Computer Architecture (ISCA). 315–326.
- Lotfi-Kamran et al. (2012) Pejman Lotfi-Kamran, Boris Grot, Michael Ferdman, Stavros Volos, Onur Kocberber, Javier Picorel, Almutaz Adileh, Djordje Jevdjic, Sachin Idgunji, Emre Ozer, and Babak Falsafi. 2012. Scale-Out Processors. In Proceedings of the 39th Annual International Symposium on Computer Architecture (ISCA). 500–511.
- Muralimanohar et al. (2007) Naveen Muralimanohar, Rajeev Balasubramonian, and Norman P. Jouppi. 2007. Optimizing NUCA Organizations and Wiring Alternatives for Large Caches with CACTI 6.0. In Proceedings of the 40th Annual IEEE/ACM International Symposium on Microarchitecture (MICRO). 3–14.
- Reddi et al. (2010) Vijay Janapa Reddi, Benjamin C. Lee, Trishul Chilimbi, and Kushagra Vaid. 2010. Web Search Using Mobile Cores: Quantifying and Mitigating the Price of Efficiency. In Proceedings of the 37th Annual International Symposium on Computer Architecture (ISCA). 314–325.
- Rodrigues et al. (2013) R Rodrigues, A Annamalai, I Koren, and S Kundu. 2013. A study on the use of performance counters to estimate power in microprocessors. IEEE Transactions on Circuits and Systems II: Express Briefs 60 (12) (2013), 882–886.
- (27) H. B. Sohail, B. Vamanan, and T. N. Vijaykumar. MigrantStore: Leveraging Virtual Memory in DRAM-PCM Memory Architecture. Technical Report. ECE Technical Reports, TR-ECE-12-02, Purdue University.
- Turley (2010) Jim Turley. 2010. Cortex-A15 ”Eagle” Flies the Coop. Microprocessor Report 24, 11 (Nov. 2010), 1–11.
- Vasilakis and Katevenis (2015) Evangelos Vasilakis and Manolis G.H Katevenis. 2015. An Instruction Level Energy Characterization of ARM Processors. Technical Report. Computer Architecture and VLSI Systems (CARV) Laboratory, Institute of Computer Science (ICS), Foundation of Research and Technology Hellas (FORTH).
- Vogelsang (2010) T. Vogelsang. 2010. Understanding the Energy Consumption of Dynamic Random Access Memories. Proc. Int’l Symp. Microarchitecture, IEEE CS Press (2010), 363–374.
- Wenisch et al. (2006) Thomas F. Wenisch, Roland E. Wunderlich, Michael Ferdman, Anastassia Ailamaki, Babak Falsafi, and James C. Hoe. 2006. SimFlex: Statistical Sampling of Computer System Simulation. IEEE Micro 26, 4 (July-August 2006), 18–31.
- Wheeler (2011) Bob Wheeler. 2011. Tilera Sees Opening in Clouds. Microprocessor Report 25, 7 (July 2011), 13–16.
- Xi et al. (2015) Sam Xi, Hans Jacobson, Pradip Bose, Gu-Yeon Wei, and David Brooks. 2015. Quantifying Sources of Error in McPAT and Potential Impacts on Architectural Studies. In International Symposium on High Performance Computer Architecture (HPCA).