The STRong lensing Insights into the Dark Energy Survey (STRIDES) 2016 follow-up campaign. I. Overview and classification of candidates selected by two techniques.
Abstract
The primary goals of the STRong lensing Insights into the Dark Energy Survey (STRIDES) collaboration are to measure the dark energy equation of state parameter and the free streaming length of dark matter. To this aim, STRIDES is discovering strongly lensed quasars in the imaging data of the Dark Energy Survey and following them up to measure time delays, high resolution imaging, and spectroscopy sufficient to construct accurate lens models. In this paper, we first present forecasts for STRIDES. Then, we describe the STRIDES classification scheme, and give an overview of the Fall 2016 follow-up campaign. We continue by detailing the results of two selection methods, the Outlier Selection Technique and a morphological algorithm, and presenting lens models of a system which could possibly be a lensed quasar in an unusual configuration. We conclude with the summary statistics of the Fall 2016 campaign. Including searches presented in companion papers (Anguita et al.; Ostrovski et al.), STRIDES followed up 117 targets identifying 7 new strongly lensed systems, and 7 nearly identical quasars (NIQs), which could be confirmed as lenses by the detection of the lens galaxy. 76 candidates were rejected and 27 remain otherwise inconclusive, for a success rate in the range 6-35%. This rate is comparable to that of previous searches like SQLS even though the parent dataset of STRIDES is purely photometric and our selection of candidates cannot rely on spectroscopic information.
keywords:
gravitational lensing: strong – methods: statistical – astronomical data bases: catalogs1 Introduction
In the four decades since the discovery of the first strongly lensed quasars (Walsh et al., 1979; Weymann, 1980), they have morphed from an intellectual curiosity to a powerful and in some sense unique astrophysical tool (Courbin et al., 2002). Three classes of applications make strongly lensed quasars especially valuable. First, by modeling how the light of the background quasar and its host galaxy is distorted one can reconstruct the distribution of luminous and dark matter in the deflector, and thus address fundamental astrophysical problems like the normalization of the stellar initial mass function (Pooley et al., 2009; Schechter et al., 2014) and the abundance of dark matter subhalos (Mao & Schneider, 1998; Metcalf & Madau, 2001; Dalal & Kochanek, 2002; Nierenberg et al., 2014; Nierenberg et al., 2017; Birrer et al., 2017). Second, by exploiting magnification, one can study in great detail the distant quasars, the properties of their accretion disks and host galaxies (Peng et al., 2006; Ding et al., 2017). Third, by measuring time delays between the variable images and stellar kinematics of the deflector one can measure cosmic distances and thus cosmological parameters, especially the Hubble Constant (Refsdal, 1964; Schechter et al., 1997; Treu & Koopmans, 2002; Schneider & Sluse, 2013; Suyu et al., 2013; Treu & Marshall, 2016; Suyu et al., 2014; Birrer, Amara, & Refregier, 2016; Bonvin et al., 2017a; Tie & Kochanek, 2018; Shajib et al., 2018).
Unfortunately, most applications to date have been limited by the small number of known suitable systems. Lensed quasars, patricularly the ones with four images which provide the most information, are rare on the sky (of order 0.1 per square degree at present day typical survey depth and resolution; Oguri & Marshall, 2010). Therefore successful searches for lensed quasars require searches over large solid angles (e.g., Browne et al., 2003; Inada et al., 2012; More et al., 2016) and substantial follow-up to weed out false positives.
Furthermore, not every lensed quasar system is suitable for every application: depending on the specifics of the lensing configuration and on the brightness of deflector and source, some systems contain significantly more information than others. Thus, in practice, every application of strongly lensed quasars to date has been limited to samples of one or two dozens at best.
The present generation of wide field imaging surveys provides an opportunity to make transformative measurements by increasing dramatically the sample of known lens quasars. Hundreds of strongly lensed quasars are hiding in the thousands of square degrees currently being imaged by the Dark Energy Survey (and similarly, e.g., the Hyper-Suprime-Cam SSP Survey, the VST-ATLAS Survey), waiting to be discovered and followed up.
In order to exploit the bounty of data provided by DES, we have formed the STRIDES collaboration (STRong lensing Insights into Dark Energy Survey 111STRIDES is a Dark Energy Survey Broad External Collaboration; PI: Treu. http://strides.astro.ucla.edu). The immediate goal of STRIDES is to identify and follow-up large numbers of multiply imaged quasar motivated by two main science drivers: i) study dark energy using gravitational time delays; ii) study dark matter using flux ratio and astrometric anomalies. Additional science goals include the determination of the normalization of stellar mass-to-light ratios of massive early-type galaxies and the properties of accretion disks through the study of quasar microlensing (e.g., Motta et al., 2017).
As we will show in this paper, STRIDES can in principle discover enough strongly lensed quasars to make substantial headway on both its two main science drivers. Strongly lensed quasars’ main contribution to dark energy measurements is through the determination of absolute distances in the relatively low redshift universe, and thus of the Hubble Constant (Treu & Marshall, 2016). In turn, knowledge of is currently a limiting factor in the interpretation of cosmic microwave background data (Weinberg et al., 2013; Bonvin et al., 2017a). Current measurements of based on the local distance ladder method reach % precision (Riess et al., 2016; Riess et al., 2018a, b). The most recent time delay based measurements reach % with just 3 systems (Bonvin et al., 2017a). Reaching 1% equivalent precision on H0 is extremely important (Suyu et al., 2012; Weinberg et al., 2013; Treu & Marshall, 2016) and it will require lensed quasars (Jee et al., 2016; Shajib et al., 2018) with data and models of quality equivalent to those presented by Suyu et al. (2017); Rusu et al. (2017); Sluse et al. (2017); Wong et al. (2017); Bonvin et al. (2017a). Similarly, current limits on dark matter substructure are based on lenses (Dalal & Kochanek, 2002; Vegetti et al., 2014; Nierenberg et al., 2017). Quadrupling the sample of viable quads will be a major step forward in constraining the properties of dark matter (Gilman et al., 2018).
Finding lensed quasars in purely imaging datasets of the size of DES is an unprecedented task. It requires the development of new algorithms to identify candidates from the imaging data, and substantial investment of telescope time to follow-up and confirm the candidates. In order to maximize completeness and purity, the collaboration is pursuing multiple independent approaches to identify candidate lenses. The lack of -band imaging data in DES makes it particularly hard to identify QSOs, therefore many of the selection techniques combine DES imaging with WISE photometry. The candidates are then followed up with spectroscopy and higher resolution imaging. Both are necessary to confirm the lensing nature of the systems and obtain the redshift and astrometry necessary for modeling and scientific exploitation. First results from the STRIDES program have been presented by Agnello et al. (2015); Lin et al. (2017). Once the candidates are confirmed, the best ones are selected for monitoring either with the 1.2m Euler Telescope or with the MPIA 2.2m Telescope at La Silla as part of the COSMOGRAIL network (Courbin et al., 2018).
This paper has multiple aims. First, it provides an overview of the STRIDES program and forecasts the number of expected lensed quasars to be found in the complete Dark Energy Survey (DES; § 2). The forecasts show that the DES area depth and resolution should be sufficient to more than double the current sample of known lensed quasars, providing new systems especially in the South hemisphere outside the area covered by previously largest search based on the Sloan Digital Sky Survey (Inada et al., 2012). Second, this paper defines a candidate classification system, and various subclasses of inconclusive and contaminant sources (§ 3). The system will be applied throughout the collaboration with the goal to standardize the lens confirmation process and hopefully adopted by other investigators. Third, this paper gives an overview of the Fall 2016 Follow-up campaign (§ 4), listing the candidates selected by two techniques (§ 5 and § 6) that did not yield any confirmed lens, except for a possible unusual quadruply imaged quasar. Companion papers in this series present the follow-up of candidate lensed QSOs selected using other techniques (Anguita et al., 2018, and Ostrovski et al. 2018, in preparation), showing spectra and images for all confirmed lenses and otherwise promising inconclusive systems222During the follow-up campaign, non-DES targets selected from other surveys were also targeted. Those are described by papers outside of this series (e.g., Schechter et al., 2017; Williams et al., 2018; Ostrovski et al., 2018; Agnello et al., 2018a).. The fourth goal of this paper is to present the summary statistics of the 2016 follow-up campaign, combining the results from every search method, as discussed in § 7. Target selection for the 2016 campaign was based on early DES datasets, which did not cover the full depth and footprint of the survey. Thus, the Fall 2016 campaign statistics are not sufficient for a detailed comparison with the forecast for STRIDES. However, the follow-up statistics are sufficient for an assessment of the success rate and the completeness of the searches so far. Remarkably, the success rate is comparable to those of previous searches, even though no spectroscopic preselection or u-band imaging was available. A short summary concludes the paper in § 8.
All magnitudes are given in the AB system, and a standard concordance cosmology with , , and is assumed when necessary.
2 Forecasts for STRIDES
Our forecasts for STRIDES use the OM10 mock lensed quasar catalog of Oguri & Marshall (2010). The reader is referred to the original paper and associated software repository333https://github.com/drphilmarshall/OM10/ for full details of how this basic catalog was generated. Here we give only a concise summary for the convenience of the reader. The deflector population is assumed to consist of early-type galaxies, which represent 80-90% of the galaxy-scale lenses (Turner et al., 1984; Bolton et al., 2008a) and dominate the optical depth for image separations in the range considered here. We do not consider systems with smaller image separation since they would be unresolved in the DES images. Systems with image separation larger than would be dominated by group- and cluster-scale lenses, and thus are not appropriately captured by the OM10 framework.
The deflector population is described by the velocity dispersion function of early-type galaxies (Choi et al., 2007), which has been shown to reproduce well the abundance of strong lenses (Chae, 2007; Oguri et al., 2008). The deflector potential is described by a single isothermal ellipsoid (Kormann et al., 1994), which is the simplest model that gives a sufficiently accurate description of early-type galaxies (Treu, 2010), with external shear to account for the contribution of the environment along the line of sight (Keeton et al., 1997). Multiband fluxes based on the observed correlation between the velocity dispersion and luminosity of early-type galaxies (Hyde & Bernardi, 2009) are computed using the publicly available code LensPop,444https://github.com/tcollett/LensPop written by one of us (T.C. Collett, 2015).
The quasar source population is described by a redshift-dependent double power law luminosity function consistent with SDSS data (Fan et al., 2001; Richards et al., 2006, 2005).
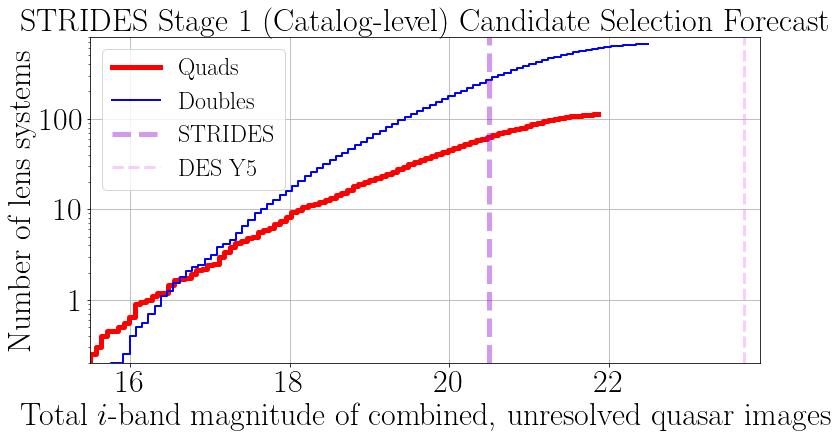
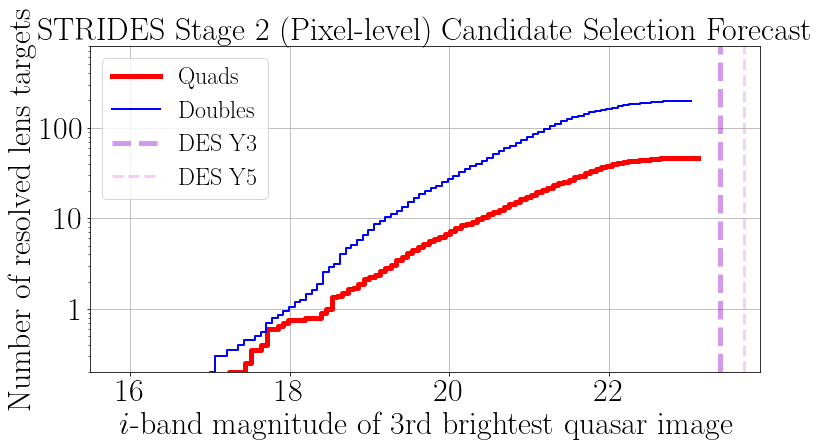
Figure 1 shows the expected number of multiply-imaged quasars as a function of total (unresolved) quasar -band magnitude, given the 5000 square degree footprint. By combining all the lensed quasar light to compute each mock lens’ total quasar brightness, we enable an approximate emulation of a catalog-level selection in which no lens system is resolved into component multiple images, as is certainly the case for the WISE photometry (primarily W1 and W2, with resolution ) that we use in our candidate selection. The number counts curves are truncated because the OM10 catalog was generated so as to contain lens systems whose 3rd brightest image would be detected at 10-sigma in a single LSST visit, with depth . This gives a mock sample bright enough for our purposes.
From Figure 1 we see that quad systems outnumber double systems at magnitudes brighter than . While our actual photometric joint DES+WISE catalog selection is complex, it leads to a “Stage 1” list of candidates that is significantly incomplete below a total quasar magnitude of . Above this limit, we expect the DES survey area to contain about 60 quads and 250 doubles.
However, many of these systems will have multiple image separations that are too small to be resolved, and counter-images that are too faint to see, and so we expect these to be ranked lowly in any imaging follow-up campaign. Requiring that the image separation be greater then to be resolved in the DES survey images, and that the 2nd (in doubles) or 3rd (in quads) brightest image to be detected above the DES Y3 detection limit of emulates a “Stage 2” image inspection selection, that leads to a reduced number of visibly multiply-imaged lensed quasars. We see from the lower panel of Figure 1 that we expect this Stage 2 sample to contain about 50 quads and 200 doubles, for a total of about 250 potentially detectable lens systems.
To put the STRIDES forecasts in context, this Stage 2 sample is larger than all the currently published lensed quasars, i.e. approximately 40 quads and 140 doubles, including cluster scale deflectors.555Compilation assembled by one of us (C.L.). The compilation by Ducourant et al. (2018), not yet publicly available, reports 243 confirmed systems, even though a direct comparison is difficult since the criteria for confirmation are unpulished and may be different from ours. Regardless of which compilation one chooses to compare, the STRIDES forecasted sample is larger than the number of currently known lensed quasars We can also compare the STRIDES forecasts to the outcome of the Sloan Digital Sky Survey (SDSS) searches and the expectations and results for the recently completed Kilo Degree Survey (KIDS; de Jong et al., 2013). The Sloan Digital Sky Survey Quasar Lens Search (SQLS; Inada et al., 2012) reported 26 lensed quasars as part of their statistical sample (6 were known prior to SQLS), plus an additional 36 found with a variety of techniques (14 were known prior to SQLS). Of the 26 quads in the statistical sample, 4 are galaxy-scale quads (including one previously known) and one is a cluster-scale 5 image lens. Of the non-statistical sample, 5 systems have 4 or more images (4 of which were previously known). The statistical sample is limited to a total quasar brightness of , and the non-statistical sample extends to . As described above, DES should be able to deliver a significantly larger number of lenses by virtue of the superior depth and resolution of its images, even though the area covered on the sky is smaller than that of SDSS. Furthermore, the overlap between SDSS and DES is minimal, so the two searches are complementary in terms of sky coverage and follow-up opportunities. Similarly to DES, KIDS targets the southern hemisphere, but its smaller solid angle coverage limits the yield in terms of lenses. An approximate forecast can be obtained by scaling the DES predictions by the ratio of the sky coverage. Thus, KIDS Data Release 3 and 4 should find approximately 10% and 20% of the lenses present in DES (Spiniello et al., 2018).
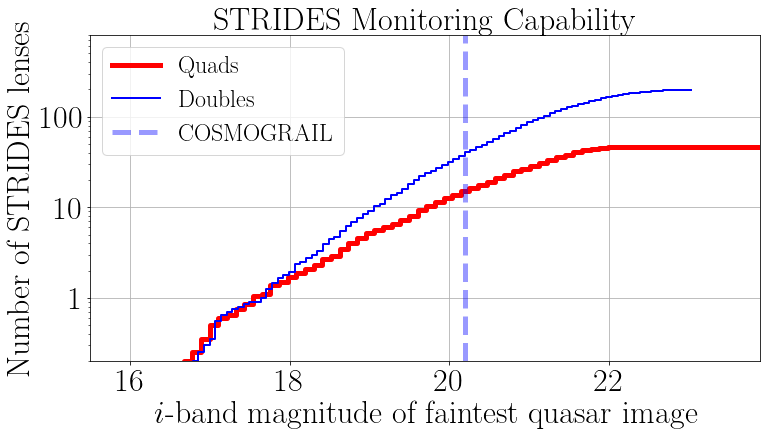
An important caveat for the use of the sample for time delay cosmography is that the brightness of the faintest image in the system is the limiting factor for monitoring. In Figure 2 we show the predicted number of lenses as a function of faintest image magnitude. From our COSMOGRAIL lens monitoring experience, we expect to be able to measure the time delay well for systems with faintest image brighter than and image separation larger than , with the current allocation of 1m/2m class telescopes (going fainter would require more time on 1m/2m telescopes or upgrading to a 4m telescope; Treu et al., 2013). This practical limit leads to a prediction of there being about 15 quads and 45 doubles bright enough to monitor well in the DES area, with current monitoring capabilities. Exploiting the statistical power of the larger STRIDES sample of 50 quads and 200 doubles will require monitoring on 4m class telescopes, or much larger time allocations on the 1-2m class telescopes that are currently used. For example, COSMOGRAIL is currently using 20% of the time on a 2.2m telescope (Courbin et al., 2018).
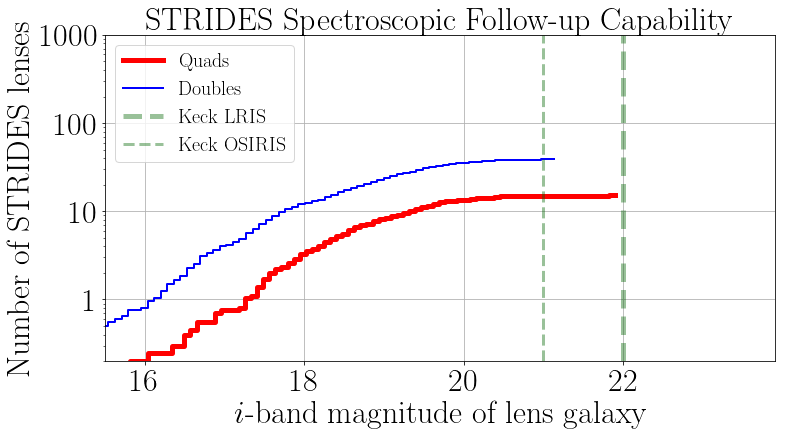
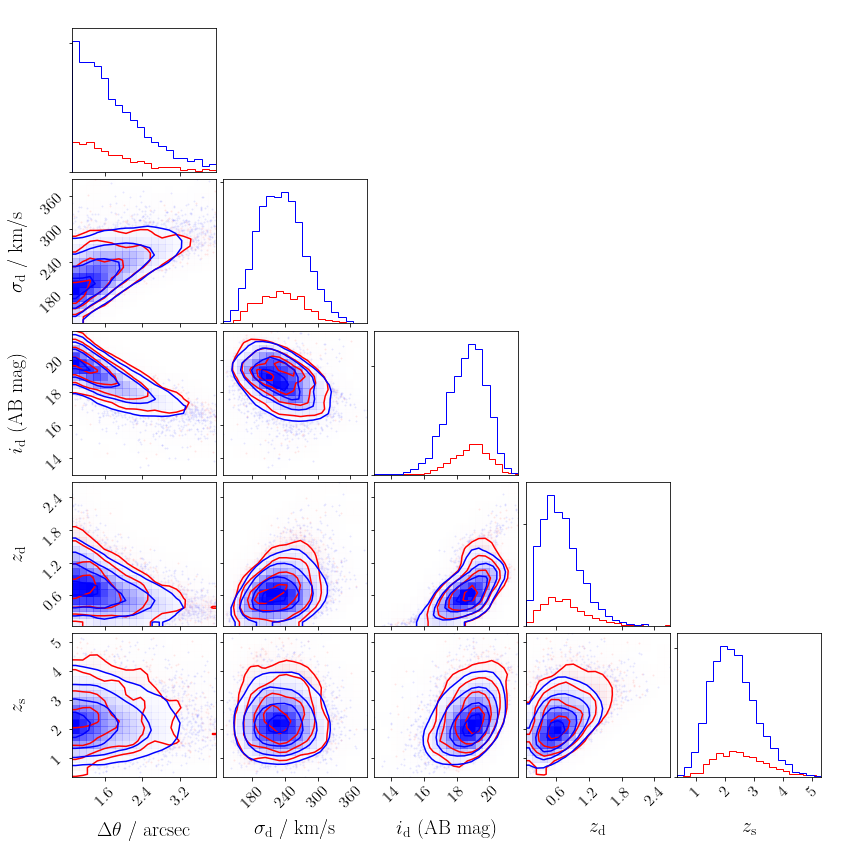
The deflector magnitude is also an important consideration for constructing a cosmographic time delay lens sample, since it is a limiting factor in the determination of stellar kinematics used to break the mass-sheet degeneracy. The forecast as function of deflector magnitude is shown in Figure 3. We compute lens galaxy magnitudes using the stellar population synthesis code provided with the LensPop package (Collett, 2015). For a given velocity dispersion, we compute the absolute rest-frame -band magnitude using the relation of Hyde & Bernardi (2009). This is then converted to observed apparent magnitudes using the redshift of the lens, a flat CDM cosmology with and , and assuming a 9 Gyr old population with solar metallicity. We use the LRIS and OSIRIS spectrographs at the Keck Observatory for the stellar kinematics measurements: we see that with these facilities we should expect all of our STRIDES systems to have easily measured lens galaxy stellar kinematics to 6-7% precision, which is the current state of the art in this field (Wong et al., 2017).
Other interesting properties of the expected sample are shown in Figure 4. We expect the deflector redshift distribution to peak at around , while the sources peak at redshifts between . As expected, the distribution of velocity dispersion of the deflector peaks around 250 kms-1, due to the exponential cutoff of the velocity dispersion function for large and the dependency of lensing cross section.
3 STRIDES classification scheme and criteria
In this section we define the STRIDES classification scheme for confirmed lenses, inconclusive systems, and contaminants. Although some degree of subjectivity is inherent in this classification, we will strive to keep a consistent classification scheme throughout the STRIDES follow-up campaigns in 2016 and future years. In general, we find that both high resolution imaging and spectroscopy are necessary to classify a system as a definite lens, except in the following cases: imaging is sufficient if arcs are detected or if the configuration is consistent with a classic quad configuration (cross, fold, cusp). Spectroscopy is sufficient if the quasar spectra are partially resolved and a deflector galaxy is detected in between.
3.1 Secure, probable, and possible lenses
We adopt a different classification scheme for doubles and quads, as detailed below.
3.1.1 Confirmed lenses
For doubles, we require for confirmation one of the following scenarios: 1) nearly identical spectra of the two quasar images (i.e. differences consistent with microlensing and differential dust extinction), as well as the detection of the lens galaxy in imaging or spectroscopy; 2) the detection of gravitationally lensed arcs consistent with extended images of the quasar host galaxy; 3) coherent and delayed variability (although in general the DES data do not sample enough epochs to classify according to this criterion).
For quads, given the intrinsic rarity of the configuration (and possible contaminants) and the difficulty of detecting the deflector galaxy and separating the lensed quasar images in spectroscopy, we only require spectroscopic confirmation of at least one of the quasar images, the detection of flux consistent with a lens galaxy, plus a configuration consistent with strong lensing. The latter could consist, e.g. of three point sources, plus an extended source interpreted as the fourth image blended with the deflector, or other similar configurations.
3.1.2 Probable and possible quads
We use these categories for candidate quads that do not fullfill all criteria for confirmation. Again, this classification is inherently subjective, involving some personal judgement of what is a satisfactory lens model and lens galaxy detection. It is similar in spirit to the classification (secure, probable, possible) adopted by the SLACS Team (Bolton et al., 2008; Auger et al., 2009). In an attempt to quantify the degree of certainty we consider secure systems that have 99% probability of being lenses, probable at 95%, and possible at 68%, whenever such quantification is possible.
3.2 Inconclusive systems
Inconclusive systems include candidate doubles that have a significant likelihood of being lenses based on the available good quality data, and those for which the data are just insufficient to make any statement.
3.2.1 Nearly Identical Pairs of Quasars (NIQs)
We call nearly identical quasars (NIQ), every pair of spectroscopically confirmed quasars, for which spectral differences can be explained via microlensing or differential extinction, but there is no detection of a deflector galaxy. The non-detection can be due to insufficiently deep high resolution imaging data or spectroscopy, or could be due to the system being composed of an actual physical pair as opposed to two lensed images. We single out this class of systems as primary targets for additional follow-up. Conversely, if the data are deep enough to rule out the presence of a lens galaxy, estimated in the following manner, the system is classified as not a lens. First, we take half the image separation as best estimate of the Einstein Radius. Second, as a function of source and deflector redshift, the Einstein Radius is transformed into stellar velocity dispersion , adopting a singular isothermal sphere model with normalization equal to (e.g., Treu et al., 2006). We limit the range of acceptable redshifts to those that yield kms-1. Third, we assign an apparent magnitude to each set of deflector redshift using the empirical relation for early type-galaxies given by Mason et al. (2015). Fourth, we adopt the maximum of the possible magnitudes as faintest possible flux from the source. This magnitude is typically fainter than what we can reach in our standard ground based follow-up and usually requires deep/high resolution data from HST or adaptive optics, since the lens galaxy could be hiding under the bright quasar in ground based seeing limited images.
3.2.2 Otherwise Inconclusive Doubles
This class contains all other cases of candidate doubles where the quality of the data is insufficient to confirm or rule out the lensing hypothesis. This may include systems that look like doubles but there is spectroscopic confirmation of just one putative image (or blended), or systems that are consistent with doubles in higher resolution imaging (from space or adaptive optics), but do not show arcs or have sufficiently good spectroscopy to confirm them as lenses.
3.3 Contaminants
Whenever possible we classify false positive doubly imaged quasars in one of the following, mostly self-explanatory, classes: 1) Quasar-Star Pair; 2) Quasar Pair; 3) Quasar-Galaxy Pair, either based on spectroscopic classification or based on one of the two candidate images being resolved at resolution higher than that of the discovery images and inconsistent with lensed arcs; 4) Galaxy Pair or Merging/Irregular Galaxy, either based on spectroscopic classification or based on the two candidate images being resolved at resolution higher than that of the discovery image and inconsistent with lensed arcs; 5) Other.
4 Overview of the Fall 2016 Follow-up campaign
Based on the definitions introduced in the previous section, for definite confirmation we require the spectra of the multiple imaged quasars to be almost identical, although not exactly the same in order to allow for differences due to variability, microlensing, and line of sight effects. In addition, we require the detection of a main deflector galaxy, either photometrically or through foreground spectroscopic features. Alternatively, high resolution imaging alone is sufficient if the system is a classic quad or arcs are detected.
Motivated by the goal to identify/reject as many candidates as possible we applied for telescope time for both adaptive optics imaging and spectroscopy. We applied to 3m-10m class telescopes chosen based on instrument configuration and time availability during semester 2016B, such that the entire DES footprint was available. Our proposals were successful even though we had limited control over when the runs were scheduled. The criteria of the target choice and scheduling for each run are given below.
The telescopes and instruments used during the campaign and the dates of each run are summarized in Table 1. The 3.6m New Technology Telescope at La Silla was used primarily for spectroscopy. EFOSC2 was used with the #13 grism and wide slit. The detector was binned two by two, resulting in a dispersion of 5.44Å/pixel, a pixel scale of along the slit, and wavelegth coverage from 3685 to 9315Å. Typically one or two exposures of 600s were taken for each object. The 4.1m Southern Astrophysical Research Telescope at Cerro Pachon was used primarily for high resolution imaging with its Adaptive Optics (AO) system SAM. Imaging was taken with the CCD SAMI through the -band to maximize AO correction and optmize the contrast between quasar and deflector galaxy. The pixel scale was 0045/pixel (with a 22 binning yielding 009/pixel) and the typical exposure time was 3x180 seconds. When the weather was not conducive to AO imaging, SOAR was used with the Goodman Spectrograph to take spectra. For the Goodman setup we used the 400 lines/mm grating with the blocking filter GG455, with a binning of 22 and a slit width of 1 arcsec. Between 2 and 3 exposures of 1200 seconds were taken per target.
The 10m Keck-2 Telescope was used to follow-up the candidates visible from Maunakea, both for spectroscopy with the Echellette Spectrograph and Imager (ESI) and for imaging with the Near InfraRed Camera 2 behind the adaptive optics system. ESI was used in the default Echellette mode with the arcsecond slit, while NIRC2 was used in the narrow field configuration (10mas pixel) in the K-band in order to maximize AO correction. One adaptive optics run was scheduled on the 3m Shane Telescope aimed for the brighter candidates but was lost to weather.
Outside of the main campaign, a few images and spectra were obtained with the 6.5 Magellan Telescopes. Those will be discussed in the appropriate context in papers II and III. -band images of candidate DESJ2346-5203 were obtained with GMOS on the 8.1m Gemini South telescope as a part of fast turnound program GS-2016B-FT-17. The GMOS images are discussed in Section 5.1.
The number of DES targets (selected from SV, Y1, Y3 Dark Energy Survey Collaboration et al., 2016; Drlica-Wagner et al., 2018; Abbott et al., 2018) observed in each run is given in Table 1. Non DES targets were also observed and those are described elsewhere (e.g., Schechter et al., 2017; Williams et al., 2018; Ostrovski et al., 2018; Agnello et al., 2018b). Since both imaging and spectroscopy are generally required for confirmation, and our runs were tightly scheduled during the Fall 2016 DES visibility season, we adopted a running prioritization scheme. Observations of hitherto unobserved candidates were random, subject to airmass constraints. Once a candidate was observed, either in imaging or in spectroscopy, a quick assessment was made, generally the night of the observations or the next day. If the candidate could be ruled out based on the available data it was dropped from the target list. If it was confirmed, or considered promising (e.g. NIQ in spectroscopy or two point sources with an extended source in the middle in imaging), its priority was raised for the subsequent complementary runs. The coordinates and follow-up outcome of targets observed during the Fall 2016 are given in Tables 2 and 3 for two of the selection techniques and in companion papers II and III for the other techniques.
| Dates | Telescope | Instrument | PI | DES Targets Observed | Notes |
|---|---|---|---|---|---|
| Sep 20-21 | Keck-2 | NIRC2 | Treu | 0 | Technical issues and weather losses |
| Sep 25-28 | NTT | EFOSC2 | Anguita | 37 | |
| Oct 29-31 | Shane 3m | ShARCS | Rusu | Lost to weather | |
| Nov 19-20 | Keck-2 | ESI | Fassnacht | 8 | |
| Dec 3-6 | NTT | EFOSC2 | Anguita | 40 | |
| Dec 3-8 | SOAR | SAMI | Motta/Treu | 60 | Poor weather on Dec 8 |
| Dec 16 | Keck-2 | NIRC2 | Treu | Lost to weather |
5 Follow-up of targets selected with the Outlier Selection Technique
Twenty-six targets selected with the outlier selection technique (OST) introduced by Agnello (2017) were observed during the fall 2016 campaign. The candidates are listed in Table 2 together with a summary of the follow-up data and outcome.
15 candidates were identified as contaminants, 10 could not be securely classified based on the available data and are thus considered inconclusive. For one system, the spectroscopy and morphology are possibly consistent with it being a quadruply imaged quasar in an usual configuration, although confirmation will require Hubble Space Telescope or Adaptive Optics imaging, given the small image separation of the system. The system is described in detail in the next section (5.1) along with a potential lens model. The success rate of this sample ranges between 0 and 42%, depending on how many of the inconclusive candidates are actual lens systems, including the possible quad.
Two classes of contaminants stand out: i) low redshift star forming galaxies (7/26, i.e. 27%); QSO+star pair (at least 6/26, i.e. 23%). Both classes of objects are expected to be potential contaminants in photometrically selected samples (Agnello et al., 2015; Williams et al., 2017) and improved algorithms are required to reduce this source of contamination. QSO+star pairs were also common contaminants in SQLS. Low redshift star forming galaxies were less common in SQLS probably by virtue of the spectrosopic preselection and the availability of -band photometry in SDSS.
Overall, this method did not produce any confirmed lens during the Fall 2016 campaign, even though it has been applied with success to other datasets (Agnello et al., 2018b; Agnello et al., 2018c). Given the small numbers of targets involved, the low yield in this campaign could simply be a statistical fluctuation. In any case, there is certainly scope for improving the rejection of contaminants noted above.
| ID | Mag | SpecObs | ImaObs | Notes |
| DESJ234628.18-520331.6 | 20.00 | NTT 9/21, 9/25 | GEMINI 12/6 | Poss. a quad; , |
| 12/4, 12/5 | SOAR 12/6 | |||
| DESJ024326.34-151729.8 | 20.01 | NTT 12/4 | Inconc. Two faint traces, no strong emission lines | |
| DESJ030539.52-243459.8 | 19.27 | SOAR 12/7 | Inconc. Two point sources with no AO and seeing | |
| DESJ042316.01-375855.4 | 19.89 | NTT 12/3 | SOAR 12/4 | Inconc. Broad emission line at 4967ÅQSO, spectrally unresolved; |
| SOAR one point source + something extended | ||||
| DESJ042407.95-593806.2 | 19.46 | SOAR 12/4 | Inconc. Point source + something extended | |
| DESJ054454.27-471138.1 | 20.61 | SOAR 12/6 | Inconc. SOAR two objects or elongated. bad seeing 09 | |
| DESJ061553.23-600552.9 | 18.96 | NTT 9/27 | Inconc. QSO z =1.66 unresolved | |
| DESJ061838.92-495007.7 | 19.78 | SOAR 12/6 | Inconc. Point source + something extended | |
| DESJ065959.89-563521.0 | 19.33 | SOAR 12/3 | Inconc. Point sources or galaxies? | |
| DESJ224752.94-431515.4 | 20.33 | NTT 12/5 | SOAR 12/3 | Inconc. Two point objects; QSO at z=0.74 + something faint |
| DESJ220006.63-634447.8 | 19.03 | NTT 9/27 | Inconc. QSO + faint unidentified trace | |
| DESJ004714.95-204838.5 | 19.21 | NTT 9/25 | Contam. star forming galaxy | |
| DESJ005426.19-240434.0 | 19.55 | NTT 12/5 | SOAR 12/3 | Contam. Two point sources + galaxy? Emission line galaxy |
| + faint no emission | ||||
| DESJ011753.38-044308.0 | 18.60 | NTT 9/26 | Contam. Star forming | |
| DESJ021722.30-551042.2 | 17.29 | NTT 9/26 | Contam. QSO + star (based on Mg5175 and NaD) | |
| DESJ034150.96-572205.8 | 19.70 | NTT 9/26 | Contam. QSO + featureless spectrum (likely a star) | |
| DESJ043949.66-564319.8 | 19.85 | NTT 12/4 | Contam. Emission line galaxy at | |
| DESJ045152.71-534504.9 | 18.43 | NTT 9/26 | Contam. QSO + Star | |
| DESJ051207.72-222213.3 | 19.04 | NTT 12/3 | SOAR 12/3 | Contam. Narrow line AGN at +featureless trace |
| DESJ200531.34-534939.3 | 19.21 | NTT 9/25 9/26 | Contam: Two traces, one QSO at | |
| + featureless (likely a star) | ||||
| DESJ204725.72-612846.7 | 20.15 | NTT 9/27 | Contam: QSO z=0.93 (single line at 5379Å) plus star | |
| DESJ214123.97-592705.8 | 19.60 | NTT 9/25 | Contam. Two traces: emission galaxy and absorption line | |
| companion at | ||||
| DESJ220501.19+003122.9 | 19.62 | NTT 9/26 | Contam. QSO +faint but different trace | |
| DESJ230317.10-454136.8 | 17.82 | NTT 9/27 | Contam. Star forming galaxy at | |
| DESJ233411.19-642139.9 | 20.80 | NTT 12/5 | SOAR 12/4 | Contam. SOAR two point sources; Faint unresolved |
| [OII] [OIII] emission at | ||||
| DESJ233520.73-464618.9 | 18.24 | NTT 9/27 | Contam. QSO + Star |
5.1 A candidate quad. Lens models and discussion of the case of DESJ2346-5203
The NTT spectra of DESJ2346-5203 (Figure 5) are consistent with a small separation (subarcsecond separation) lens. The candidate deflector is an emission line galaxy at , while the source is a QSO at . The distance between the two traces is approximately 2-3 pixels (i.e. ) along the slit (position angle 20 East of North). Unfortunately, the resolution of the DES imaging data was not sufficient to confirm it as a lens. Therefore, we obtained high resolution imaging data (3x263s exposures) using the Gemini South Telescope in excellent seeing, through a fast turnaround program.


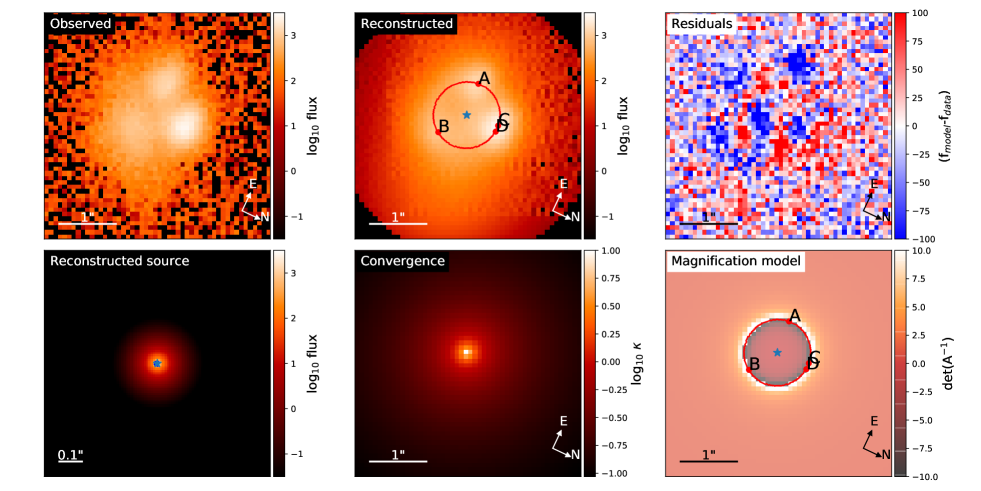
In order to investigate whether the system is quadruply imaged or not, we fit a lens model to the GEMINI GMOS-S data. We use a singular isothermal ellipsoid with additional external shear as the deflector mass model, elliptical Sersic profiles for the extended source galaxy and the lens galaxy and point sources with fixed relative magnifications based on the lens model for the quasar images. The PSF is estimated from a bright star in the image. We note that the PSF of the exposure is highly elliptical. The modeling is performed with the lens model software lenstronomy (based on Birrer et al., 2015; Birrer & Amara, 2018, available at https://github.com/sibirrer/lenstronomy).
The lens model reproduces the image configuration reasonably well. Figure 6 shows a possible lens model of the candidate DESJ2346-5203. Interestingly, the reconstruction requires extra flux at the position of the deflector, consistent with the detection of the deflector. The lens model is almost spherical to match the rather unusual image configuration of two very nearby bright images (C & D) with a circularized Einstein radius of approximately . The small image separation and the emission line suggest that if the system is a lens, the deflector is a late-type galaxy, and thus not one of the more common early-type deflectors considered in our forecasts.
The model is also consistent with a non-zero extended source that forms an Einstein ring configuration, although much fainter in brightness than the point sources. There are residuals left between the reconstructed model and the image. Some of them can be attributed to a potentially anomalous flux ratio between the point sources due to micro-lensing of stars. We also attempted to model the system as a doubly-imaged quasar (images A and C+D being a single image) + quadruply image host galaxy, similar to the case of SDSSJ1206+4332 (Agnello et al., 2016). No good fit could be found for relatively simple mass models like elliptical power laws.
Additional information can be gathered by deconvolving the Gemini images using techniques developed by one of us (F. C.). The deconvolved image shows that image A is consistent with being point like while images CD are well described by a single point source, in the sense that if they are two merging images they must be unresolved at the resolution of this image. Image B is not well described by a point source. Subtracting the point sources in the deconvolved images does not show a significant excess consistent with a putative lens galaxy, although of course it could be present below the noise level.
Based on the spectroscopy, the lens model, and the deconvolved images, we conclude that DESJ2346-5203 is unlikely to be a strong lens system in a simple traditional configuration (e.g. four images of a quasar with a galaxy in between). The lens model leaves substantial residuals and is somewhat contrived with images C and D being practically on top of each other. However, we note that unusual morphologies (Orban de Xivry & Marshall, 2009), or cases with extreme flux ratio anomalies like the one presented by Lin et al. (2017) are difficult to rule out (or identify!) without higher resolution imaging or spatially resolved spectroscopy.
| ID | Mag | SpecObs | ImaObs | Notes |
| DESJ052553.73-555937.1 | 20.16 | SOAR 12/5 | SOAR 12/7 | Inconc. SOAR Two point sources. Single narrow emission line at 6894Å |
| but spectrum nesolved into 2 components | ||||
| DESJ003848.42-480147.7 | 20.54 | NTT 12/5 | SOAR 12/4 | Contam. SOAR: two point sources. Two stars |
| DESJ013037.61-535419.0 | 21.05 | NTT 12/3 | SOAR 12/3 | Contam. SOAR: two point sources. Two stars |
| DESJ025629.40-413712.6 | 20.59 | NTT 12/3 | Contam. Emission line galaxy | |
| DESJ031908.53-410629.4 | 20.30 | NTT 12/5 | SOAR 12/3 | Contam. SOAR: two point sources. Two stars |
| DESJ032730.55-402712.0 | 20.17 | NTT 12/5 | SOAR 12/7 | Contam. SOAR: two point sources. Single MgII emission line, probably a |
| quasar pair, and | ||||
| DESJ040352.63-450052.3 | 19.98 | NTT 12/5 | SOAR 12/3 | Contam. SOAR: two point sources. QSO z=2.28 +star |
| DESJ040934.96-521619.8 | 19.11 | NTT 12/5 | SOAR 12/4 | Contam. SOAR: two point sources. Two stars |
| DESJ044538.42-582847.0 | 19.82 | NTT 12/5 | SOAR 12/5 | Contam. SOAR: two point sources. Two stars |
| DESJ045613.66-582519.6 | 20.10 | NTT 12/4 | Contam. galaxies | |
| DESJ050713.60-584440.0 | 20.53 | NTT 12/4 | SOAR 12/4 | Contam. SOAR: two point sources, Two stars |
| DESJ051340.97-425352.5 | 19.35 | NTT 12/4 | SOAR 12/3 | Contam. SOAR: two point sources. QSO + star |
| DESJ051813.72-434216.3 | 19.06 | NTT 12/4 | SOAR 12/4 | Contam. SOAR: two point sources. QSO +star |
| DESJ053232.64-445432.7 | 19.04 | NTT 12/3 | Contam. Emission line galaxy + faint object | |
| DESJ053239.19-584823.0 | 20.37 | NTT 12/3 | Contam. Two stars | |
| DESJ061727.03-482426.9 | 18.91 | NTT 12/5 | SOAR 12/3 | Contam. Two stars |
6 Follow-up of targets selected with the Morphological Algorithm
We also followed up a set of candidates identified via a morphological algorithm that was originally developed by two high-school students (Sivakumar & Sivakumar, 2015) to search for quasars in the Sloan Digital Sky Survey. This algorithm uses a set of morphological cuts followed by the application of image segmentation algorithms to find lensed quasar candidates. An initial set of objects were selected by applying the following criteria to all objects from the DES Y1A1_COADD (Morganson et al., 2018, Y1 means year one).
-
•
Dec to avoid the Magellanic Clouds.
-
•
In order to eliminate extended sources we require that the Petrosian radius be less than 5 pixels, i.e. .
-
•
To select objects with quasar-like colors we then apply color cuts , , , similar666The cut is slightly different than the original one due to a small computing error. to those implemented by Richards et al. (2001) and converted to DES colors using the equations in Appendix A.4 of Drlica-Wagner et al. (2018). All magnitudes are as calculated by SExtractor (Bertin & Arnouts, 1996; Bertin et al., 2002).
-
•
We require and . The upper cut eliminates saturated objects and the lower one removes faint galaxies that can be misclassified as stars.
-
•
The object detection in DES (Bertin & Arnouts, 1996; Bertin et al., 2002) does not de-blend the individual components of small image separation lensed quasars into separate objects. These blended objects appear as extended sources and can be identified by requiring that the magnitude measured assuming a stellar profile, , be different from , namely .
-
•
Finally we require that the objects have or . This selects objects that have neighbors or neighbors and blended. This eliminates the many objects that are isolated. Additionally we require and to eliminate objects that contain any saturated pixels.
These cuts select 112,820 candidates. We then obtain postage stamp images of each candidate and run image segmentation algorithms on them to identify individual components in the images. Two algorithms were used for this step, the marker-controlled watershed (Beucher, 1992) and the random walker (Grady, 2006), with implementations modified from those in the Python scikit-image package (van der Walt et al., 2014). The marker-controlled watershed algorithm operates on binary images so the color postage stamps were first converted to black and white using adaptive thresholding. A distance function was defined to identify seeds in the image that correspond to the images to be extracted. These seeds provide the locations from which the algorithm floods the image to find distinct boundaries, and this method avoids over-segmentation of the image. This algorithm is efficient at finding the seed locations but does not provide the most accurate segmentation. So for images that were successfully segmented by the watershed method we then applied the random walker algorithm to them. The random walker requires color images and starts with a seed and then expands outwards to look for neighbors to segment the image. The seeds from the watershed algorithm are used as the starting points for the random walker. The final segmented images and their properties are obtained from the random walker algorithm as it provides accurate segmentation with clear boundaries. After the image segmentation step we are left with 70,823 candidates. These candidates were visually inspected and reduced to 156.
We then applied a second set of color cuts that incorporate the W1 and W2 bands from WISE (Eq. 1; using a matching radius of ), based on Figure 3 of Ostrovski et al. (2017), to further narrow down the sample. The WISE magnitudes are in the Vega system. The conversions for the WISE data are and which are given by Jarrett et al. (2011). Candidates for which the value of is an upper limit were also removed as their colors are not reliable.
| (1) | |||
These final cuts yielded 35 candidates which were all then visually inspected to select the final sample of 18 candidates for spectroscopic follow-up. We were able to observe 16 of the 18 candidates and these are listed in Table 3 together with a summary of the follow-up data and outcome. In short, one of the candidates remains inconclusive, and will require higher resolution spectroscopy or deeper imaging to finalize its classification. Fifteen objects are found to be contaminants, including 8 star pairs, 3 QSO+star pairs, 1 probable QSO pair, and 3 galaxies. Based on the performance so far it is clear that this method requires further improvements, especially in the rejection of stellar contaminants, in order to be competitive with other methods in terms of purity.
7 Summary Statistics of the 2016 STRIDES Follow-up Campaign
In addition to the Outlier Selection Technique introduced by Agnello (2017), and the morphological technique described in Section 6, other techniques were developed by members of the STRIDES collaboration. Their selection techniques and results of follow-up are described in other papers of this series (Anguita et al., 2018, and Ostrovski et al. 2018, in preparation). Overall, taking into account all selection methods, 117 DES-selected candidates were observed. 7 were confirmed as lensed quasars, including 2 quads, 7 were classified as NIQs. For 27 the observations were inconclusive, and the rest were rejected as contaminants.
The scale of the follow-up is sufficient to get a first assessment of the success rate of our candidate selection techniques, and compare it with previous searches. The overall success rate across all techniques is in the range 6-35%. This is a good success rate considering that the selection is purely photometric and no spectroscopic pre-selection is applied. For comparison, the most recently completed large scale search for lensed quasars is the Sloan Digital Sky Survey Quasar Lens Search (SQLS; Inada et al., 2012). Starting from a sample of 50,836 spectroscopically confirmed quasars, they identified 520 candidates based on color and morphology. Thirty (including 26 in the so-called “statistical sample”) of those were confirmed as lensed quasars. One important class of contaminants were 81/520 QSO pairs, i.e. approximately 16%. Another important class of contaminants were QSO+star (at least 100), to which one should probably add most of the objects classified as “no lens” based on imaging data (158; spectroscopic classification is not available for this class; these are most likely to be QSO+star, Oguri 2017, private communication), A few objects could not be confirmed as lenses due to small separation (9), although some of them could very well be lenses. Thus, the overall success rate is at least 6% but possibly a little higher. QSO+star class comprises at least 19% of the spurious candidates, and perhaps as high as 50%. We refer to the individual papers of this series for a breakdown in the various class of contaminants for the STRIDES searches.
A more recent search is that carried out by the SDSS-III BOSS quasar lens survey (BQLS; More et al., 2016). Similarly to SQLS, they start from spectroscopically confirmed quasars and look for evidence for lensing. In their initial study, they confirmed as lenses 13 of their 55 best candidates, i.e. a success rate of 20%. Of the top 55 candidates 11 are confirmed quasar pairs, some of which might be unrecognized lenses.
In addition, we can compare the number of forecasted lenses with the number of confirmed lenses to roughly estimate the completeness of our search so far, keeping in mind that the searches were conducted on partial and different DES data releases. The two search algorithms presented in this paper were applied to the Y1A1 DES data release, which covers approximately 1800 square degrees, i.e. 36% of the DES footprint, shallower than full depth. The algorithm presented in paper II (Anguita et al., 2018) was applied to the Y1+Y2 footprint, corresponding to approximately the entire DES footprint, shallower than full depth. The algorithm presented in paper III (Ostrovski et al. 2018) was applied to the part of the Y3 data release that overlaps with the VISTA-VHS survey (approximately half the entire DES footprint, shallower than full depth).
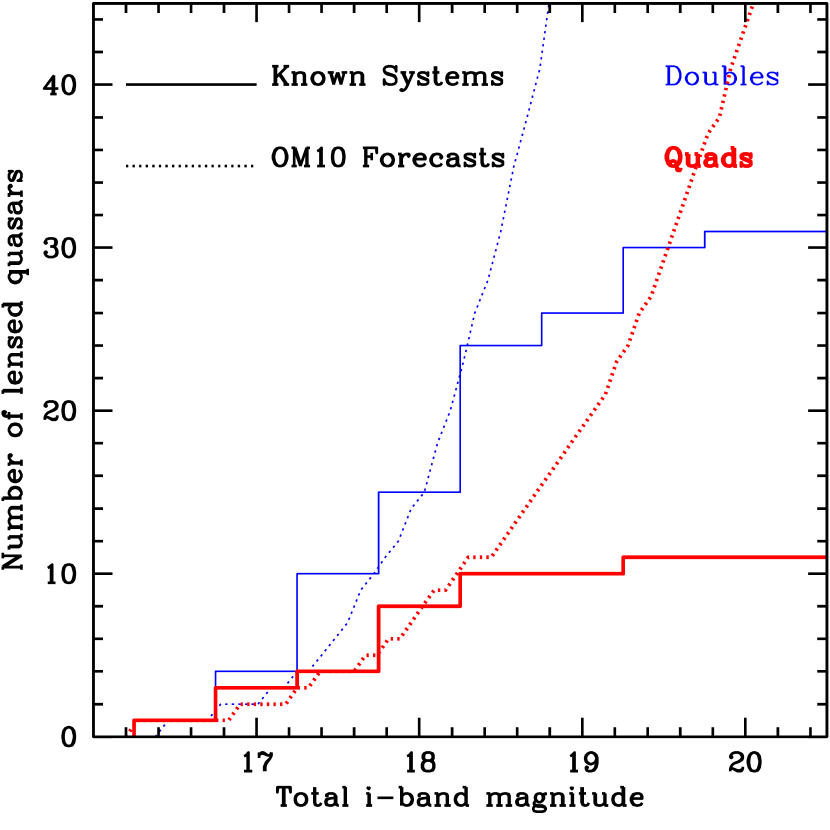
Considering only the brighter systems ( or brighter) that should have been detectable at reduced depth, we expected (§ 2 roughly 60 lensed quasars, including 15 quads. We confirmed 7 lenses, including 2 quads (possibly 8/3 if one wishes to include DESJ2346-5203). It is unlikely that more quads are hiding amongst the 33 inconclusive systems (including NIQs), as those generally tend to be easily to confirm due to their peculiar morphology. Thus, we conclude that a large fraction of quads (and possibly doubles) brighter than remains to be found in the DES footprint, motivating additional searches in subsquent DES data releases and follow-up campaigns. This conclusion is consistent with the discovery of doubles and quads in the DES footprint, before (Agnello et al., 2015; Ostrovski et al., 2017; Lin et al., 2017) and after (Agnello et al., 2018a) the conclusion of the Fall 2016 campaign. At the moment of this writing, considering all known lensed quasars within the DES footprint including those discovered before and after the STRIDES Fall 2016 campaign, there is a good agreement between the forecasts and the observations for (see Figure 7). Beyond this limit the number of known lensed quasars increases much more slowly than forecasted, suggesting that many lenses remain to be found.
The public data releases (Gaia Collaboration et al., 2018) of the Gaia Satellite (Gaia Collaboration et al., 2016) have provided another powerful tool in the arsenal of the lens quasar finding community. Gaia’s high resolution positions and proper motions have been shown to be extremely powerful by themselves (Krone-Martins et al., 2018) and especially in combination with optical and mid-IR images for identifying lensed quasars and reject contaminants (Agnello et al., 2018a; Lemon et al., 2018; Agnello & Spiniello, 2018). The fast turnaround of these discoveries after the data releases is very encouraging for STRIDES both in terms of the prospects of completeness and success rate of targeted follow-up.
Finally, we can make a further comparison between the forecast and the properties of entire sample, by looking at the quasar redshift distribution. Given the small number statistics we combine both confirmed lenses and NIQs, assuming that they are drawn from the same distribution, even though this of course will need to be revisited at the end of the STRIDES multi-year effort. The distribution is shown in Figure 8. As forecasted, the distribution peaks at , and drops off below 1 and above 3. Whereas the numbers are still too small for a quantitative comparison between forecast and detections, the qualitative agreement is encouraging, especially because contrary to the SDSS searches we did not rely on u-band imaging or spectroscopic information for selection of candidates.

8 Summary
We have presented an overview of the STRIDES program, an external collaboration of the Dark Energy Survey aimed at finding and studying strongly lensed quasars, and outlined some of the results of the first comprehensive follow-up campaign. The main results of this paper can be summarized as follows:
-
•
Our detailed forecasts indicate that about 50 quads and 200 doubles should be detectable in DES data. Of those, approximately 60 should be bright enough for time delay measurements with 1-2m class telescopes, while the rest will require a 4m class telescope for monitoring. All the systems will be bright enough to measure stellar velocity dispersion with 8-10m class telescopes.
-
•
The STRIDES lens classification scheme is presented. In addition to confirmed lenses, and inconclusive systems, we adopt the class of Nearly Identical Quasars (NIQ) to identify inconclusive targets which are particularly promising for additional follow-up.
-
•
We detail the results of the follow-up of 42 targets selected by two of the search techniques (Outlier Selection and Morphological; OST and MT respectively). One of those is a candidate quadruply imaged quasar (DESJ2346-5203; see the next bullet item), 11 are inconclusive, and and 30 are contaminants. The contaminants are dominated by QSO+star pairs for the OST and by star pairs for MT.
-
•
Based on the analysis of seeing Gemini-S images of the candidate quad DESJ2346-5203, and we conclude that this is not a quadruply imaged quasar in a classic configuration. If it is a multiply imaged quasar the morphology requires a complex deflector or extreme flux ratio anomalies. High resolution imaging or spectroscopy are required to definitely rule out (or confirm) this system as a lens.
-
•
We summarize the results of our Fall 2016 observing campaign with the Keck, SOAR, NTT, Shane Telescopes. In total we followed up 117 targets, confirming 7 lenses including 2 quads, and found 7 NIQs. The observations were inconclusive for 27 targets, yielding a success rate in the range 6-35%. This success rate is comparable with those of other large searches for lensed quasars even though no spectroscopic information nor -band imaging was available to help in the selection.
In conclusion, the results of the first extensive STRIDES follow-up campaign demonstrate that multiply imaged quasars can be found efficiently from wide field imaging survey even in the absence of -band or spectroscopic preselection. At the conclusion of our multi-year campaign, with the investment of telescope time to carry out imaging and spectroscopic follow-up of DES-selected targets, STRIDES should more then double the current a sample of known lensed quasars, and thus enable significant progress in our understanding of the nature of dark matter and dark energy.
Acknowledgments
The authors thank the referee for a constructive report that helped improved the paper. T.T. thanks Masamune Oguri for several useful conversations on finding lensed quasars and on SQLS. T.T. and V.M. acknowledge support by the Packard Foundation through a Packard Research Fellowship to T.T. T.T. acknowledges support by the National Science Foundation through grants AST-1450141 and AST-1714953. C.D.F. and G.C.F.C. acknowledge support from the National Science Foundation through grants AST-1312329 and AST-1715611. T. A. and Y.A. acknowledge support by proyecto FONDECYT 11130630 and by the Ministry for the Economy, Development, and Tourism’s Programa Inicativa Científica Milenio through grant IC 12009, awarded to The Millennium Institute of Astrophysics (MAS). F. C., V. B., and J. C. acknowledge support from the Swiss National Science Foundation. S.H.S. thanks the Max Planck Society for support through the Max Planck Research Group.
Funding for the DES Projects has been provided by the U.S. Department of Energy, the U.S. National Science Foundation, the Ministry of Science and Education of Spain, the Science and Technology Facilities Council of the United Kingdom, the Higher Education Funding Council for England, the National Center for Supercomputing Applications at the University of Illinois at Urbana-Champaign, the Kavli Institute of Cosmological Physics at the University of Chicago, the Center for Cosmology and Astro-Particle Physics at the Ohio State University, the Mitchell Institute for Fundamental Physics and Astronomy at Texas A&M University, Financiadora de Estudos e Projetos, Fundação Carlos Chagas Filho de Amparo à Pesquisa do Estado do Rio de Janeiro, Conselho Nacional de Desenvolvimento Científico e Tecnológico and the Ministério da Ciência, Tecnologia e Inovação, the Deutsche Forschungsgemeinschaft and the Collaborating Institutions in the Dark Energy Survey.
The Collaborating Institutions are Argonne National Laboratory, the University of California at Santa Cruz, the University of Cambridge, Centro de Investigaciones Energéticas, Medioambientales y Tecnológicas-Madrid, the University of Chicago, University College London, the DES-Brazil Consortium, the University of Edinburgh, the Eidgenössische Technische Hochschule (ETH) Zürich, Fermi National Accelerator Laboratory, the University of Illinois at Urbana-Champaign, the Institut de Ciències de l’Espai (IEEC/CSIC), the Institut de Física d’Altes Energies, Lawrence Berkeley National Laboratory, the Ludwig-Maximilians Universität München and the associated Excellence Cluster Universe, the University of Michigan, the National Optical Astronomy Observatory, the University of Nottingham, The Ohio State University, the University of Pennsylvania, the University of Portsmouth, SLAC National Accelerator Laboratory, Stanford University, the University of Sussex, Texas A&M University, and the OzDES Membership Consortium.
Based in part on observations at Cerro Tololo Inter-American Observatory, National Optical Astronomy Observatory, which is operated by the Association of Universities for Research in Astronomy (AURA) under a cooperative agreement with the National Science Foundation.
The DES data management system is supported by the National Science Foundation under Grant Numbers AST-1138766 and AST-1536171. The DES participants from Spanish institutions are partially supported by MINECO under grants AYA2015-71825, ESP2015-88861, FPA2015-68048, SEV-2012-0234, SEV-2016-0597, and MDM-2015-0509, some of which include ERDF funds from the European Union. IFAE is partially funded by the CERCA program of the Generalitat de Catalunya. Research leading to these results has received funding from the European Research Council under the European Union’s Seventh Framework Program (FP7/2007-2013) including ERC grant agreements 240672, 291329, and 306478. We acknowledge support from the Australian Research Council Centre of Excellence for All-sky Astrophysics (CAASTRO), through project number CE110001020.
This manuscript has been authored by Fermi Research Alliance, LLC under Contract No. DE-AC02-07CH11359 with the U.S. Department of Energy, Office of Science, Office of High Energy Physics. The United States Government retains and the publisher, by accepting the article for publication, acknowledges that the United States Government retains a non-exclusive, paid-up, irrevocable, world-wide license to publish or reproduce the published form of this manuscript, or allow others to do so, for United States Government purposes.
(Some of) The data presented herein were obtained at the W. M. Keck Observatory, which is operated as a scientific partnership among the California Institute of Technology, the University of California and the National Aeronautics and Space Administration. The Observatory was made possible by the generous financial support of the W. M. Keck Foundation. The authors wish to recognize and acknowledge the very significant cultural role and reverence that the summit of Maunakea has always had within the indigenous Hawaiian community. We are most fortunate to have the opportunity to conduct observations from this mountain. Based in part on observations obtained at the Southern Astrophysical Research (SOAR) telescope, which is a joint project of the Ministério da Ciência, Tecnologia, Inovaçãos e Comunicaçãoes (MCTIC) do Brasil, the U.S. National Optical Astronomy Observatory (NOAO), the University of North Carolina at Chapel Hill (UNC), and Michigan State University (MSU). Based in part on observations obtained at the Gemini Observatory, which is operated by the Association of Universities for Research in Astronomy, Inc., under a cooperative agreement with the NSF on behalf of the Gemini partnership: the National Science Foundation (United States), the National Research Council (Canada), CONICYT (Chile), Ministerio de Ciencia, Tecnología e Innovación Productiva (Argentina), and Ministério da Ciência, Tecnologia e Inovação (Brazil). Based in part on observations made with ESO Telescopes at the La Silla Paranal Observatory. This publication makes use of data products from the Wide-field Infrared Survey Explorer, which is a joint project of the University of California, Los Angeles, and the Jet Propulsion Laboratory/California Institute of Technology, funded by the National Aeronautics and Space Administration.
References
- Abbott et al. (2018) Abbott T. M. C., et al., 2018, preprint, (arXiv:1801.03181)
- Agnello (2017) Agnello A., 2017, MNRAS, 471, 2013
- Agnello & Spiniello (2018) Agnello A., Spiniello C., 2018, preprint, (arXiv:1805.11103)
- Agnello et al. (2015) Agnello A., et al., 2015, MNRAS, 454, 1260
- Agnello et al. (2016) Agnello A., Sonnenfeld A., Suyu S. H., Treu T., Fassnacht C. D., Mason C., Bradač M., Auger M. W., 2016, MNRAS, 458, 3830
- Agnello et al. (2018a) Agnello A., et al., 2018a, MNRAS,
- Agnello et al. (2018b) Agnello A., Grillo C., Jones T., Treu T., Bonamigo M., Suyu S. H., 2018b, MNRAS, 474, 3391
- Agnello et al. (2018c) Agnello A., et al., 2018c, MNRAS, 475, 2086
- Anguita et al. (2018) Anguita T., et al., 2018, MNRAS, in press, (arXiv:1805.12151)
- Auger et al. (2009) Auger M. W., Treu T., Bolton A. S., Gavazzi R., Koopmans L. V. E., Marshall P. J., Bundy K., Moustakas L. A., 2009, ApJ, 705, 1099
- Bertin & Arnouts (1996) Bertin E., Arnouts S., 1996, A&AS, 117, 393
- Bertin et al. (2002) Bertin E., Mellier Y., Radovich M., Missonnier G., Didelon P., Morin B., 2002, in Bohlender D. A., Durand D., Handley T. H., eds, Astronomical Society of the Pacific Conference Series Vol. 281, Astronomical Data Analysis Software and Systems XI. p. 228
- Beucher (1992) Beucher S., 1992, Scanning Microscopy International, suppl. 6. 1992, pp. 299-314, suppl. 6, 299
- Birrer & Amara (2018) Birrer S., Amara A., 2018, arXiv, arXiv:1803.09746
- Birrer et al. (2015) Birrer S., Amara A., Refregier A., 2015, ApJ, 813, 102
- Birrer, Amara, & Refregier (2016) Birrer S., Amara A., Refregier A., 2016, JCAP, 8, 020
- Birrer et al. (2017) Birrer S., Amara A., Refregier A., 2017, JCAP, 5, 037
- Bolton et al. (2008a) Bolton A. S., Burles S., Koopmans L. V. E., Treu T., Gavazzi R., Moustakas L. A., Wayth R., Schlegel D. J., 2008a, ApJ, 682, 964
- Bolton et al. (2008) Bolton A. S., Burles S., Koopmans L. V. E., Treu T., Gavazzi R., Moustakas L. A., Wayth R., Schlegel D. J., 2008, ApJ, 682, 964
- Bonvin et al. (2017a) Bonvin V., et al., 2017a, MNRAS, 465, 4914
- Browne et al. (2003) Browne I. W. A., et al., 2003, MNRAS, 341, 13
- Chae (2007) Chae K.-H., 2007, ApJL, 658, L71
- Choi et al. (2007) Choi Y.-Y., Park C., Vogeley M. S., 2007, ApJ, 658, 884
- Collett (2015) Collett T. E., 2015, ApJ, 811, 20
- Courbin et al. (2002) Courbin F., Saha P., Schechter P. L., 2002, in Courbin F., Minniti D., eds, Lecture Notes in Physics, Berlin Springer Verlag Vol. 608, Gravitational Lensing: An Astrophysical Tool. p. 1 (arXiv:astro-ph/0208043)
- Courbin et al. (2018) Courbin F., et al., 2018, AA, 609, A71
- Dalal & Kochanek (2002) Dalal N., Kochanek C. S., 2002, ApJ, 572, 25
- Dark Energy Survey Collaboration et al. (2016) Dark Energy Survey Collaboration et al., 2016, MNRAS, 460, 1270
- Ding et al. (2017) Ding X., et al., 2017, MNRAS, 465, 4634
- Drlica-Wagner et al. (2018) Drlica-Wagner A., et al., 2018, ApJS, 235, 33
- Ducourant et al. (2018) Ducourant C., et al., 2018, preprint, (arXiv:1805.07359)
- Fan et al. (2001) Fan X., et al., 2001, AJ, 121, 54
- Gaia Collaboration et al. (2016) Gaia Collaboration et al., 2016, AA, 595, A1
- Gaia Collaboration et al. (2018) Gaia Collaboration Brown A. G. A., Vallenari A., Prusti T., de Bruijne J. H. J., Babusiaux C., Bailer-Jones C. A. L., 2018, preprint, (arXiv:1804.09365)
- Gilman et al. (2018) Gilman D., Birrer S., Treu T., Keeton C. R., Nierenberg, A.M. 2018, MNRAS, in press, (arXiv:1712.04945)
- Grady (2006) Grady L., 2006, IEEE Transactions on Pattern Analysis and Machine Intelligence, 28(11), 1769
- Hyde & Bernardi (2009) Hyde J. B., Bernardi M., 2009, MNRAS, 396, 1171
- Inada et al. (2012) Inada N., et al., 2012, AJ, 143, 119
- Jarrett et al. (2011) Jarrett T. H., et al., 2011, ApJ, 735, 112
- Jee et al. (2016) Jee I., Komatsu E., Suyu S. H., Huterer D., 2016, JCAP, 4, 031
- Keeton et al. (1997) Keeton C. R., Kochanek C. S., Seljak U., 1997, ApJ, 482, 604
- Kormann et al. (1994) Kormann R., Schneider P., Bartelmann M., 1994, Astronomy and Astrophysics (ISSN 0004-6361), 284, 285
- Krone-Martins et al. (2018) Krone-Martins A., et al., 2018, preprint, (arXiv:1804.11051)
- Larkin et al. (2006) Larkin J., et al., 2006, SPIE, 6269, 62691A
- Lemon et al. (2018) Lemon C. A., Auger M. W., McMahon R. G., Ostrovski F., 2018, MNRAS,
- Lin et al. (2017) Lin H., et al., 2017, ApJL, 838, L15
- Mao & Schneider (1998) Mao S., Schneider P., 1998, MNRAS, 295, 587
- Mason et al. (2015) Mason C. A., et al., 2015, ApJ, 805, 79
- Metcalf & Madau (2001) Metcalf R. B., Madau P., 2001, ApJ, 563, 9
- More et al. (2016) More A., et al., 2016, MNRAS, 456, 1595
- Morganson et al. (2018) Morganson E., et al., 2018, PASP, 130, 074501
- Motta et al. (2017) Motta V., Mediavilla E., Rojas K., Falco E. E., Jiménez-Vicente J., Muñoz J. A., 2017, ApJ, 835, 132
- Nierenberg et al. (2014) Nierenberg A. M., Treu T., Wright S. A., Fassnacht C. D., Auger M. W., 2014, MNRAS, 442, 2434
- Nierenberg et al. (2017) Nierenberg A. M., et al., 2017, MNRAS, 471, 2224
- Oguri & Marshall (2010) Oguri M., Marshall P. J., 2010, MNRAS, 405, 2579
- Oguri et al. (2008) Oguri M., et al., 2008, The Astronomical Journal, 135, 512
- Orban de Xivry & Marshall (2009) Orban de Xivry G., Marshall P., 2009, MNRAS, 399, 2
- Ostrovski et al. (2018) Ostrovski F., et al., 2018, MNRAS, 473, L116
- Ostrovski et al. (2017) Ostrovski F., et al., 2017, MNRAS, 465, 4325
- Peng et al. (2006) Peng C. Y., Impey C. D., Rix H.-W., Kochanek C. S., Keeton C. R., Falco E. E., Lehár J., McLeod B. A., 2006, The Astrophysical Journal, 649, 616
- Pooley et al. (2009) Pooley D., Rappaport S., Blackburne J., Schechter P. L., Schwab J., Wambsganss J., 2009, ApJ, 697, 1892
- Refsdal (1964) Refsdal S., 1964, MNRAS, 128, 307
- Richards et al. (2001) Richards G. T., et al., 2001, AJ, 121, 2308
- Richards et al. (2005) Richards G. T., et al., 2005, MNRAS, 360, 839
- Richards et al. (2006) Richards G. T., et al., 2006, The Astronomical Journal, 131, 2766
- Riess et al. (2016) Riess A. G., et al., 2016, ApJ, 826, 56
- Riess et al. (2018b) Riess A. G., et al., 2018, ApJ, 861, 126
- Riess et al. (2018a) Riess A. G., et al., 2018, ApJ, 855, 136
- Rusu et al. (2017) Rusu C. E., et al., 2017, MNRAS, 467, 4220
- Schechter et al. (1997) Schechter P. L., et al., 1997, ApJL, 475, L85
- Schechter et al. (2014) Schechter P. L., Pooley D., Blackburne J. A., Wambsganss J., 2014, ApJ, 793, 96
- Schechter et al. (2017) Schechter P. L., Morgan N. D., Chehade B., Metcalfe N., Shanks T., McDonald M., 2017, AJ, 153, 219
- Schneider & Sluse (2013) Schneider P., Sluse D., 2013, AA, 559, A37
- Shajib et al. (2018) Shajib A. J., Treu T., Agnello A., 2018, MNRAS, 473, 210
- Sivakumar & Sivakumar (2015) Sivakumar P. R., Sivakumar J. N., 2015, https://www.youngscientistjournal.org/wp-content/uploads/sites/16/2015/05/Sivakumar.pdf
- Sluse et al. (2017) Sluse D., et al., 2017, MNRAS, 470, 4838
- Spiniello et al. (2018) Spiniello C., et al., 2018, preprint, (arXiv:1805.12436)
- Suyu et al. (2012) Suyu S. H., et al., 2012, preprint, (arXiv:1202.4459)
- Suyu et al. (2013) Suyu S. H., et al., 2013, ApJ, 766, 70
- Suyu et al. (2014) Suyu S. H., et al., 2014, ApJL, 788, L35
- Suyu et al. (2017) Suyu S. H., et al., 2017, MNRAS, 468, 2590
- Tie & Kochanek (2018) Tie S. S., Kochanek C. S., 2018, MNRAS, 473, 80
- Treu (2010) Treu T., 2010, ARA&A, 48, 87
- Treu & Koopmans (2002) Treu T., Koopmans L. V. E., 2002, MNRAS, 337, L6
- Treu & Marshall (2016) Treu T., Marshall P. J., 2016, AA Rev, 24, 11
- Treu et al. (2006) Treu T., Koopmans L. V., Bolton A. S., Burles S., Moustakas L. A., 2006, ApJ, 640, 662
- Treu et al. (2013) Treu T., et al., 2013, ArXiv:1306.1272,
- Turner et al. (1984) Turner E. L., Ostriker J. P., Gott III J. R., 1984, ApJ, 284, 1
- Vegetti et al. (2014) Vegetti S., Koopmans L. V. E., Auger M. W., Treu T., Bolton A. S., 2014, MNRAS, 442, 2017
- Walsh et al. (1979) Walsh D., Carswell R. F., Weymann R. J., 1979, Nat, 279, 381
- Weinberg et al. (2013) Weinberg D. H., Mortonson M. J., Eisenstein D. J., Hirata C., Riess A. G., Rozo E., 2013, PhysRep, 530, 87
- Weymann (1980) Weymann R. J., 1980, Royal Society of London Philosophical Transactions Series A, 296, 399
- Williams et al. (2017) Williams P., Agnello A., Treu T., 2017, MNRAS, 466, 3088
- Williams et al. (2018) Williams P. R., et al., 2018, MNRAS, 477, L70
- Wong et al. (2017) Wong K. C., et al., 2017, MNRAS, 465, 4895
- de Jong et al. (2013) de Jong J. T. A., Verdoes Kleijn G. A., Kuijken K. H., Valentijn E. A., 2013, Experimental Astronomy, 35, 25
- van der Walt et al. (2014) van der Walt S., et al., 2014, PeerJ, 2, e453
Affiliations
1Department of Physics and Astronomy, PAB, 430 Portola Plaza, Box 951547, Los Angeles, CA 90095-1547, USA
2European Southern Observatory, Karl-Schwarzschild-Strasse 2, 85748 Garching bei München, DE
3Kavli Institute for Particle Astrophysics and Cosmology, Stanford University, 452 Lomita Mall, Stanford, CA 94305, USA
4Fermi National Accelerator Laboratory, P. O. Box 500, Batavia, IL 60510, USA
5Laboratoire d’Astrophysique, Ecole Polytechnique Fédérale de Lausanne (EPFL), Observatoire de Sauverny, CH-1290 Versoix, Switzerland
6MIT Kavli Institute for Astrophysics and Space Research, 37-664G, 77 Massachusetts Avenue, Cambridge, MA 02139
7Illinois Mathematics and Science Academy, 1500 Sullivan Road, Aurora IL 60506-1067, USA
8University of California-Berkeley, Berkeley, CA 94720
9Departamento de Ciencias Fisicas, Universidad Andres Bello Fernandez Concha 700, Las Condes, Santiago, Chile
10Institute of Astronomy, Madingley Road, Cambridge CB3 0HA, UK
11Institute of Astronomy and Astrophysics, Academia Sinica, P.O. Box 23-141, Taipei 10617, Taiwan
12Department of Physics, University of California Davis, 1 Shields Avenue, Davis, CA 95616, USA
13Institute of Cosmology & Gravitation, University of Portsmouth, Portsmouth, PO1 3FX, UK
14Instituto de Física y Astronomía, Universidad de Valparaíso, Avda. Gran Bretaña 1111, Playa Ancha, Valparaíso 2360102, Chile
15Departamento de Astronomia, Instituto de Fsica da Universidade Federal do Rio Grande do Sul, 91501-970, Porto Alegre, Brazil
16Max-Planck-Institut für Astrophysik, Karl-Schwarzschild-Str. 1, D-85741 Garching, Germany
17Millenium Institute of Astrophysics, Chile
18Physik-Department, Technische Universität München, James-Franck-Straße 1, 85748 Garching, Germany
19Subaru Telescope, National Astronomical Observatory of Japan, 650 North A’ohoku Place, Hilo, HI 96720, U.S.A.
20 Cerro Tololo Inter-American Observatory, National Optical Astronomy Observatory, Casilla 603, La Serena, Chile
21 Department of Physics & Astronomy, University College London, Gower Street, London, WC1E 6BT, UK
22 Department of Physics and Electronics, Rhodes University, PO Box 94, Grahamstown, 6140, South Africa
23 Kavli Institute for Cosmology, University of Cambridge, Madingley Road, Cambridge CB3 0HA, UK
24 Laboratório Interinstitucional de e-Astronomia - LIneA, Rua Gal. José Cristino 77, Rio de Janeiro, RJ - 20921-400, Brazil
25 Observatório Nacional, Rua Gal. José Cristino 77, Rio de Janeiro, RJ - 20921-400, Brazil
26 Department of Astronomy, University of Illinois at Urbana-Champaign, 1002 W. Green Street, Urbana, IL 61801, USA
27 National Center for Supercomputing Applications, 1205 West Clark St., Urbana, IL 61801, USA
28 Institut de Física d’Altes Energies (IFAE), The Barcelona Institute of Science and Technology, Campus UAB, 08193 Bellaterra (Barcelona) Spain
29 Institut d’Estudis Espacials de Catalunya (IEEC), 08193 Barcelona, Spain
30 Institute of Space Sciences (ICE, CSIC), Campus UAB, Carrer de Can Magrans, s/n, 08193 Barcelona, Spain
31 Department of Physics and Astronomy, University of Pennsylvania, Philadelphia, PA 19104, USA
32 Centro de Investigaciones Energéticas, Medioambientales y Tecnológicas (CIEMAT), Madrid, Spain
33 Department of Astronomy/Steward Observatory, 933 North Cherry Avenue, Tucson, AZ 85721-0065, USA
34 Jet Propulsion Laboratory, California Institute of Technology, 4800 Oak Grove Dr., Pasadena, CA 91109, USA
35 Instituto de Fisica Teorica UAM/CSIC, Universidad Autonoma de Madrid, 28049 Madrid, Spain
36 Department of Astronomy, University of California, Berkeley, 501 Campbell Hall, Berkeley, CA 94720, USA
37 Lawrence Berkeley National Laboratory, 1 Cyclotron Road, Berkeley, CA 94720, USA
38 SLAC National Accelerator Laboratory, Menlo Park, CA 94025, USA
39 Department of Physics, ETH Zurich, Wolfgang-Pauli-Strasse 16, CH-8093 Zurich, Switzerland
40 Santa Cruz Institute for Particle Physics, Santa Cruz, CA 95064, USA
41 Center for Cosmology and Astro-Particle Physics, The Ohio State University, Columbus, OH 43210, USA
42 Department of Physics, The Ohio State University, Columbus, OH 43210, USA
43 Harvard-Smithsonian Center for Astrophysics, Cambridge, MA 02138, USA
44 Australian Astronomical Observatory, North Ryde, NSW 2113, Australia
45 Departamento de Física Matemática, Instituto de Física, Universidade de São Paulo, CP 66318, São Paulo, SP, 05314-970, Brazil
46 Department of Astronomy, The Ohio State University, Columbus, OH 43210, USA
47 Institució Catalana de Recerca i Estudis Avançats, E-08010 Barcelona, Spain
48 Department of Physics and Astronomy, Pevensey Building, University of Sussex, Brighton, BN1 9QH, UK
49 Department of Physics, University of Michigan, Ann Arbor, MI 48109, USA
50 School of Physics and Astronomy, University of Southampton, Southampton, SO17 1BJ, UK
51 Brandeis University, Physics Department, 415 South Street, Waltham MA 02453
52 Instituto de Física Gleb Wataghin, Universidade Estadual de Campinas, 13083-859, Campinas, SP, Brazil
53 Computer Science and Mathematics Division, Oak Ridge National Laboratory, Oak Ridge, TN 37831