A lesson from GW170817: most neutron star mergers result in tightly collimated successful GRB jets
Abstract
The joint detection of gravitational waves (GWs) and -rays from a binary neutron-star (NS) merger provided a unique view of off-axis GRBs and an independent measurement of the NS merger rate. Comparing the observations of GRB170817 with those of the regular population of short GRBs (sGRBs), we show that an order unity fraction of NS mergers result in sGRB jets that breakout of the surrounding ejecta. We argue that the luminosity function of sGRBs, peaking at , is likely an intrinsic property of the sGRB central engine and that sGRB jets are typically narrow with opening angles . We perform Monte Carlo simulations to examine models for the structure and efficiency of the prompt emission in off-axis sGRBs. We find that only a small fraction () of NS mergers detectable by LIGO/VIRGO in GWs is expected to be also detected in prompt -rays and that GW170817-like events are very rare. For a NS merger rate of Gpc-3 yr-1, as inferred from GW170817, we expect within the next decade up to joint detections with off-axis GRBs for structured jet models and just for quasi-spherical cocoon models where -rays are the result of shock breakout. Given several joint detections and the rates of their discoveries, the different structure models can be distinguished. In addition the existence of a cocoon with a reservoir of thermal energy may be observed directly in the UV, given a sufficiently rapid localisation of the GW source.
keywords:
gamma-ray burst: general – gravitational waves – stars: jets – stars: neutron1 Introduction
The connection between neutron star-neutron star (NS-NS) or neutron star-black hole (NS-BH) mergers with short-duration Gamma Ray Bursts (sGRBs) and the nucleosynthesis of -process elements dates back to a few seminal works from the nineteen seventies and eighties (Lattimer & Schramm, 1974, 1976; Blinnikov et al., 1984; Paczynski, 1986; Goodman, 1986; Eichler et al., 1989). In recent years, the rate of -process formation has been constrained using various observational lines of argument (Hotokezaka, Piran & Paul, 2015; Ji et al., 2016; Beniamini, Hotokezaka & Piran, 2016; Macias & Ramirez-Ruiz, 2016; Hotokezaka, Beniamini & Piran, 2018; Beniamini, Dvorkin & Silk, 2018). It was shown to be broadly consistent with the rate of sGRBs (Guetta & Piran, 2006; Guetta & Stella, 2009; Coward et al., 2012; Wanderman & Piran, 2015; Ghirlanda et al., 2016) and with the rate of NS mergers as inferred from observations of Galactic double neutron stars (Kochanek & Piran, 1993; Kim, Perera & McLaughlin, 2015). However, a clear determination of NS-NS mergers being the progenitors of sGRBs and the main source of -process elements remained somewhat uncertain until the recent discovery of the kilonova AT2017gfo (Tanvir et al., 2017) and GRB170817 (Goldstein et al., 2017), accompanying the NS-NS merger event GW170817 (Abbott et al., 2017b). This recent discovery also leads to a new and independent estimate of the rate of NS-NS mergers. Furthermore, the observations of a very weak GRB accompanying the event, and detailed modelling of the peculiar and long-lived afterglow that followed the event, provides us with information regarding the opening angle, viewing angle, and core luminosity of GRB170817.
The GW170817/GRB170817 event provides an unprecedented opportunity to explore sGRB jets in a broader context: How frequently do sGRB jets manage to break through the ejecta material surrounding the NS-NS mergers? What are the typical opening angles of sGRB jets? What determines the shape of the sGRB luminosity function? These topics have been partially explored in the past, either from an observational point of view, using the data from electromagnetically-detected sGRBs (i.e., not accompanied by a GW event) (Wanderman & Piran, 2015; Ghirlanda et al., 2016; Moharana & Piran, 2017), or from hydrodynamical studies of the GRB jet propagation through the NS-NS merger ejecta (Aloy, Janka & Müller, 2005; Hotokezaka et al., 2013; Nagakura et al., 2014; Murguia-Berthier et al., 2014; Lazzati et al., 2017b; Bromberg et al., 2018; Duffell et al., 2018). Here, we show that by combining this knowledge with the unique constraint from GW170817 we can probe these questions in greater detail, thus significantly improving our understanding of these issues.
The discovery of GRB170817 raised perhaps as many new questions as answers. In particular, the extremely dim prompt GRB accompanying the event has led to different interpretations, according to which the observed -ray emission is either arising from the ‘wings’ of the jet (material beyond the core that is less energetic) due to the same physical process that produces the prompt emission along the jet’s axis (Kathirgamaraju, Barniol Duran & Giannios, 2018; Lamb & Kobayashi, 2017; Granot, Guetta & Gill, 2017), or is due to shock breakout from the thermal energy stored in the cocoon that was produced by the jet-ejecta interaction (Lazzati et al., 2017b; Gottlieb et al., 2017; Kasliwal et al., 2017). Although GRB170817 alone is not enough to distinguish between the proposed models, we show that our understanding can be significantly improved once a sample of joint GRB and GW detections has been established and their luminosity and viewing angle distributions have been studied.
The paper is organized as follows. In §2 we revisit the rate and luminosity function of sGRBs and show that the latest results from GW170817 strongly constrain: the fraction of NS-NS mergers accompanied by sGRBs, the opening angles of sGRBs, and the interpretation of their luminosity function. In §3 we consider different models for the off-axis prompt GRB emission. By performing Monte Carlo simulations, we compare the observed properties arising from different emission models, in cases with a joint GW and prompt GRB detection. In §4 we focus on the cocoon model and discuss an additional observable signal that can directly constrain the thermal energy stored in the cocoon. Finally, we discuss some implications of this work and conclude in §5.
2 Successful sGRB jets and the sGRB luminosity function
2.1 General considerations - rate comparison
The observed luminosities of sGRBs are a convolution of the intrinsic luminosity function and the volumetric rate . Wanderman & Piran (2015) find that, in the local universe, the rate of sGRBs is:
| (1) |
where , , is the beaming factor, and is the minimum luminosity of the GRB luminosity function, which is typically assumed. Note that the lowest observed luminosity of a sGRB in the sample considered by Wanderman & Piran (2015) is . This is an absolute maximum on the true value of .
It has been long theorized (Blinnikov et al., 1984; Paczynski, 1986; Goodman, 1986; Eichler et al., 1989) and recently proved by the dual detection of GW170817/GRB170817 (Abbott et al., 2017b) that NS mergers (either NS-NS or NS-BH) lead to sGRBs. However, it is possible that not all NS mergers result in a successful GRB. We denote the ratio of failed to successful sGRBs rates by . The NS merger rate as inferred by the LIGO event, GW170817, is Gpc-3 yr-1 (Abbott et al., 2017b). Combining this with equation (1) and assuming a double-sided top-hat jet with opening angle , we find:
| (2) |
where and the numerical value holds for . Note that for clarity we have dropped here and in the following the errors in , but our main conclusions remain unaltered, when considering the minimum and maximum allowed value of . Since neither can be larger than nor can change significantly compared to the canonical value used above, the ratio of failed to successful jets cannot be very large. On the contrary, this ratio is estimated to be in long (collapsar) GRBs; here we apply equation 4 but with , as appropriate for long GRBs (Wanderman & Piran, 2010) (see also Petropoulou, Barniol Duran & Giannios, 2017; Sobacchi et al., 2017). This huge difference in the expected rates of failed short and long GRBs may be related to the nature of the ejecta that the jet has to propagate through. For example, the expansion of the dynamical ejecta in the case of a NS merger may facilitate the jet breakout (Duffell et al., 2018) in contrast to the jet propagation through the quasi-static outer layers of the collapsing star expected in the case of long GRBs (Bromberg et al., 2011).
2.2 Interpretation of the sGRB luminosity function
The (isotropic equivalent) luminosity function of both short and long GRBs (after de-convolving with the rate function) is described by a broken power law:
| (3) |
For sGRBs , and (Wanderman & Piran, 2015). Henceforth, we adopt the luminosity function reported by Wanderman & Piran (2015), while noting that none of our main conclusions would change, if we were to adopt other values for the power-law slopes and/or break luminosity reported in the literature (Guetta & Piran, 2006; Salvaterra et al., 2008; Ghirlanda et al., 2016). We next explore three different interpretations to the broken power-law nature of : (i) arising due to the increasing fraction of failed GRB jets for , (ii) being the result of the angular structure of sGRBs, or finally (iii), being an intrinsic property of the sGRB central engine.
2.2.1 Failed jets
Petropoulou, Barniol Duran & Giannios (2017) have argued that the broken power-law nature of in long GRBs could result from an underlying single power-law distribution of luminosities, that is then modified at lower luminosities due to an ever increasing fraction of failed GRB jets. This provides a natural explanation for the apparent more complicated luminosity function whereby the interpretation for is the maximum luminosity for which not all long GRB jets manage to break out of the stellar envelope.
Interestingly, the same interpretation cannot hold for sGRBs. This is clear from the fact that within the Petropoulou, Barniol Duran & Giannios (2017) framework, the slope of above is that of the true underlying distribution. In this context, the ratio of failed sGRB to successful sGRB engines at can be then extrapolated to lower luminosities as:
| (4) |
which is clearly in contradiction with equation (2) by more than two orders of magnitude.
2.2.2 Angular structure
Another potential way to explain the broken power-law nature of the luminosity function is to consider that GRBs have a wide structure beyond the jet core, i.e., the jet luminosity is constant up to some and then decreases for larger angles (Lipunov, Postnov & Prokhorov, 2001; Frail et al., 2001; Rossi, Lazzati & Rees, 2002; Zhang & Mészáros, 2002; Granot & Kumar, 2003; Eichler & Levinson, 2004; van Eerten & MacFadyen, 2012; Pescalli et al., 2015). In this context, the distribution below may become dominated by GRBs that are marginally above the critical core luminosity , but are seen progressively more off axis as . This particular scenario would imply an increased intrinsic minimal core luminosity, , and hence would increase the ratio of failed to successful jets given by equation (2), which could help to reduce (and potentially resolve) the inconsistency with the estimate given by equation (4). As an illustration, let us consider that the jet (isotropic equivalent) luminosity is constant up to a latitude and then declines as for . Assuming an isotropic distribution of solid angles and the same structure for all sGRB jets, this will lead to . This matches the observed , only if the typical value of the jet structure slope is . Such a shallow profile however (close to the so called “universal jet” structure; see Rossi, Lazzati & Rees 2002; Zhang & Mészáros 2002) could be in contention with observations of the X-ray afterglow luminosity to -ray energy ratio, unless the Lorentz factors of GRBs remain at large angles (Beniamini & Nakar, 2019).
It is constructive to compare the value of obtained above, with the constraints from GRB170817. Unless the efficiency of -ray production decreases significantly at angles beyond the core (in which case the angular structure hypothesis for the luminosity function is clearly invalid), the observed -ray luminosity of that event, , must be at least as large as the extrapolation of the core luminosity to the observed angle (so as not to over-produce -rays compared to observations). This leads to a lower limit on , i.e. , where (Goldstein et al., 2017) and (Mooley et al., 2018a). Taking , which is roughly the minimal core luminosity under the interpretation that the shape of the luminosity function is driven by the angular structure, and adopting the minimum allowed value for (see §2.2.2), we find ; larger values of would require even steeper profiles. The obtained value of is in contention with derived previously.
Thus, the interpretation that the luminosity below is dominated by off-axis events is challenged by observations, under the assumptions of a common jet structure among all sGRBs and large efficiency beyond the jet core.
2.2.3 Intrinsic structure
A third possibility is that the broken power-law luminosity function determined by observational studies (Guetta & Piran, 2006; Guetta & Stella, 2009; Wanderman & Piran, 2015; Ghirlanda et al., 2016) actually reflects the intrinsic power produced by the central engine. We turn next to explore the implications of this interpretation of the luminosity function on the typical opening angles of sGRBs and on the expected distributions of luminosities and observation angles as probed by future joint detections of prompt GRBs and GWs.
2.3 Constraining the opening angles of short GRBs
We now use the connection between the rate of NS mergers and sGRBs to constrain the jet opening angle, , as described below. Following our reasoning in §2.2.2, we assume here that there is a typical (or universal) sGRB opening angle, and that sGRB angular profiles are sufficiently steep, such that they are typically observed at . Different arguments and constraints point to jets having a narrow range of opening angles centered around .
First, since , equation (2) provides a lower limit on the allowed opening angles of sGRBs (or equivalently on the beaming factor) which is roughly:
| (5) |
At the same time, observations of sGRBs over the last 14 years with Neil Gehrels Swift satellite, provide us with an upper limit on the allowed value for sGRB opening angles. Considering the sample of observed Swift BAT bursts with s 111This choice does not result in a pure non-collapsar GRB sample. The contamination by collapsar GRBs, however, can only increase and in turn with respect to its true value., we search the online database222https://swift.gsfc.nasa.gov/archive/grb_table/ and find that the maximum peak photon flux of sGRBs within years of observations (in the keV range) is . For a given redshift and corresponding luminosity distance , this can be translated to a -ray peak luminosity as:
| (6) |
where is the differential photon spectrum described by the so-called Band function (computed in the source frame) (Band et al., 1993). Here, we have considered the spectral range at the source to be 1 keV-10 MeV. The latter is the same spectral range over which the luminosities in Wanderman & Piran (2015) were computed and is therefore the appropriate choice in order to make a comparison with their values, as we do below. In what follows we assume typical observed sGRB parameters: , , keV (Nava et al., 2011). Using equation (6) and requiring that (the same value of considered above), we find a conservative minimum distance from which current Swift BAT bursts could have originated Mpc. In other words, even a burst that had an intrinsic (isotropic equivalent) luminosity at the core as low as would have resulted in a peak flux larger than any of the observed Swift BAT bursts, if its distance from us was less than 250 Mpc. Thus, the opening angle of sGRBs has to be small enough to be consistent with the non-detection of bursts with at Mpc. For a fixed rate of NS mergers, the upper limit on is independent of the inferred local sGRB rate given by equation (1):
| (7) | |||
where and where we have conservatively used an efficiency of for the detectability of Swift sGRBs above the BAT threshold (Burns et al., 2016). We note also that a comparable, though somewhat larger estimate for can be obtained by using Fermi GBM data. In this case, the efficiency is larger (Racusin et al., 2017) while the observation period is slightly shorter years. According to Lu et al. (2017), (between 8 keV and 40 MeV) for this period. Using the typical spectral parameters for GBM bursts, namely keV (Nava et al., 2011), we find Mpc and .
As we show next, comparing the ratio of merger rates to sGRB rates as given by equation (2) to the fraction of successful jets as probed by recent numerical analysis of the jet-merger outflow interaction (Duffell et al., 2018) provides in turn, an estimate of (instead of a lower and upper limit as presented above).
Duffell et al. (2018) find that jets are successful if the beaming corrected energy in the jet is larger than a critical value , where is the energy deposited in the NS merger ejecta. Throughout this work, we assume that the opening angle of the injected jet in the simulations by Duffell et al. (2018) is equal to the jet opening angle after breakout from the NS merger ejecta. This is an appropriate approximation for jets propagating in a non-expanding medium (Bromberg et al., 2011), but it remains to be shown whether this also holds for jets pummeling through an expanding medium. Taking erg as a typical value for the kinetic energy of the NS merger ejecta (Hotokezaka, Beniamini & Piran, 2018)333This is inferred from the modelling of the kilonova emission following GW170817 (Kasen et al., 2017; Tanaka et al., 2017). and a constant time of engine activity given by the typical sGRB duration (in the central engine frame) s (Kouveliotou et al., 1993), the condition translates to:
| (8) |
where , is the efficiency of converting the injected jet power into observed -rays in the prompt phase and is normalized to a characteristic value inferred from observations (Beniamini et al., 2015; Beniamini, Nava & Piran, 2016). Notice that is very close to the canonical value for . Were , then a second break in the sGRB luminosity function should be present, which is not observed444The possibility of is ruled out by the rate comparison in equation 2, as was demonstrated explicitly in §2.2.1.. The ratio of failed to successful sGRB rates can also be estimated from the sGRB luminosity function (see equation (3)) and it may be written as . This condition is satisfied when
| (9) |
where equation (2) was used. Interestingly, the allowed values of obtained from equations (5), (7), and (9) are consistent with two independent estimates of the opening angle in GRB170817:
-
1.
recent measurements of superluminal motion in GRB170817 (Mooley et al., 2018a) using VLBI data demonstrated that in GRB170817.
- 2.
Our analysis suggests that the majority of sGRB jets (or even all) is successful in breaking out of the surrounding ejecta. In addition, assuming that the opening angle of sGRBs is independent of their luminosity, we showed that ; these are tighter constraints than existing ones for the sGRB population (Janka et al., 2006; Fong et al., 2015). Note that these results do not depend too strongly on the value of , which will be better constrained in the future with more observations of GWs from NS mergers (see also Hotokezaka et al., 2018, for comparison with -process rates suggesting a comparable but possibly slightly lower rate).
3 Probing GRB models with joint GW & prompt GRB detections
The detection of a GW signal could boost the likelihood of association of an otherwise marginal -ray signal with an underlying GRB and of the identification of the host galaxy (Patricelli et al., 2016; Abbott et al., 2017a; Kathirgamaraju, Barniol Duran & Giannios, 2018; Beniamini et al., 2018). NS mergers detected by GWs also select nearby events. The observed distribution of sGRB luminosities that are also detected in GWs is therefore expected to be different than that of sGRBs with no GW detection. This implies that joint GW and prompt GRB detections could provide a unique probe to the distribution of the -ray luminosity as a function of angle with respect to the jet symmetry axis , and therefore, to the underlying jet and/or cocoon physics.
Indeed, the observation of the first sGRB with a GW signal is a demonstration of this point. This GRB had a prompt -ray luminosity which is approximately four orders of magnitude lower than the previously weakest sGRB with confirmed redshift and it was observed from a relatively large viewing angle, i.e., (Finstad et al., 2018). In this case, the low observed luminosity may be the result of a quasi-isotropic radiatively inefficient555This is compared to the available energy along the line of sight to the observer. component (e.g., due to a cocoon) that accompanies GRB jets or of the intrinsic angular jet structure, which could suppress the emission at angles (Kathirgamaraju, Barniol Duran & Giannios, 2018; Fraija et al., 2017; Lamb & Kobayashi, 2017; Lazzati et al., 2017b, a; Gottlieb et al., 2017; Kasliwal et al., 2017; Margutti et al., 2018; Troja et al., 2018; Barkov et al., 2018; Lazzati et al., 2018).
3.1 Monte Carlo simulations
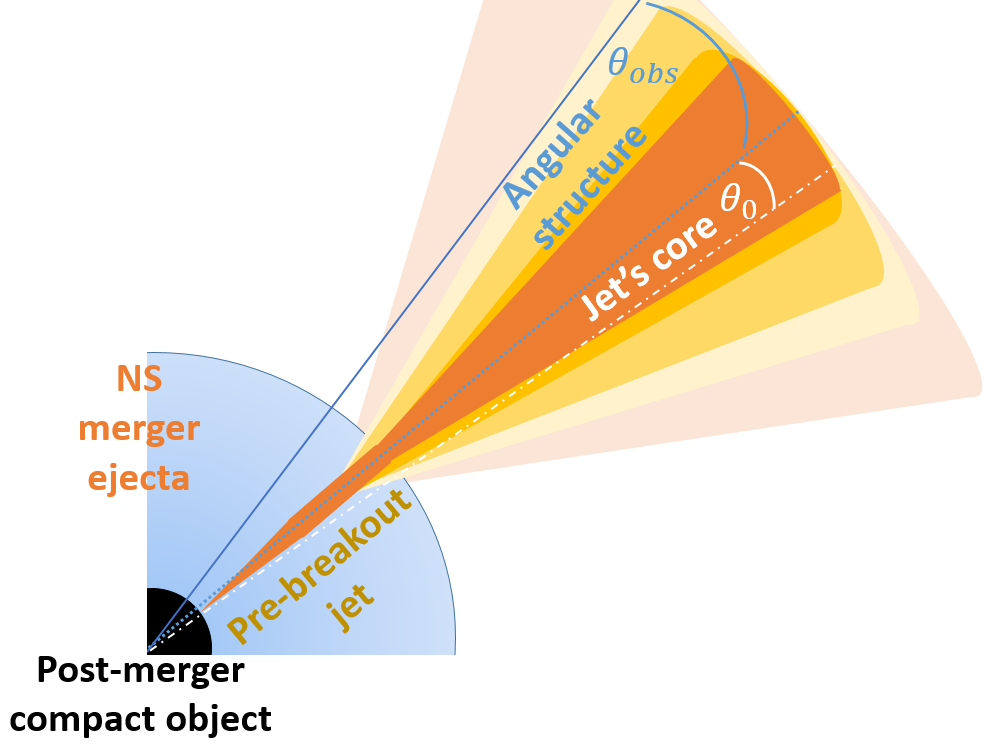
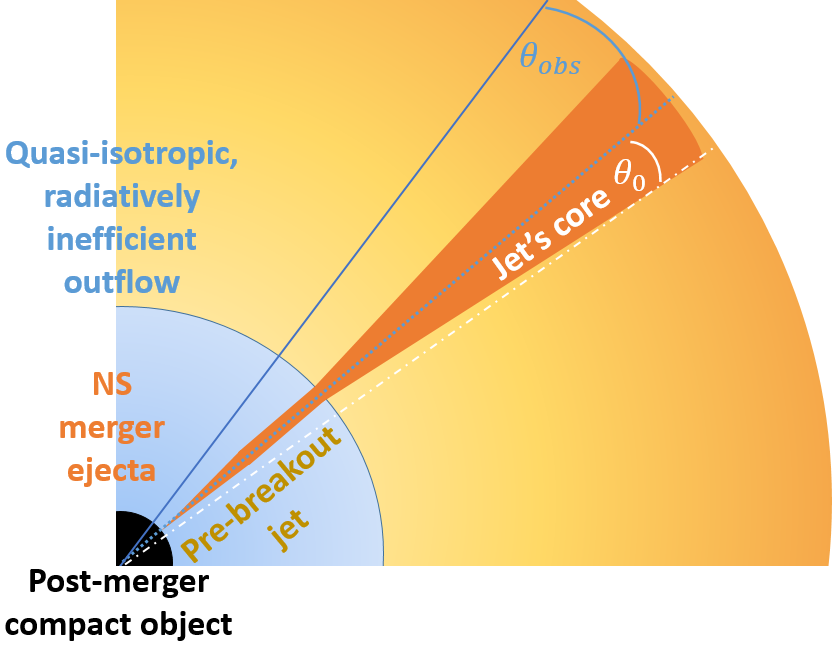
We focus here on two extreme cases for the angular/radial profile of the jet: (i) a ‘structured- jet’ (SJ) model, in which the luminosity is a power-law (PL) or Gaussian (GS) function of the angle from the core and the radiative efficiency remains constant as a function of latitude and (ii) a ‘cocoon-like’ (CL) model, where a top-hat jet is accompanied by a quasi-spherical, radiatively inefficient outflow, possibly with significant radial structure. A schematic illustration is presented in Figure 1. We stress that in reality the situation may lie somewhere in between these two extremes.
We perform a Monte Carlo (MC) simulation to explore the resulting -ray luminosity, and observation angle, , distributions arising from different parameters of the two underlying models mentioned above. We begin each realization of the MC by drawing a random orientation between the jet core (which is taken to be perpendicular to the merger plane) and the line of sight (i.e. uniform in and ) and a distance, , of the event according to the rate function of Wanderman & Piran (2015). We impose a cut-off at the maximum distance for which NS mergers can be detected in GWs with future capabilities, Mpc (Abbott et al., 2017b)666For the distance scales relevant for GW detection, cosmological effects can, to a good approximation, be neglected, and the bursts can be assumed to be randomly distributed within a sphere of radius .; later on we test the dependence of the results on , by adopting Mpc for all explored models. Following our reasoning in §2.2, we then simulate the luminosity of the jet core according to the luminosity function in (3). From the discussion in §2.3, we expect . We consider this as the canonical value for all simulated bursts, but for completeness, consider also the cases of and . For a given structure model, the emissivity is then extrapolated to larger angles. For each event, we calculate both the on line-of-sight contribution to the emission (i.e., from emitters that see the observer within their relativistic beaming cone) and the off line-of-sight contribution (Eichler & Levinson, 2004; Granot & Ramirez-Ruiz, 2010; Kasliwal et al., 2017; Granot et al., 2017; Ioka & Nakamura, 2018; Kathirgamaraju, Barniol Duran & Giannios, 2018). The latter is calculated in the following way (see, e.g., Kasliwal et al., 2017). Assuming , the observed energy scales as:
| (13) |
where the sub-script ‘em’ denotes emitted quantities, the sub-script ‘obs’ denotes observed ones, and we set in our simulations. The duration scales as if the burst duration is set by a ‘single’ emission episode that takes place at some location that extends over a range of radii or as if the burst duration is set by the radial width of the outflow. In what follows, we assume that the duration is set by the radial width of the outflow and that s. The luminosity then scales as the ratio of to . This provides an upper limit on the off line-of sight luminosity and is therefore a conservative choice for our simulations. Even in this case, we find that the off line-of-sight emission is sub-dominant to the on line-of sight emission, unless the angular profile is extremely steep and the observation angle is close to jet core.
Computing the emission from structured-jet (SJ) simulated events is meaningful only if the jet has successfully broken out of the ejecta.This is in accord with results of hydrodynamical simulations of jet and NS merger interaction (Duffell et al., 2018). Furthermore, as shown in §2, a large fraction of sGRB jets (and possibly all) are expected to successfully break out of the expanding ejecta. We therefore assume in all SJ models. We explore three variants of the SJ models described below:
-
•
A power-law (SJPL) model, where for and for . The value of in this model is constrained by the observations of GRB170817. For a given value of , must satisfy777This condition is at first glance similar to the condition discussed in §2.2.2 when considering whether it is possible to explain the broken power-law nature of the luminosity function with angular structure (in which case the minimum core luminosity is given by ). However, since we argue that this possibility is unlikely and that the luminosity function is intrinsic, we conservatively replace here by . , since the lowest core luminosity is given by and the extrapolation of this luminosity to (Mooley et al., 2018a; van Eerten et al., 2018) should not overproduce -rays as compared with those observed for GRB170817. This consideration implies for , for and for (where we have taken here into account the uncertainty quoted above).
-
•
A Gaussian (SJG) model, where . As in the SJPL case, this family of models can be limited by the requirement to not overproduce -rays compared to GRB170817. Applied to this model, this consideration puts an upper limit on of: (where once more we have taken here into account the uncertainty quoted previously).
-
•
A simplified cocoon-like (CL) model, where for and for . Here, is the peak (isotropic equivalent) cocoon breakout luminosity. An estimate of this luminosity (and related observational consequences of the thermal energy reservoir stored in the cocoon) is provided in §4 (and in particular equation 20).
For each simulated event, we compute the -ray flux by taking all relevant contributions for the SJ and CL models, as described above. Then, a simulated GRB is assumed to be detectable, if its prompt -ray flux exceeds the Fermi GBM threshold (Goldstein et al., 2017); note that for sGRBs one can neglect the duration in the definition of the limiting flux. The detectability of GWs is a complex function of the viewing angle with respect to the merger plane (Schutz, 2011; Allen et al., 2012; Hilborn, 2018). Using the angular dependence of the detection probability given in Schutz (2011) (see equation (27) therein) and scaling with the horizon distance for binary mergers of 220 Mpc, we define as detectable in GWs any simulated events that satisfy the condition:
| (14) |
The Monte Carlo process is repeated times, and the burst properties are recorded for events with joint -ray and GW detection or with just one of the two.
| Model | (a) | (b) | (c) | (d) | |
|---|---|---|---|---|---|
| PL () | 0.05 | 0.94 (0.9) | 0.002 (0.001) | 0.05 (0.01) | 0.21 (0.5) |
| PL () | 0.1 | 0.93 (0.93) | 0.006 (0.002) | 0.06 (0.07) | 0.2 (0.39) |
| PL () | 0.1 | 0.95 (0.96) | 0.006 (0.002) | 0.04 (0.04) | 0.17 (0.28) |
| PL () | 0.2 | 0.92 (0.96) | 0.03 (0.01) | 0.05 (0.03) | 0.22 (0.3) |
| Gaussian | 0.05 | 0.98 (0.99) | 0.002 (0.001) | 0.02 (0.008) | 0.07 (0.19) |
| Gaussian | 0.1 | 0.93 (0.96) | 0.008 (0.002) | 0.06 (0.03) | 0.15 (0.19) |
| Gaussian | 0.2 | 0.76 (0.86) | 0.03 (0.01) | 0.2 (0.13) | 0.29 (0.38) |
| CL () | 0.05 | 0.99 (0.99) | 0.002 (0.001) | 0.004 (0.003) | 0.06 (0.09) |
| CL () | 0.1 | 0.99 (0.99) | 0.006 (0.002) | 0.005 (0.008) | 0.1 (0.15) |
| CL () | 0.1 | 0.98 (0.96) | 0.006 (0.002) | 0.01 (0.03) | 0.12 (0.94) |
| CL () | 0.2 | 0.96 (0.97) | 0.03 (0.01) | 0.01 (0.02) | 0.17 (0.23) |
-
(a)
Probability of GW detection without an accompanying -ray signal.
-
(b)
Probability of detection of an on-axis sGRB given a GW detection.
-
(c)
Probability of detection of an off-axis sGRB given a GW detection.
-
(d)
Median value computed from joint -ray and GW detections.
3.2 Results
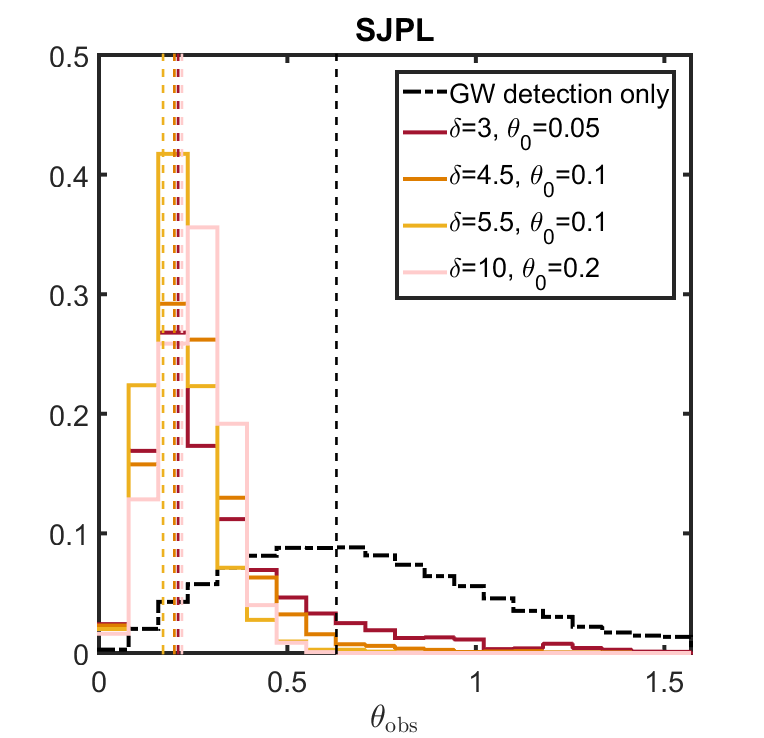
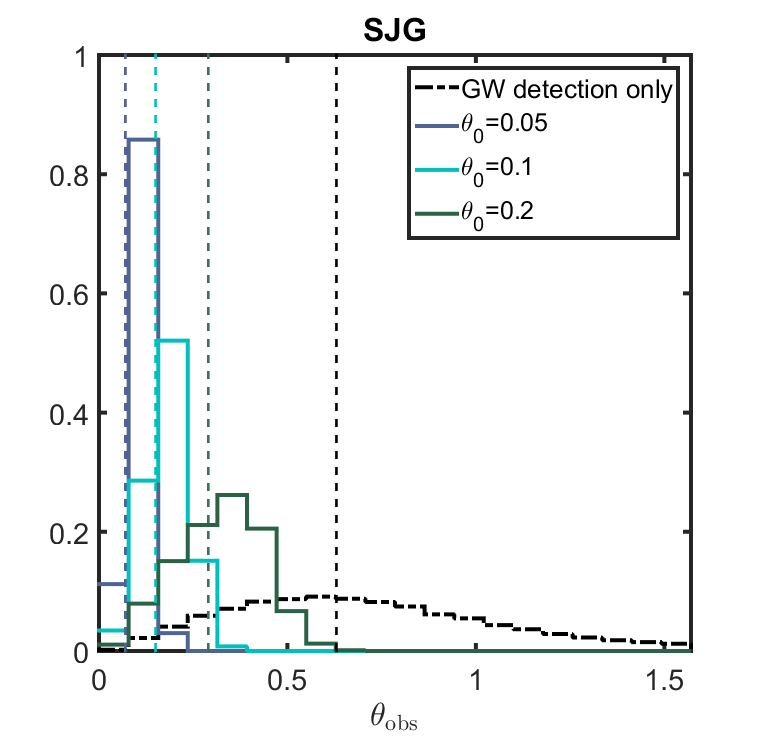
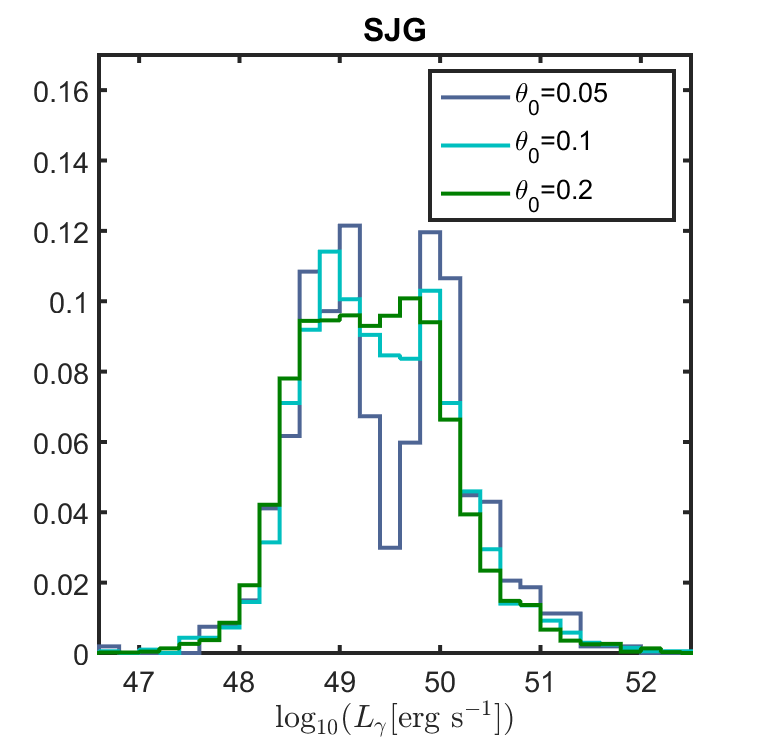
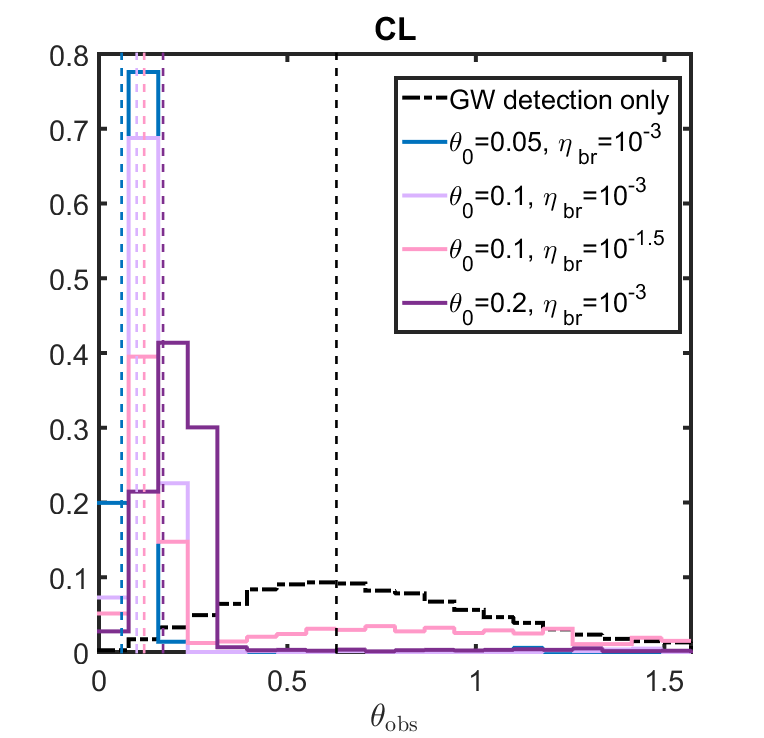
The distributions of observation angles and prompt luminosities of GRBs with joint -ray and GW detections are presented respectively in the left and right panels of Fig. 2 (solid lines). The dot-dashed histogram (left-hand side panels) shows the probability that a GW signal is detected for a given observation angle, as given by equation (14), i.e., independent of the detectability of the prompt GRB emission. The typical observation angle is slightly larger than , with the median values, , typically being in the range and approaching as the structure becomes steeper. This conclusion remains true even for the cocoon models explored here, due to their intrinsically weak emission. Only very radiatively efficient cocoon models, for which the cocoon is seen much more often than the on-axis GRB, may be seen much further off-axis. For example, for one would require in order to obtain . As a comparison, the typical observation angle of a GW detection alone is (see black vertical lines in the left-hand side panels of Fig. 2).
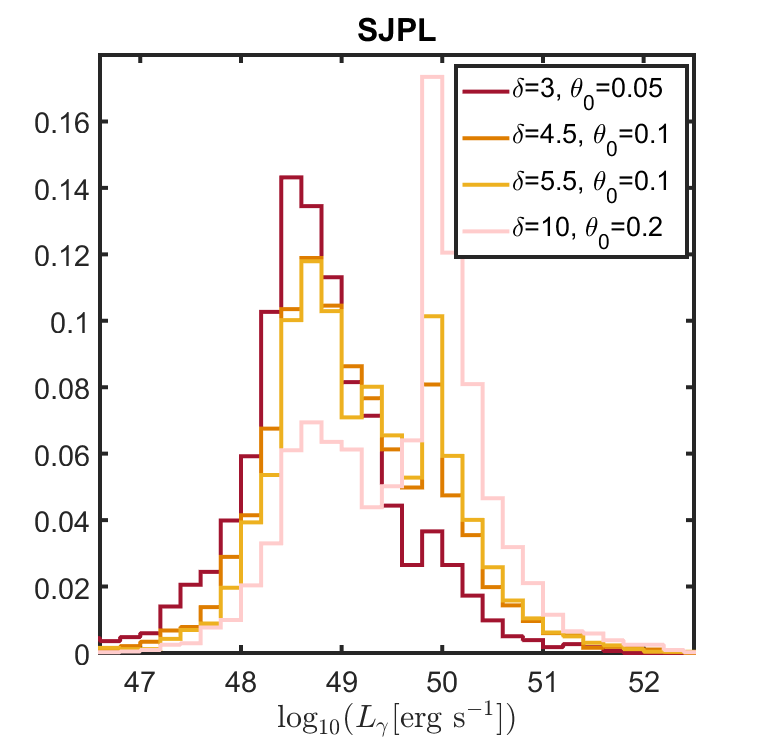
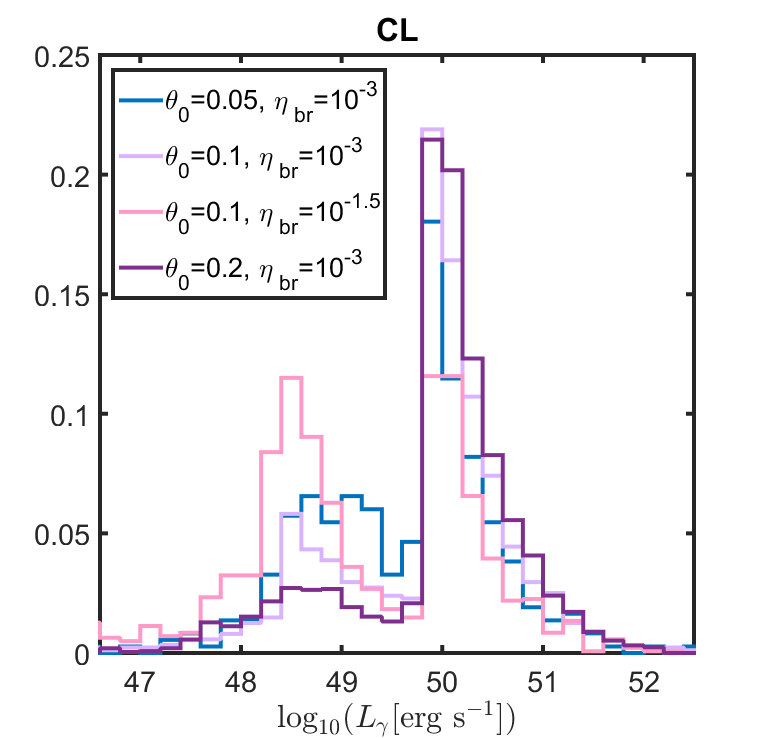
The luminosity distribution is typically double-peaked, with a high-luminosity peak corresponding to jets seen on-axis (peaking at ) and a low-luminosity peak corresponding mostly to off-axis jets (peaking at , for the SJPL and SJG models respectively. A smaller low luminosity peak is seen also for the CL model, this corresponds to the off line-of-sight contribution discussed in §3.1. The location of this peak in the figure is dominated by the -ray detectability threshold: where is the median distance of jointly detected events. A small contribution to the low-luminosity peak in the CL model, comes from the break-out luminosity of failed jets. The bi-modality is naturally more prominent for steeper structure models (see e.g. top right-hand side panel in Fig. 2) and becomes apparent when the two peaks discussed above are sufficiently separated. Gaussian structured-jet models produce symmetric bi-modal luminosity distributions for , while the two peaks merge into one for larger values (see middle right-hand side panel).
It is constructive to consider the likelihood of the three following outcomes: (i) no sGRB detection given a GW detection, (ii) a joint GW and a “regular” sGRB detection (), and (iii) a joint GW and misaligned sGRB detection (). The probabilities for the different models considered above and the median observation angles, given a joint detection, are presented in Table LABEL:tbl:prob. Excluding the SJG model with that is in contention with our results in §2.3 and with limits from GRB170817, the probability for a detection of GW from a NS merger without an accompanying -ray signal is very large in all models considered here (i.e., ). In the more rare case of a joint detection, the sGRB is typically 1 to 10 times more likely to be seen off-axis.
We explored also the effect of the limiting distance on the aforementioned probabilities. In most simulations we performed, we took as a canonical value Mpc, which as described above is the maximum distance to which NS mergers can be detected with near future GW detectors. A smaller limiting distance ( Mpc) has an interesting effect on the detectability of events (see Table LABEL:tbl:prob). While the fraction of events that can be detected electromagnetically increases as , the probability of a sGRB detection given a GW observation does not change significantly by switching from 220 Mpc to 50 Mpc. This can be understood as follows. The detectability of GWs becomes 100 for events with Mpc and the typical observation angle of a GW-detected event increases as decreases. Consequently, the probability of observing an on-axis sGRB actually goes down for smaller . Similar conclusions hold for any sGRB (not only on-axis), if the angular profile is very steep or its isotropic component is very dim.
GRB170817 could have been detected in -rays up to a distance of Mpc (Goldstein et al., 2017), but instead it occurred at a distance of Mpc. Moreover, the large inferred isotropic equivalent core luminosity in GRB170817 (Mooley et al., 2018b), which is roughly two orders of magnitude above those of typical sGRBs, suggests an accordingly luminous off-axis -ray emission. With a detection horizon of 220 Mpc, only a small fraction of future events are expected to exhibit similar properties to those of GRB170817. In models with a strong angular structure (e.g., SJPL models), bursts must be observed at small enough , so that there is still a significant amount of power in the material traveling towards the observer. This leads to a further reduction in the expected rate of future GRB170817 - like events.
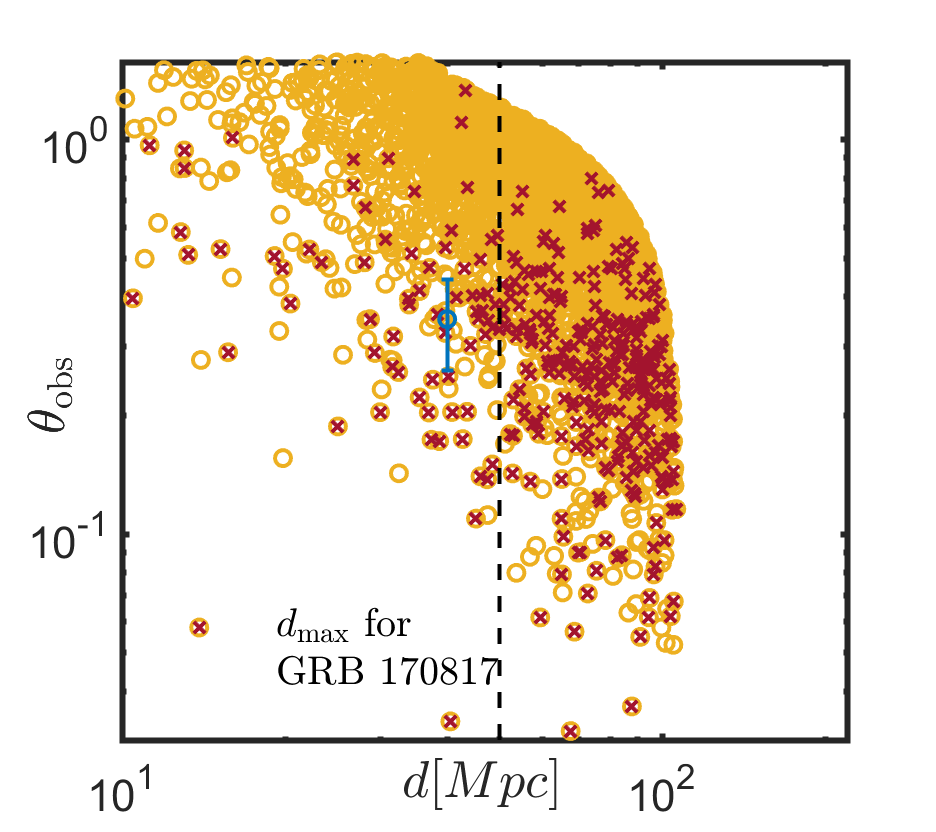
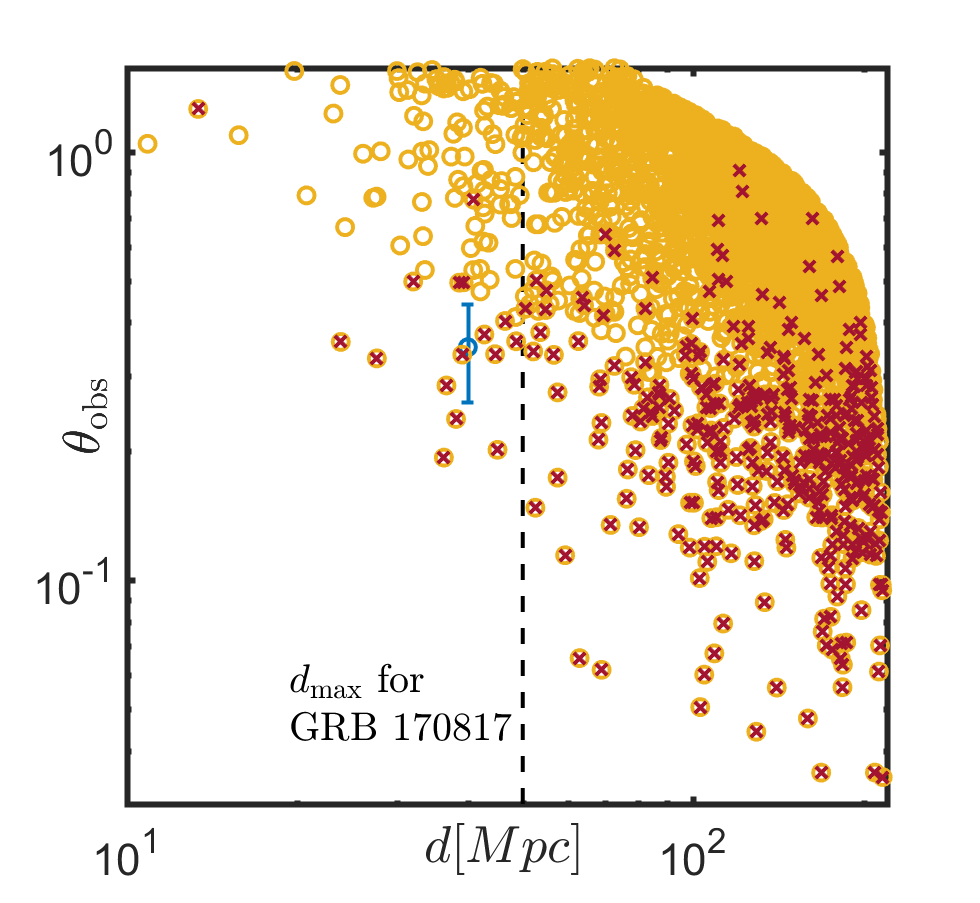
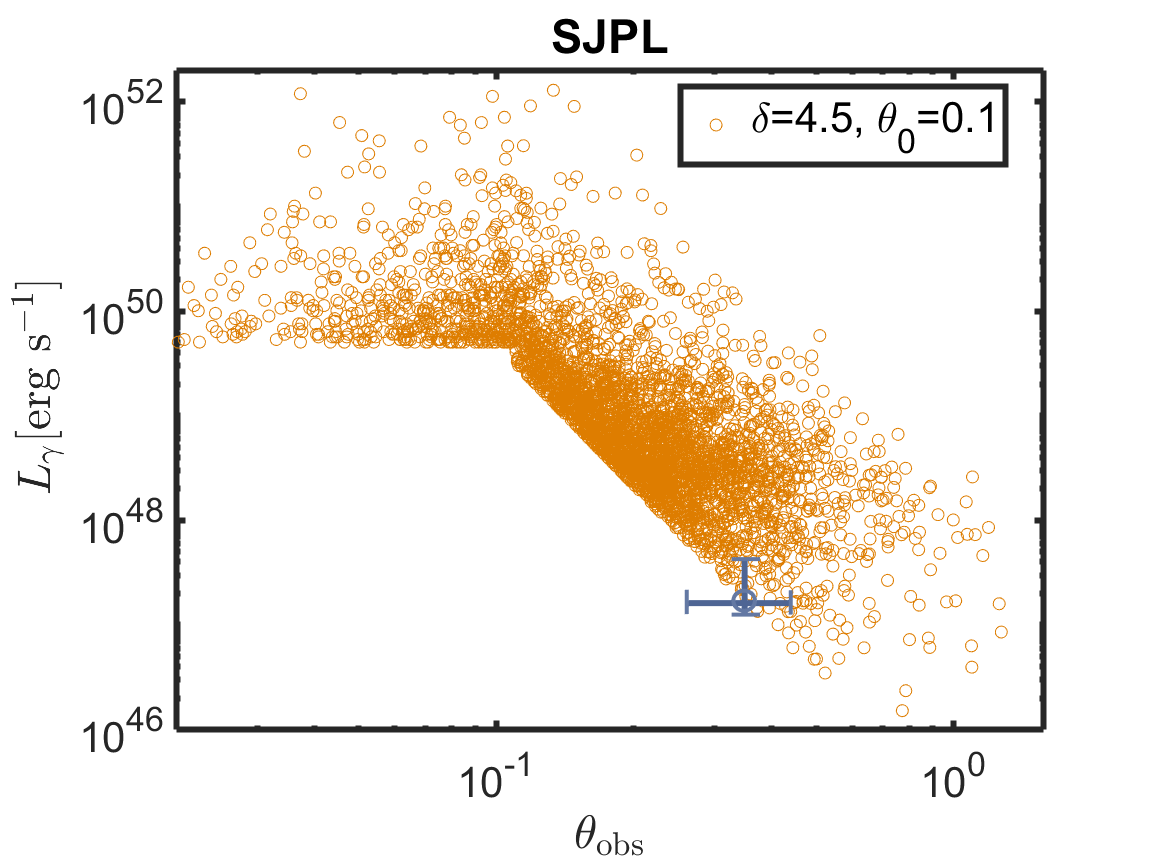
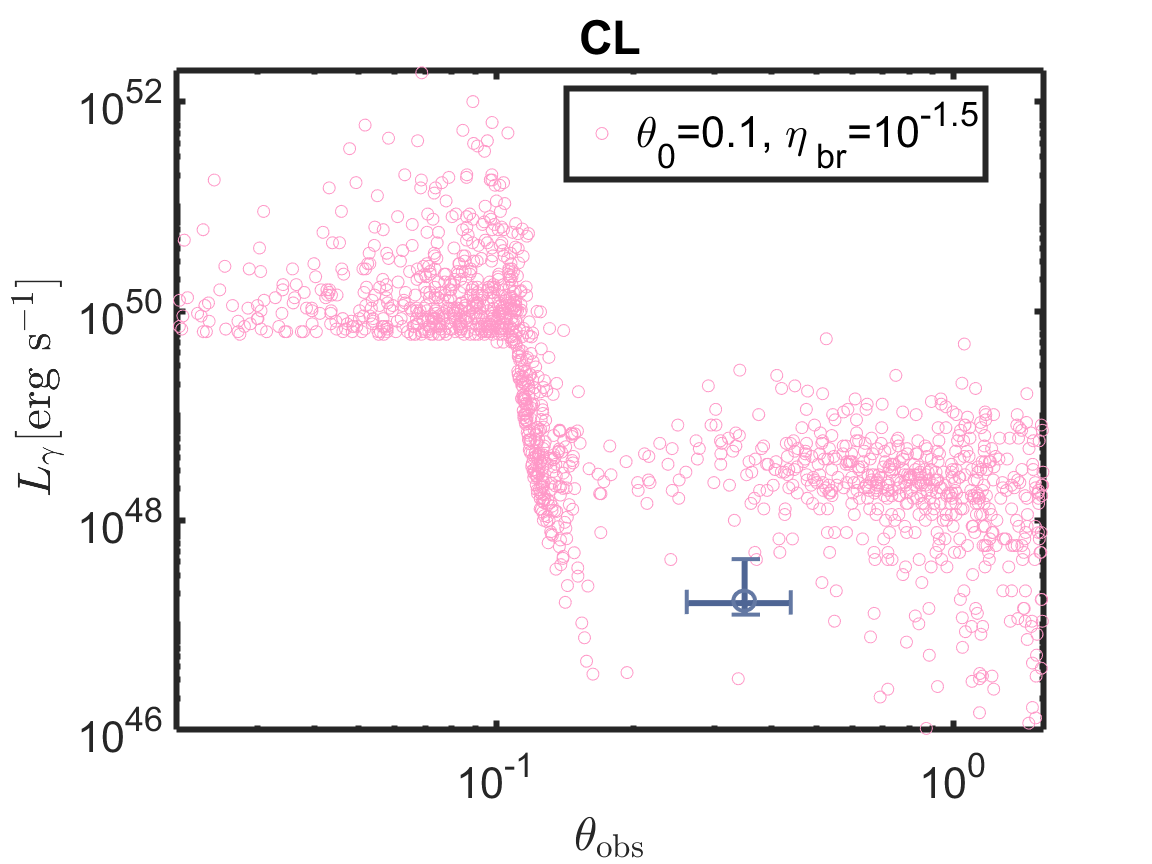
The effective LIGO horizon distance for the detection of GW170817 was 107 Mpc (Abbott et al., 2017b). Given a GW detection alone, we find that the probability of an event having (as inferred for GRB170817; see Mooley et al. 2018b) and occurring at a distance of Mpc is % (see also Lamb & Kobayashi 2017). This is demonstrated in figure 3 where we plot the observation angles and distances of events with joint -ray and GW detections (red crosses) from a simulation of SJPL model with and . Top and bottom panels show results for an effective GW horizon distance of 107 Mpc and 220 Mpc, respectively. The median distance of future joint detection events is Mpc and correspondingly the median GRB luminosity is . The fact that GRB170817 is an atypical event of the sample of expected joint prompt and GW detections is also illustrated in figure 4, where we present the expected distributions of joint detections for two models of prompt emission given a detection horizon of 220Mpc. For both models, the properties of GRB170817 (blue crosses) are not representative of the sample. Only and of the simulated events (jointly detected in -rays and GWs) in the CL and SJPL models, respectively, is found to have and erg s-1 erg s-1. The shape of the observed two-dimensional distributions is driven by the emission model, since the emission is typically dominated by material that is radiating within its beaming cone from the observer. A differentiation between the underlying emission models would require a sufficiently large number of joint GW and GRB detections (see also §5).
4 The cocoon emission
We estimate here the thermal energy stored in the cocoon, the fraction of it radiated in -rays at breakout and the cooling emission signature arising when the thermal cocoon eventually becomes optically transparent. The latter corresponds to a hours long UV signal, that may be detectable, provided sufficiently rapid localization of the NS merger.
The peak thermal energy stored in the cocoon (as a function of time) is found by Duffell et al. (2018). As mentioned above, here we assume that the that the injected opening angle is equal to the opening angle after breakout. Re-writing equations 10, 21 in Duffell et al. (2018) in a slightly different form, we obtain:
| (15) |
where erg and is the beaming corrected kinetic energy of the jet, . The peak thermal energy in equation (15) is reached at a time
| (16) |
where is the time it takes the jet to breakout from the ejecta. The thermal energy stored in the cocoon provides a strict upper limit on its radiated energy and luminosity. This is because the cocoon is expected to be initially optically thick, in which case only a small portion of the thermal energy, can escape to the observer (see Nakar & Sari 2010 and references therein). For GRB170817, the latest modelling efforts suggest a total (beaming corrected) energy of erg (Mooley et al., 2018b) which corresponds to erg. At the same time, cocoon breakout models for the prompt -rays radiate only erg at breakout (Gottlieb et al., 2017; Lazzati et al., 2017b), implying an efficiency of for this phase. In what follows we adopt as a canonical value.
The entire thermal energy is eventually released on the time-scale for which the medium reaches transparency . As an indicative example, let us consider a characteristic velocity for the cocoon ejecta of mass . Assuming that the kinetic energy of the cocoon is comparable to its thermal energy (Duffell et al., 2018) (), is estimated as:
| (17) | |||
where , and is the Thomson opacity (cross section per unit mass). For the adopted parameter values, we find that (see equation 16). This is consistent with the small efficiencies for the cocoon breakout luminosity, inferred for GW170817, as discussed above. The peak (isotropic equivalent) cocoon breakout luminosity can be approximated by using equations (15) and (16):
| (20) |
where is a numerical constant that is for and for . The spectrum of the cocoon is expected to be quasi-thermal (possibly following a Wien spectrum, see Gottlieb et al. 2017) with a characteristic temperature keV (where is the Lorentz factor of the material at the break-out shell). As more and more matter becomes transparent, the prompt luminosity released at breakout, evolves smoothly to the cooling signal described below. The exact temporal evolution depends on the velocity distribution of the material behind the break-out shell. Using the parameterization adopted above, we get (this can be shown by comparing equation 20 with equation 24 below) where and at later times depends on the shock profile (eventually reaching ).
The cocoon ejecta cools due to adiabatic energy losses until it becomes optically thin and the remaining energy is radiated away. This will happen when the time-scale for the diffusion of photons from the cocoon becomes comparable to the dynamical timescale. At this point, the cocoon radius is and the energy is given by:
| (21) | |||
where . This energy is radiated away on a time-scale of . The cooling luminosity associated with this phase is then given by:
| (24) | |||
Notice that the cooling luminosity is very sensitive to the velocity of the outflow (). Since this radiation is fully thermalized, and originates from a radius of , we can estimate its black body temperature as:
| (27) | |||
Therefore we expect the cooling emission from the cocoon to peak at the UV band (see also Nakar & Piran 2017). For a limiting Swift-UVOT B band flux of mJy in 1000 s (Gehrels, 2004), and the derived luminosities from equation (24) imply that this emission should be detectable for future NS merger events up to Mpc if and up to Mpc if . This of course, is provided that these events can be localized rapidly enough, in time to catch this signal (see also equation (17)). This can be a challenging prospect. As an example, the EM counterpart of GW170817, was only first detected days after the GW detection (Coulter et al., 2017).
| Model | parameters | Fermi undetected | on-axis | off-axis |
|---|---|---|---|---|
| PL | , | |||
| PL | , | |||
| PL | , | |||
| PL | , | |||
| GS | ||||
| GS | ||||
| GS | ||||
| CL | , | |||
| CL | , | |||
| CL | , | |||
| CL | , |
5 Discussion
The first discovery of GW from a NS merger allowed us to significantly improve our understanding of sGRB jets. Assuming all sGRBs arise from NS-NS (or NS-BH) mergers, the intrinsic rate of sGRBs should be at most comparable to the merger rate inferred by advanced LIGO/Virgo. This implies that if sGRB jets have a universal, luminosity independent structure, their typical opening angles should be (see §2.3). At the same time, the observed population of sGRBs with Swift in the last 14 years places a lower limit of Mpc on the distance from which we have observed an on-axis sGRB. This leads to an upper limit on the rate of local on-axis sGRBs and therefore on their typical opening angles . These limits on the opening angle are consistent with values inferred for GRB170817 from afterglow modelling and from the measurements of superluminal motion. Furthermore, they imply that the NS merger rate is comparable to that of sGRBs and reveals that a fraction of order unity of NS mergers must lead to sGRBs. In other words, sGRB jets typically manage to breakout of the NS-merger ejecta, in contrast to collapsar GRB jets.
The large fraction of successful sGRB jets and the typical opening angles of are consistent with a critical breakout luminosity (estimated from hydrodynamical simulations of the interaction between the sGRB jet and the NS merger ejecta) being close to the “canonically” assumed minimal luminosity of the sGRB luminosity function, namely . This consideration demonstrates that the role of failed jets in shaping the observed luminosity function of sGRBs cannot be significant (see §2.2.1). At the same time, we have also shown here that the angular structure of sGRBs is challenged to reproduce the observed luminosity function, given that the required structure is very shallow in contention with observational indications from GRB170817 (see §2.2.2). If this is the case, the implication is that the broken power-law luminosity function of sGRBs has an intrinsic origin and that the inferred break of the luminosity function, at an isotropic -ray luminosity of (corresponding to a beaming corrected jet mechanical power of ) reveals an intrinsic characteristic luminosity of sGRB jets. One possible interpretation that holds for magnetic jets, powered by the Blandford Znajek mechanism (Blandford & Znajek, 1977), is that the value of reflects a characteristic accretion rate, below which the accretion disk is advection dominated (ADAF), and above which it becomes dominated by neutrino cooling (NDAF) (Giannios, 2007). Indeed, Kawanaka, Piran & Krolik (2013) have shown that a sharp change in the jet power may occur due to this transition at accretion rates , consistent with the beaming corrected jet luminosity mentioned above, assuming .
While the joint discovery of GW170817 and GRB170817 has helped to constrain the fraction of successful GRB jets, their opening angles, and their luminosity function as discussed above, the angular structure of GRB jets and the nature of their -ray emission are still uncertain. In this paper, we considered different off-axis emission models, motivated by the analysis above and by observations of GRB170817. We showed that of future GW events accompanied by a successful GRB jet and detected up to a distance of Mpc, should not be accompanied by any detectable prompt GRB signal. In the comparatively rare cases of a joint GRB and GW detections, we find that for each GRB observed on-axis GRBs should be observed at angles beyond the jet core.
The distribution of prompt luminosities and observation angles from joint GRB and GW detections can help to distinguish between off-axis prompt emission models (see figure 4). For example, let us assume a NS merger rate of , a ratio of failed to successful GRB jets , and . Then, angular structure models with and lead to GW detectable mergers per year (up to 220 Mpc), out of which without Fermi/GBM -ray detection, 0.1 with an on-axis GRB detection, and 1.1 with an off-axis GRB detection. Alternatively, for cocoon models with a breakout efficiency of (and ), we have events per year with no accompanying GRB, and 0.1 with on-axis or off-axis GRBs. Table LABEL:tbl:number summarizes the expected number of events within a period of ten years for the emission models discussed in §3.1. Inspection of the table shows that the detection rates of off-axis GRBs accompanying GW-detected mergers are the key for differentiating between the models. For example, the lack of any other prompt GRB detections from NS mergers within the next 10 years (for the assumed parameters), would be in strong tension with the predictions of the structured jet model. The thermal energy in the cocoon may also be observed via its cooling emission that is expected to lead to a UV thermal signal at s after the trigger (see equations (17) and (24)). Provided that the NS merger can be located rapidly enough, the cooling emission of the cocoon may be detectable up to a distance of Mpc. It turns out that events similar to GRB170817 are rare. This is a combination of the small distance and observation angle of GRB170817 and the high inferred luminosity at the core of that event compared to typical sGRBs.
In conclusion, the discovery of the first GRB associated with a NS merger, GRB170817, has already significantly improved our knowledge of short GRB jets. Nonetheless, the nature of the prompt signal that is seen by observers far from the jet cores remains unclear. The association of a -ray signal with a GW event could allow us to detect orders of magnitude fainter signals associated with GRBs, which would otherwise be undetected for cosmological events (see also Beniamini et al., 2018). This, coupled with the relatively large detection rate of NS mergers as inferred from GW170817, implies that the existing models could be differentiated observationally within the next several years, opening up the window towards a more detailed understanding and future studies of short GRB jets.
Acknowledgments
The authors would like to thank the referee for a constructive report, and Tsvi Piran, Ehud Nakar, Pawan Kumar, Omer Bromberg and Kenta Hotokezaka for helpful discussions. RBD thanks Danielle Taylor for useful discussions. MP acknowledges support from the Lyman Jr. Spitzer Postdoctoral Fellowship and NASA grant 80NSSC18K1745. DG acknowledges support from NASA grants NNX16AB32G and NNX17AG21G. RBD and DG acknowledge support from the National Science Foundation under Grants 1816694 and 1816136.
References
- Abbott et al. (2017a) Abbott B. P. et al., 2017a, ApJ, 848, L13
- Abbott et al. (2017b) Abbott B. P. et al., 2017b, Physical Review Letters, 119, 161101
- Allen et al. (2012) Allen B., Anderson W. G., Brady P. R., Brown D. A., Creighton J. D. E., 2012, Phys. Rev. D, 85, 122006
- Aloy, Janka & Müller (2005) Aloy M. A., Janka H.-T., Müller E., 2005, A&A, 436, 273
- Band et al. (1993) Band D. et al., 1993, ApJ, 413, 281
- Barkov et al. (2018) Barkov M. V., Kathirgamaraju A., Luo Y., Lyutikov M., Giannios D., 2018, ArXiv e-prints
- Beniamini, Dvorkin & Silk (2018) Beniamini P., Dvorkin I., Silk J., 2018, MNRAS, 478, 1994
- Beniamini et al. (2018) Beniamini P., Giannios D., Younes G., van der Horst A. J., Kouveliotou C., 2018, MNRAS, 476, 5621
- Beniamini, Hotokezaka & Piran (2016) Beniamini P., Hotokezaka K., Piran T., 2016, ApJ, 832, 149
- Beniamini & Nakar (2019) Beniamini P., Nakar E., 2019, MNRAS, 482, 5430
- Beniamini et al. (2015) Beniamini P., Nava L., Duran R. B., Piran T., 2015, MNRAS, 454, 1073
- Beniamini, Nava & Piran (2016) Beniamini P., Nava L., Piran T., 2016, MNRAS, 461, 51
- Blandford & Znajek (1977) Blandford R. D., Znajek R. L., 1977, MNRAS, 179, 433
- Blinnikov et al. (1984) Blinnikov S. I., Novikov I. D., Perevodchikova T. V., Polnarev A. G., 1984, Soviet Astronomy Letters, 10, 177
- Bromberg et al. (2011) Bromberg O., Nakar E., Piran T., Sari R., 2011, ApJ, 740, 100
- Bromberg et al. (2018) Bromberg O., Tchekhovskoy A., Gottlieb O., Nakar E., Piran T., 2018, MNRAS, 475, 2971
- Burns et al. (2016) Burns E., Connaughton V., Zhang B.-B., Lien A., Briggs M. S., Goldstein A., Pelassa V., Troja E., 2016, ApJ, 818, 110
- Coulter et al. (2017) Coulter D. A. et al., 2017, Science, 358, 1556
- Coward et al. (2012) Coward D. M. et al., 2012, MNRAS, 425, 2668
- Duffell et al. (2018) Duffell P. C., Quataert E., Kasen D., Klion H., 2018, ApJ, 866, 3
- Eichler & Levinson (2004) Eichler D., Levinson A., 2004, ApJ, 614, L13
- Eichler et al. (1989) Eichler D., Livio M., Piran T., Schramm D. N., 1989, Nature, 340, 126
- Finstad et al. (2018) Finstad D., De S., Brown D. A., Berger E., Biwer C. M., 2018, ApJ, 860, L2
- Fong et al. (2015) Fong W., Berger E., Margutti R., Zauderer B. A., 2015, ApJ, 815, 102
- Fraija et al. (2017) Fraija N., De Colle F., Veres P., Dichiara S., Barniol Duran R., Galvan-Gamez A., 2017, ArXiv e-prints
- Frail et al. (2001) Frail D. A. et al., 2001, ApJ, 562, L55
- Gehrels (1986) Gehrels N., 1986, ApJ, 303, 336
- Gehrels (2004) Gehrels N., 2004, in American Institute of Physics Conference Series, Vol. 727, Gamma-Ray Bursts: 30 Years of Discovery, Fenimore E., Galassi M., eds., pp. 637–641
- Ghirlanda et al. (2016) Ghirlanda G. et al., 2016, A&A, 594, A84
- Giannios (2007) Giannios D., 2007, ArXiv e-prints
- Goldstein et al. (2017) Goldstein A. et al., 2017, ApJ, 848, L14
- Goodman (1986) Goodman J., 1986, ApJ, 308, L47
- Gottlieb et al. (2017) Gottlieb O., Nakar E., Piran T., Hotokezaka K., 2017, ArXiv e-prints
- Granot et al. (2017) Granot J., Gill R., Guetta D., De Colle F., 2017, ArXiv e-prints
- Granot, Guetta & Gill (2017) Granot J., Guetta D., Gill R., 2017, ApJ, 850, L24
- Granot & Kumar (2003) Granot J., Kumar P., 2003, ApJ, 591, 1086
- Granot & Ramirez-Ruiz (2010) Granot J., Ramirez-Ruiz E., 2010, ArXiv e-prints
- Guetta & Piran (2006) Guetta D., Piran T., 2006, A&A, 453, 823
- Guetta & Stella (2009) Guetta D., Stella L., 2009, A&A, 498, 329
- Hilborn (2018) Hilborn R. C., 2018, ArXiv e-prints
- Hotokezaka, Beniamini & Piran (2018) Hotokezaka K., Beniamini P., Piran T., 2018, International Journal of Modern Physics D, 27, 1842005
- Hotokezaka et al. (2013) Hotokezaka K., Kiuchi K., Kyutoku K., Okawa H., Sekiguchi Y.-i., Shibata M., Taniguchi K., 2013, Phys. Rev. D, 87, 024001
- Hotokezaka et al. (2018) Hotokezaka K., Kiuchi K., Shibata M., Nakar E., Piran T., 2018, ArXiv e-prints
- Hotokezaka, Piran & Paul (2015) Hotokezaka K., Piran T., Paul M., 2015, Nature Physics, 11, 1042
- Ioka & Nakamura (2018) Ioka K., Nakamura T., 2018, Progress of Theoretical and Experimental Physics, 2018, 043E02
- Janka et al. (2006) Janka H.-T., Aloy M.-A., Mazzali P. A., Pian E., 2006, ApJ, 645, 1305
- Ji et al. (2016) Ji A. P., Frebel A., Chiti A., Simon J. D., 2016, Nature, 531, 610
- Kasen et al. (2017) Kasen D., Metzger B., Barnes J., Quataert E., Ramirez-Ruiz E., 2017, Nature, 551, 80
- Kasliwal et al. (2017) Kasliwal M. M. et al., 2017, Science, 358, 1559
- Kathirgamaraju, Barniol Duran & Giannios (2018) Kathirgamaraju A., Barniol Duran R., Giannios D., 2018, MNRAS, 473, L121
- Kawanaka, Piran & Krolik (2013) Kawanaka N., Piran T., Krolik J. H., 2013, ApJ, 766, 31
- Kim, Perera & McLaughlin (2015) Kim C., Perera B. B. P., McLaughlin M. A., 2015, MNRAS, 448, 928
- Kochanek & Piran (1993) Kochanek C. S., Piran T., 1993, ApJ, 417, L17
- Kouveliotou et al. (1993) Kouveliotou C., Meegan C. A., Fishman G. J., Bhat N. P., Briggs M. S., Koshut T. M., Paciesas W. S., Pendleton G. N., 1993, ApJ, 413, L101
- Lamb & Kobayashi (2017) Lamb G. P., Kobayashi S., 2017, MNRAS, 472, 4953
- Lattimer & Schramm (1974) Lattimer J. M., Schramm D. N., 1974, ApJ, 192, L145
- Lattimer & Schramm (1976) Lattimer J. M., Schramm D. N., 1976, ApJ, 210, 549
- Lazzati et al. (2017a) Lazzati D., Deich A., Morsony B. J., Workman J. C., 2017a, MNRAS, 471, 1652
- Lazzati et al. (2017b) Lazzati D., López-Cámara D., Cantiello M., Morsony B. J., Perna R., Workman J. C., 2017b, ApJ, 848, L6
- Lazzati et al. (2018) Lazzati D., Perna R., Morsony B. J., Lopez-Camara D., Cantiello M., Ciolfi R., Giacomazzo B., Workman J. C., 2018, Physical Review Letters, 120, 241103
- Lipunov, Postnov & Prokhorov (2001) Lipunov V. M., Postnov K. A., Prokhorov M. E., 2001, Astronomy Reports, 45, 236
- Lu et al. (2017) Lu R.-J., Du S.-S., Cheng J.-G., Lü H.-J., Zhang H.-M., Lan L., Liang E.-W., 2017, ArXiv e-prints
- Macias & Ramirez-Ruiz (2016) Macias P., Ramirez-Ruiz E., 2016, ArXiv e-prints
- Margutti et al. (2018) Margutti R. et al., 2018, ApJ, 856, L18
- Moharana & Piran (2017) Moharana R., Piran T., 2017, MNRAS, 472, L55
- Mooley et al. (2018a) Mooley K. P. et al., 2018a, Nature, 561, 355
- Mooley et al. (2018b) Mooley K. P. et al., 2018b, Nature, 554, 207
- Murguia-Berthier et al. (2014) Murguia-Berthier A., Montes G., Ramirez-Ruiz E., De Colle F., Lee W. H., 2014, ApJ, 788, L8
- Nagakura et al. (2014) Nagakura H., Hotokezaka K., Sekiguchi Y., Shibata M., Ioka K., 2014, ApJ, 784, L28
- Nakar & Piran (2017) Nakar E., Piran T., 2017, ApJ, 834, 28
- Nakar & Sari (2010) Nakar E., Sari R., 2010, ApJ, 725, 904
- Nava et al. (2011) Nava L., Ghirlanda G., Ghisellini G., Celotti A., 2011, A&A, 530, A21
- Paczynski (1986) Paczynski B., 1986, ApJ, 308, L43
- Patricelli et al. (2016) Patricelli B., Razzano M., Cella G., Fidecaro F., Pian E., Branchesi M., Stamerra A., 2016, JCAP, 11, 056
- Pescalli et al. (2015) Pescalli A., Ghirlanda G., Salafia O. S., Ghisellini G., Nappo F., Salvaterra R., 2015, MNRAS, 447, 1911
- Petropoulou, Barniol Duran & Giannios (2017) Petropoulou M., Barniol Duran R., Giannios D., 2017, MNRAS, 472, 2722
- Pooley et al. (2018) Pooley D., Kumar P., Wheeler J. C., Grossan B., 2018, ApJ, 859, L23
- Racusin et al. (2017) Racusin J. L. et al., 2017, ApJ, 835, 82
- Rossi, Lazzati & Rees (2002) Rossi E., Lazzati D., Rees M. J., 2002, MNRAS, 332, 945
- Salvaterra et al. (2008) Salvaterra R., Cerutti A., Chincarini G., Colpi M., Guidorzi C., Romano P., 2008, MNRAS, 388, L6
- Schutz (2011) Schutz B. F., 2011, Classical and Quantum Gravity, 28, 125023
- Sobacchi et al. (2017) Sobacchi E., Granot J., Bromberg O., Sormani M. C., 2017, MNRAS, 472, 616
- Tanaka et al. (2017) Tanaka M. et al., 2017, PASJ, 69, 102
- Tanvir et al. (2017) Tanvir N. R. et al., 2017, ApJ, 848, L27
- Troja et al. (2018) Troja E. et al., 2018, MNRAS, 478, L18
- van Eerten et al. (2018) van Eerten E. T. H., Ryan G., Ricci R., Burgess J. M., Wieringa M., Piro L., Cenko S. B., Sakamoto T., 2018, ArXiv e-prints
- van Eerten & MacFadyen (2012) van Eerten H. J., MacFadyen A. I., 2012, ApJ, 751, 155
- Wanderman & Piran (2010) Wanderman D., Piran T., 2010, MNRAS, 406, 1944
- Wanderman & Piran (2015) Wanderman D., Piran T., 2015, MNRAS, 448, 3026
- Zhang & Mészáros (2002) Zhang B., Mészáros P., 2002, ApJ, 571, 876
- Zhang et al. (2018) Zhang B.-B. et al., 2018, Nature Communications, 9, 447