Early formation of carbon monoxide in the Centaurus A supernova SN 2016adj
Abstract
We present near-infrared spectroscopy of the NGC 5128 supernova SN 2016adj in the first 2 months following discovery. We report the detection of first overtone carbon monoxide emission at d after discovery, one of the earliest detections of CO in an erupting supernova. We model the CO emission to derive the CO mass, temperature and velocity, assuming both pure 12CO and a composition that includes 13CO; the case for the latter is the isotopic analyses of meteoritic grains, which suggest that core collapse supernovae can synthesise significant amounts of 13C. Our models show that, while the CO data are adequately explained by pure 12CO, they do not preclude the presence of 13CO, to a limit of 12C/13C, the first constraint on the 12C/13C ratio determined from near-infrared observations. We estimate the reddening to the object, and the effective temperature from the energy distribution at outburst. We discuss whether the ejecta of SN 2016adj may be carbon-rich, what the infrared data tell us about the classification of this supernova, and what implications the early formation of CO in supernovae may have for CO formation in supernovae in general.
keywords:
infrared: stars — supernovae: general — (stars:) supernovae: individual (SN 2016adj) — techniques: spectroscopic1 Introduction
Stars with mass greater than 8 M⊙ end their lives as core-collapse supernovae (CC SNe). SNe coming from stars that retain most of their massive hydrogen envelopes until they explode are classified as Type II, whereas SNe resulting from stars that had lost their H envelopes before they collapsed are called stripped envelope CC SNe (see Clocchiatti et al., 1996; Fillipenko, 1997). The loss of the envelope is believed to be due either to stellar winds, or to interaction with a companion star (e.g. Smith et al., 2011). CC SNe progenitors with only small amounts of hydrogen remaining in their outer envelopes explode as SNe IIb, a classification so-named because their spectra undergo a transition from Type II at early times to Type Ib at late times. There is a further sub-division depending on whether the He envelope was still present (Type Ib) or if it had been lost (Type Ic).
The large quantities of dust observed in high-redshift galaxies raises the fundamental astrophysical question of the origin of dust in the Universe (e.g. Isaak et al., 2002; Bertoldi et al., 2003; Gall, Hjorth & Andersen, 2011). Whether SNe are a significant source of dust has been a long-standing debate. In the local Universe it is known that the bulk of observed dust originates in evolved, low-mass stars (see e.g. Gehrz, 1989; Sarangi, Matsuura & Micelotta, 2018). However, this can not be the case for the copious amount of dust seen in high-redshift galaxies, as low-mass stars will not have had time to evolve to the dust-producing stage. On the other hand the SN explosion of massive stars can occur within a few millions of years after the onset of star formation, suggesting that SNe must be a significant source of dust in the early Universe. Support for this view comes from the fact that four young Local Group SN remnants, SN 1987A (Matsuura et al., 2011, 2015), the Crab Nebula (Gomez et al., 2012), Cas A (de Looze et al., 2017) and G54.1+0.3 (Temim et al., 2017; Rho et al., 2018a) have dust masses of M⊙. These results reinforce the conclusion that SNe are important dust factories in the local Universe, and must be so at high redshift.
The formation of small molecules such as carbon monoxide (CO) is a necessary prerequisite for dust formation and indeed, CO is one of the most powerful coolants in the ejecta of Type II SNe. The outcomes of dust evolution models depend on CO destruction processes, including impact by the energetic electrons produced by the radioactive decay of 56Co, and microscopic mixing of He+ (Cherchneff & Dwek, 2010).
However, detections of first overtone CO emission in SNe are limited in number, while the fundamental band – for which the transition rates are higher than the first overtone – has been observed only in SN 1987A from the ground (Meikle et al., 1989; Catchpole et al., 1988), from the Kuiper Airborne Observatory (Wooden et al., 1993), and in a small number of objects using the Spitzer Space Telescope (e.g. Kotak et al., 2005, 2006; Meikle et al., 2006, 2007; Fox et al., 2010). The detection of CO first overtone and fundamental bands in the SN remnant Cas A (Rho et al., 2009, 2012), which Rho et al. conclude was formed in an earlier phase of the SN explosion, suggests that astrochemical processes and molecule formation may continue at least yr after the initial explosion, albeit in different environments.
In this paper we present near-IR (NIR) spectroscopic observations of the CC SN 2016adj. The observations are at high temporal cadence and moderate () spectral resolution, and provide an exceptional record of the early development of the IR spectrum of an erupting SN. Furthermore, our data enable us to report one of the earliest detections of first overtone CO emission in an erupting SN. In the past the Mt Abu group has worked extensively on NIR studies of classical novae, a major result of which has been the early detection of CO emission and dust formation in novae. Because of the modest size of the telescope (1.2 m), NIR spectroscopy of SNe is generally not possible unless the erupting SN is sufficiently bright in the NIR and likely to remain so as CO and dust formation occur. SN 2016adj was bright in the NIR at outburst ( mag; Srivastava, Banerjee & Ashok, 2016) and early reports indicated it to be a CCSN, many of which – as discussed below – progress to show CO emission and dust formation. This made SN 2016adj a potentially interesting candidate to monitor at Mt Abu. The advantage of an institutional telescope that permits high-cadence observations also provided the potential to catch an early formation of either CO or dust.
2 CO and dust formation in supernovae
CO emission in an erupting supernova was first seen (at days after the explosion) in SN 1987A (Catchpole & Glass, 1987; McGregor & Hyland, 1987; Meikle et al., 1989; Catchpole et al., 1988; Olivia, Moorwood & Danziger, 1987; Spyromilio et al., 1988). The SiO fundamental at m was also observed, by Roche, Aitken & Smith (1993).
In SN 1987A CO emission was seen to be at temperatures (2000 K) below those of the atomic species, and at velocities (2000 km s-1) that were also lower than the velocities of some of the metals (Liu et al., 1992, and references therein). These observations placed the CO and SiO deep inside the ejecta, and imposed constraints on the mixing of the ejecta and the shielding of the molecules from ultraviolet (UV) radiation that would otherwise destroy them.
Since then first overtone CO emission has been observed in a number of Type II SNe, for example SN 1995ad (Spyromilio & Leibundgut, 1996), SN 1998S (Gerardy et al., 2000; Fassia et al., 2001), SNe 1998dl and 1999em (Spyromilio et al., 2001) and Type IIb SN 2011dh (Ergon et al., 2015). Detections of CO in Type Ic have been made in SN 2000ew (Gerardy et al., 2002), SN 2007gr (Hunter et al., 2009) and the Type Ib/c SN 2013ge (Drout et al., 2016). The earliest detection to date of first overtone CO emission was in SN 2013ge at +48 d after (max) (58.9 d after discovery), by Drout et al. (2016).
CO plays a vital role in dust formation because of its formidable cooling capacity, by emission in the fundamental band at 4.7m and first overtone bands at 2.29m. Molecule formation in the early phase of the eruption is conditional on them being shielded from the UV radiation field (Lepp, Dalgarno & McCray, 1990) and therefore a degree of clumping in the ejecta is required. These clumps cool down faster than the surroundings and are likely sites of dust condensation. Models of CO formation predict that the CO abundance should decrease from days to days (Cherchneff & Lilly, 2008; Lazzati & Heger, 2016) for fully mixed case, and that as CO mass decreases, carbon dust forms.
After only 500 days, there were three cardinal indications that SN 1987A had produced a signifcant amount of dust in its ejecta. These were the extinction of the red wings of the line profiles by dust obscuration, a downward transition in the light curves – similar to that seem in the light curves of dust-forming novae – and the production of significant thermal infrared (IR) emission from the dust (Gehrz & Ney, 1990; Lucy et al., 1991; Wooden et al., 1993). As the SN aged and cooled, the molecular emission in the IR vanished.
About 0.4–0.7 M⊙ of dust was detected at the location of SN 1987A by Matsuura et al. (2011, 2015) at an age of 8500 days (23.5 years after the eruption) using the Herschel Space Observatory, and were localised in the ejecta of the SN using the Atacama Large Millimetre Array (ALMA) by Indebetouw et al. (2014). Kamenetzky et al. (2013), using ALMA and Herschel data, reported emission from CO and SiO rotational transitions arising in material moving at velocities comparable to those detected in the early data.
3 Supernova SN 2016adj
SN 2016adj was discovered by Marples, Bock & Parker (2016) on 2016 February 8.56 UT at ; the SN was not present in an image taken by them on 2016 February 3, to a limiting magnitude of . NIR photometry, obtained within a day of discovery (Srivastava et al., 2016), revealed a highly reddened object.
Since all post-discovery optical and magnitudes show the SN to fade further (Kiyota et al., 2016; Stritzinger et al., 2016) compared to its discovery magnitude, optical maximum was reached in the period 2016 February 3–8.56. While it is ideally desirable to consistently measure all elapsed time intervals with respect to (for example) (max) or (max) – so that the evolution of SNe may be directly compared – these are poorly constrained and instead, we use here the date of discovery as the origin of time.
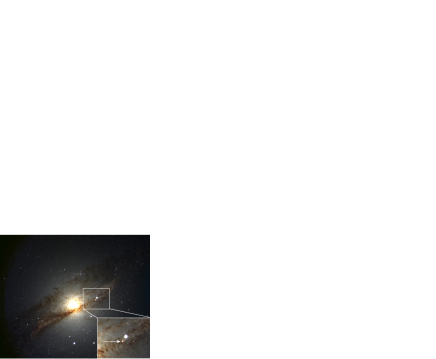
SN 2016adj lies on the central dust lane of the nearby Sy2 galaxy NGC 5128 (Centaurus A; ; SIMBAD111http://simbad.u-strasbg.fr/simbad/) in the north-west direction (see Fig. 1). NGC 5128, an iconic object in itself, was also host to the bright Type Ia SN (SN 1986G) which occurred in the south-west part of the dust lane.
SN 2016adj has been the subject of considerable interest, with reports of special note being those identifying the progenitor star from HST archival images, high-resolution ground based images (Van Dyk et al., 2016; Sugarman & Lawrence, 2016a), and the detection of a light echo (Sugarman & Lawrence, 2016b). Hounsell et al. (2016) estimate an expansion velocity km s-1 from He i 5876Å, 6678Å lines.
There has been some uncertainty regarding the classification of SN 2016adj. While consensus seems to lean towards Type IIb, reports have variously suggested it as Type II (Yi et al., 2016), Type Ib (Stritzinger et al., 2016), Type IIb (Hounsell et al., 2016; Thomas et al., 2016). It is classified as IIb by Holoien et al. (2017) and we assume this classification here (see also Section 7.2). Being a bright SN at outburst, we anticipate that it would have been extensively observed, and that a light curve should become available in due course which will help classify the object more robustly. This will also place our results and new knowledge in a better context.
The supernova is located at RA 13h 25m 2411, Dec 5750 (J2000) with a foreground 2MASS (Strutskie et al., 2006) star (2MASS 13252458–4300485) situated close to, and NW of, the supernova (see Fig. 1). SN 2016adj is heavily reddened (see Yang et al., 2016, and references therein). Yang et al. note the presence of “Diffuse Interstellar Bands” – commonly associated with interstellar dust – in the optical spectrum of SN 2016adj, and that emission from the SN is strongly polarised; they also attribute the latter to significant reddening in the host galaxy.
| UT | JD + | Days after | IT() | IT() | IT() | Airmass | Airmass | Observatory |
| YYYYMMDD | 2457400 | discoverya | (s) | (s) | (s) | (SN 2016adj) | Std.b | |
| 20160210 | 28.51 | 1.45 | 760 | 760 | 760 | 2.744 | 2.707 | Mount Abu |
| 20160216 | 34.45 | 6.39 | 760 | 760 | 760 | 2.613 | 2.623 | ” |
| 20160217 | 35.46 | 7.40 | 760 | 760 | 760 | 2.622 | 2.649 | ” |
| 20160221 | 39.43 | 11.37 | 760 | 760 | 760 | 2.626 | 2.651 | ” |
| 20160222 | 40.45 | 12.39 | 760 | 760 | 760 | 2.625 | 2.619 | ” |
| 20160223 | 41.45 | 13.39 | 760 | 760 | 760 | 2.626 | 2.620 | ” |
| 20160229 | 47.46 | 19.40 | 380 | 380 | 380 | 2.803 | 2.891 | ” |
| 20160302 | 49.44 | 21.38 | 1330 | 1330 | 1520 | 2.684 | 2.638 | ” |
| 20160311 | 58.37 | 30.31 | — | — | 1140 | 2.631 | 2.616 | ” |
| 20160312 | 59.42 | 31.36 | 1520 | 1330 | 1520 | 2.718 | 2.663 | ” |
| 20160313 | 60.40 | 32.34 | 950 | 760 | 760 | 2.647 | 2.632 | ” |
| 20160325 | 72.38 | 44.32 | 1140 | 2470 | — | 2.712 | 2.624 | ” |
| 20160327 | 74.37 | 46.31 | — | — | 760 | 2.678 | 2.647 | ” |
| 20160407 | 86.27 | 58.21 | 760 | 760 | — | 2.798 | 2.867 | ” |
| 20160409 | 87.34 | 59.28 | — | — | 2090 | 2.720 | 2.793 | ” |
| 20160410 | 88.30 | 60.24 | 760 | 760 | 1900 | 2.618 | 2.630 | ” |
| 20160414 | 92.39 | 64.24 | 1912c | 2.273 | 2.247 | IRTF | ||
| (a) Date of discovery = 2016 February 08.56 UT = JD 2457427.063. | ||||||||
| (b) The standard star for the IRTF observations was HD 119430, for Mt Abu SAO 224089. | ||||||||
| (c) Integration time (IT) for the entire spectrum. | ||||||||
4 Observations
4.1 Mt Abu
NIR spectroscopy in the 0.85 to 2.4m region, at resolution , was carried out with the 1.2 m telescope of the Mount Abu Infrared Observatory (Banerjee & Ashok, 2012) using the Near-Infrared Camera/Spectrograph equipped with a HgCdTe Hawaii array. SN 2016adj, at a declination of S, is a challenging target from Mt. Abu (latitude 24.5∘N) because the target never rises above during observations.
Spectra were recorded with the star dithered to two positions along the slit, with one or more spectra being recorded in both of these positions. The coadded spectra in the respective dithered positions were subtracted from each other to remove sky and dark contributions. The spectra from these sky-subtracted images were extracted and wavelength calibrated using a combination of OH sky lines and telluric lines that register with the stellar spectra. To remove telluric lines from the target’s spectra, the latter was ratioed with the spectral standard SAO 224089 (Sp. type A3V, K), from whose spectra the hydrogen Paschen and Brackett absorption lines had been removed. The spectra were finally multiplied by a blackbody at the effective temperature of the standard star. All data reduction was done using IRAF222IRAF is distributed by the National Optical Astronomy Observatories, which are operated by the Association of Universities for Research in Astronomy, Inc., under cooperative agreement with the National Science Foundation. tasks and self-developed IDL routines along the standard lines that we use for spectral reduction. Some earlier spectroscopic results on SNe from Mt. Abu can be found in Marion et al. (2015) and Sand et al. (2016), while several nova results are presented in Banerjee & Ashok (2012) and references therein.
4.2 IRTF
A spectrum of SN 2016adj was obtained using the 3 m NASA Infrared Telescope Facility (IRTF) on 2016 April 14, covering the 0.78 to 2.5m region. This spectrum was obtained using SpeX (Rayner et al., 2003) in the cross-dispersed mode, using the slit () and a total integration time of 1912 s. The SpeX data were reduced and calibrated using the Spextool software (Cushing, Vacca & Rayner, 2004), and corrections for telluric absorption were performed using the IDL tool xtellcor (Vacca, Cushing & Rayner, 2003).
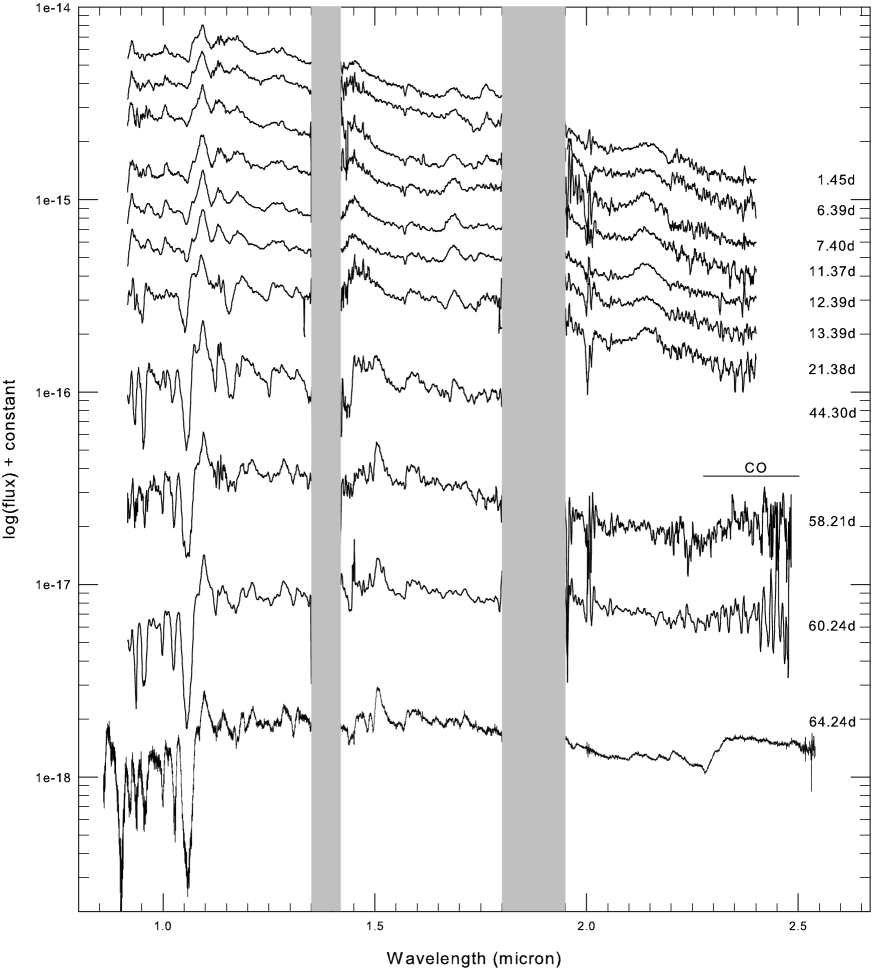
The log of all the observations is given in Table 1. The NIR spectra, from day 1 to day 64, are presented in Fig. 2; line identifications are given in Table 2.
| (Obs) | ID | (Rest) | Transition |
|---|---|---|---|
| (m) | (m) | ||
| 0.9226 | Pa-9 | 0.92315 | 3–9 |
| 0.9258 | Mg i | 0.92583 | 1DFo |
| 0.9658 | C i | 0.96057, 0.96234 | 3PS |
| 1.0049 | Pa-7 | 1.00521 | 3–7 |
| 1.0686 | C i | 1.06860, 1.06882, 1.06942 | 3PD |
| 1.0831 | He i | 1.08321, 1.08332, 1.08333 | 3SPo |
| 1.0938 | Pa- | 1.09411 | 3–6 |
| 1.175 | C blend | 1.17533 | 3P – 3P |
| 1.17515, 1.17565, 1.17580 | 3DFo | ||
| 1.1287 | O i | 1.12894, 1.12895, 1.12900, 1.12901 | 3PDo |
| 1.12902, 1.12904, 1.12982, 1.13008 | |||
| 1.1330 | C i | 1.13334 | 1PDo |
| 1.2818 | Pa- | 1.28216 | 3–5 |
| 1.3164 | O i | 1.31675, 1.31685, 1.31687 | 3PSo |
| 1.4543 | C i | 1.44240 | 3PDo |
| 1.45465 | 1PP | ||
| 1.5040 | Mg i | 1.5025, 1.5040, 1.5048 | 3SPo |
| 1.6890 | C i | 1.68675 | 1PPo |
| 1.68950 | 1DFo | ||
| 2.1656 | Br- | 2.16612 | 4–7 |
| 2.2056 | Na i | 2.2056, 2.2084 | 2SPo |
| 2.266 | Ca i | 2.261, 2.263, 2.266 | 3DFo |

5 Reddening and SED
An optical spectrum of SN 2016adj, covering the 3500–9800Å region at 1Å resolution, was obtained by Thomas et al. (2016) on 2016 Feb 09.762 with the Wide Field Spectrograph (WiFeS); the spectrum is available on WISERep333https://wiserep.weizmann.ac.il/.
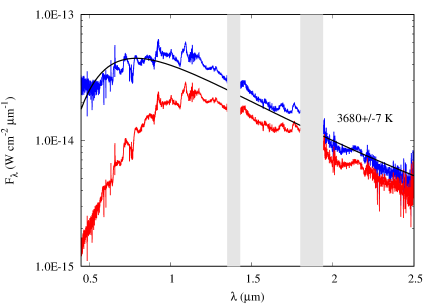
We present a combined optical (Thomas et al., 2016) and NIR spectrum of 2016 February 9 – before CO formation – in Fig. 3. Merging of the WiFes and Mt Abu spectra is a straightforward process, achieved by matching the continuum levels and emission features in the overlapping region that both spectra share around the 0.9m micron region.
In the optical spectrum (Thomas et al., 2016) the Na i D1 and D2 components are resolved, both from the Milky Way and the host galaxy, as shown in Fig. 3. The measured equivalent widths (EW) of the D1 and D2 lines from the host galaxy are 1.34Å and 1.45Å respectively, and from the Milky Way are 0.58Å and 0.79Å respectively, with errors typically of %. We use the EWs to determine the reddening to SN 2016adj, using the reddening versus EW relationships of Richmond et al. (1994), based on the Sembach, Danks & Savage (1993) data.
For the Milky Way, we get an average ; the same value is obtained from the reddening maps of Schlafly & Finkbeiner (2011). The EWs for SN 2016adj are slightly larger than the calibrated range of values in the relationships of Richmond et al.. With this caveat, and assuming that the (Galactic) relationship between and Na i equivalent widths applies to the dust lane of NGC 5128, we follow Richmond et al. to find that values from the D2 and D1 lines are and respectively, leading to an average .
For the Milky Way, we assume a ratio of total-to-selective extinction . For the NGC 5128 dust lane the value of is significantly lower, , determined by Patat et al. (2015) on the basis of the wavelength-dependence of interstellar polarisation of SN 1986G in the host galaxy; we assume the Patat et al. value here. We use the dereddening formalism of Cardelli, Clayton & Mathis (1989). Dereddening the SN 2016adj spectrum first for Galactic extinction, and separately for extinction in the host galaxy, gives the spectral energy distribution (SED) in Fig. 3.
After dereddening, the location of the continnum was estimated by eye, and a blackbody was fitted to the combined optical-NIR continuum in Fig. 3. The fit yielded a T K, with a formal error of K; however this error is a gross underestimate, and is very dependent on the correct identification of regions free of spectral (including P-Cygni) features. Nevertheless, it is evident from Fig. 3 that the dereddened SED peaks around m, suggesting that the photospheric temperature must be of this order.
Clearly, the photospheric temperature at early times for SN 2016adj is very much on the low side compared to the range of 6000–10000 K displayed by several stripped envelope SNe early after discovery. For example, Figure 4 of Taubenberger et al. (2011) shows several stripped envelope SNe at or around discovery; these have , equivalent to spectral type A5–B5, or effective temperature in the range K. The low Tbb in the case of SN 2016adj possibly presages conditions that are conducive for the formation of CO, subsequently detected in this SN.
We note that the dereddened SED in Fig. 3 broadly resembles that computed by Dessart et al. (2015) for a Type IIb SN at 4 d after eruption (the earliest in their compilation; see their Figure 10, model 3p65Ax1). This shows a cool “photosphere” (peaking around 0.9m in ) with H lines sporting prominent P-Cygni profiles. Their model 6p5Ax1, describing a Type Ib SN (Figure 11 of Dessart et al., 2015), is lacking in H lines, seemingly ruling out this SN Type for SN 2016adj.
6 First-overtone CO emission
From 2016 April 7 (day 58.21), the Mt Abu -band spectra (Fig. 2) began to show a rise towards the red starting from around 2.29m, suggesting first overtone CO emission. A subsequent spectrum from the IRTF, obtained on day 64.24, clearly confirms this (see Fig. 2), and shows emission from the vibrational rotational transitions, extending up to 2.5m (the 8–6 and 9–7 bandheads are expected at approximately 2.48m and 2.51m respectively).
As discussed in Section 3, the optical maximum of SN 2016adj was reached between 3 and 8.56 February. Our first CO detection was made on 2016 April 7, i.e. 58–64 d after maximum, 58.2 d after discovery, thereby making it the second earliest CO detection in a SN after SN 2013ge (48 days).
The signal-to-noise ratio (125) in the CO emission region of the IRTF spectrum is, with the exception of SN 1987A (Spyromilio et al., 1988), higher compared to many of the earlier CO detections, including that in SN 2013ge (see Drout et al., 2016). The quality of our data allows much more reliable modelling of the CO parameters, and thus a better understanding of the early time CO chemistry. However before discussing our modelling we first consider whether it is appropriate to include 13CO in our modelling.
6.1 The case for 13CO
It is believed that most of 13C (along with 15N and 17O) in the Galaxy is synthesised in nova eruptions occurring on both Carbon-Oxygen and ONe core white dwarfs (Starrfield, Gehrz & Truran, 1997; José & Hernanz, 1998). These studies predict significant 13C enrichment, which is confirmed observationally (see Banerjee et al., 2016, who compile the 12C/13C ratio estimated in the 10 novae which have shown first overtone CO emission).
However the question has been raised whether CC SNe might also contribute to Galactic 13C (Nittler & Hoppe, 2005). These authors showed that Si, C, N, Mg-Al, Ca and Ti isotopic data for three micron-sized presolar SiC grains from the Murchison meteorite had very low 12C/13C ratios (, and respectively), similar to that expected from nova grains. However other isotopic signatures in these grains (28Si, 49Ti and 44Ca excesses, and a very high inferred 26Al/27Al ratio) indicated that they had in fact formed in a SN and not a nova.
A similar conclusion is reached by Liu et al. (2016) from a multi-element isotope analysis of their C2 class of pre-solar SiC grains, which show large enrichments in both 13C and 15N. Four such grains in their sample displayed low values (, , and ) for the 12C/13C ratio, apparently suggesting an origin in novae. However, other isotopic signatures (excesses in 29Si ,30Si, 50Ti) clearly favoured an origin from neutron-burst nucleosynthesis in CC SNe. Liu et al. thus conclude that the enrichments of 13C and 15N seen in their C2 grains point towards a CC SNe origin, and strongly suggest the occurrence of explosive H burning in the He shell during CC SN explosions.
The H is introduced into the He shell by mixing, as in (for example) the model developed by Pignatari et al. (2015) and discussed extensively in Liu et al. (2016). In view of the fact that H lines were strongly seen in early spectra of SN 2016adj (see Table 2 and Fig. 2) – indicating that it had a H envelope at outburst – the ingestion of H into the He shell via mixing is quite plausible. Pignatari et al. have studied the nucleosynthesis impact of the ingestion of modest amounts of H into the He shell in the pre-SN stage, i.e. before the SN shock reaches these layers. In some of their models (see model 25T-H, for example; top panel of their Figure 1) significant enhancement of 13C production is found in an oxygen rich region (designated by Pignatari et al., 2015, “the O/nova zone”). We speculate that the 13C16O could likely form here, and avoid subsequent destruction by He+ in this region (Lepp et al., 1990) if the He+ gets rapidly destroyed by charge exchange reactions with other metals (e.g C, O, Si) as was proposed in the case of SN 1987A (Lepp et al., 1990). Such metals are present in the O/nova zone as a consequence of mixing between layers (Pignatari et al., 2015).
These studies raise the possibility that grains previously attributed to novae might in fact have originated in Type II SNe; indeed the presence of SiC dust – which provided the rationale for including 13CO in our analysis – in a young supernova remnant is suggested by Rho et al. (2018a). 13C production in a CC SN seems possible, and 13CO is therefore included as a component in our modeling of the CO emission in SN 2016adj. As our IRTF data were obtained at high signal-to-noise, they offer a unique opportunity to test the important hypothesis that CC SNe contribute significantly to the Galactic 13C budget.
6.2 Modelling the CO emission
We consider two classes of models. The first class has 12C16O only, whereas the second class has both 12C16O and 13C16O in varying proportions. Only 12C16O and 13C16O are considered as likely contributing species to the CO emission; the contribution of other isotopologues, such as 12C17O, 14C16O, is assumed to be negligible.
The CO emission has been analysed using the model developed for nova V2615 Oph (Das, Banerjee & Ashok, 2009), in which strong first overtone CO emission was observed. This model was subsequently applied to three other novae that showed CO emission, namely V496 Sct (Raj et al., 2012), V5584 Sgr (Raj et al., 2015) and V5668 Sgr (Banerjee et al., 2016).
The CO is assumed to be in thermal equilibrium characterised by the same rotational and vibrational temperature (as in the LTE model of Spyromilio et al., 1988); the populations of the different levels are determined from the Boltzmann distribution. The necessary ro-vibrational constants of CO were taken from the National Institute of Standards and Technology data base (http://physics.nist.gov/PhysRefData/MolSpec) and from Benedict et al. (1962). Einstein- values were taken from Goorvitch (1994), which lists these values for all the ro-vibration transitions of the first overtone band, up to and for seven CO isotopologues, including 13C16O. Other details of our model can be found in Das et al. (2009).
We also assume that the CO emission, for both 12CO and 13CO, is optically thin. Should this not be the case then we expect that our deduced CO mass will be an underestimate (see for example Liu & Dalgarno, 1995, for the case of CO in SN 1987A). A full non-LTE treatment of the CO emission is beyond the scope of this paper.
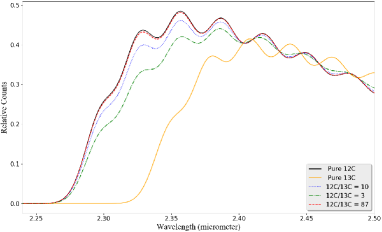
We illustrate in Fig. 4 the difference between the first overtone emission from optically thin 12CO and 13CO, calculated using the models by Das et al.; we show calculations for temperature 4600 K and ejecta velocity 3400 km s-1, typical of the values we explore below. Fig. 4 suggests that, unless 12CO is dominant, we can expect to be able to at least place constraints on the amount of 13CO.
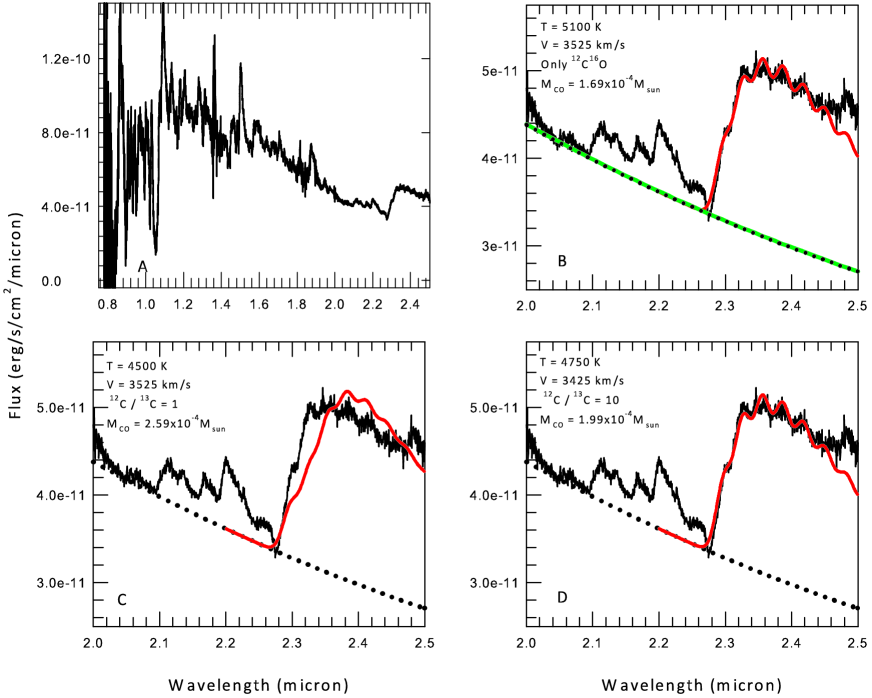
As discussed above, we have restricted our CO modelling to the high signal-to-noise IRTF spectrum of 14 April 2016 (64.24 d): we exclude the earlier Mt Abu spectra. The underlying continuum was estimated using a second order polynomial
for in erg s-1 cm-2m-1 and in m; we find erg s-1 cm-2m-1, erg s-1 cm-2m-2 and erg s-1 cm-2m-3; as shown in Fig. 5, this closely resembles a 2550 K blackbody. The form chosen for the continuum does not change the ratios of the band-heads, the quantity that essentially determines the temperature.
Modelling over an extended parameter space of temperature , velocity and C/13C establishes that both the first and second class of model agree best with the observed data with in the range 4000–5200 K, and in the range 3400–3800 km s-1.
6.2.1 Models with 12CO only
Some model plots, within this parameter subspace, are shown in Fig. 5, in which Panel A shows the entire spectrum. Panel B shows the best fit for a gas composed entirely of 12CO. The goodness of fit for the model spectrum to the observed spectrum was determined by minimising the reduced value. In the observed spectrum the pure 12CO features comprise the knee at m (which corresponds to the band-head of 12CO) and the band at 2.3227m.
We should note that underlying atomic lines undermine the modelling. Some of these include the suspected presence of a line at 2.489m, which leaves a large residual in the fit at that point (see Fig. 5). This feature, likely due to C i 2.4894, 2.4901m, also appears to be present in the spectra of SN 2013ge (Hunter et al., 2009). There is also a puzzling absorption-like feature at the foot of the CO emission at 2.275m, also seen in SN 2004dj at 137 d post-explosion (see Figure 16 of Hunter et al., 2009).
The best formal fit for the pure 12CO case is obtained for a temperature of 5100 K and a velocity of 3525 km s-1. This is significantly lower than the velocity estimated from optical He i lines (Hounsell et al., 2016), and from the profile of the IR H lines (see Section 7.2). This emphasises the fact that there must be a degree of separation of the low excitation (CO-bearing) and high excitation (He-bearing) regions of the ejecta (see Section 2).
While the temperature of 5100 K for a pure 12CO composition may seem higher than generally reported in the literature, it is a plausible value. A temperature of 5500 K was estimated in the Type IIP supernova SN 2004dj by Sharp & Hoeflich (1989). Moreover, CO first overtone bands are seen in the spectrum of K type stars (e.g Kleinman & Hall, 1986) even up to spectral class K0, which have a K; the bands therein are more pronounced in giants and super giants compared to dwarfs.
| Composition | 12C/13C | T(K) | Velocity | |
|---|---|---|---|---|
| ( km s-1) | ( M⊙) | |||
| 12CO only | — | |||
| 12CO + 13CO |
6.2.2 Models with 12CO and 13CO
Models with 13CO included in the composition are found to fit the data satisfactorily, provided ; our data place no tighter constraints than this (as above we assess goodness of fit by minimising the reduced ). One of the satisfactory fits at is shown in panel D of Fig. 5. For , the quality of the fits deteriorates rapidly, as the contribution from 13CO begins to dominate. An example of this is given in panel C for , where a good fit was not attainable for any reasonable combination of temperature and velocity. This implies that the presence of 13CO in the observed emission cannot be ruled out, but if it is present the 12C/13C ratio must be (cf. the solar value of ; Asplund et al., 2009). Interestingly this conclusion is similar to that drawn by Matsuura et al. (2017) for SN 1987A, who place a limit 12CO/13CO from their ALMA observations of the latter object. However, we note here that the present work seems to be the first attempt to look for evidence of 13C in a SN using the first overtone CO emission; this has been made possible by the high signal-to-noise in our IRTF spectrum.
As the criterion for C2 grains in particular is that (see Liu et al., 2016), this shows that CC SNe as sources of the 13C enrichment seen in certain meteoritic grains can not be ruled out. On the other hand, it seems unlikely that some of the extremely 13C-enriched C2 grains in the Liu et al. sample, with 12C/13C close to unity, could have been synthesised in a SN 2016adj-like SN.
Our overall conclusion for models that include 13CO is that the observed CO emission is satisfactorily modelled and characterised with the following range of parameters: , temperature K, and velocity km s-1, which lead to an estimated CO mass M⊙. These results are summarised in Table 3.
6.2.3 LTE and non-LTE
We should consider whether non-LTE calculations could yield results that are significantly different from those obtained assuming LTE. Liu et al. (1992) presented both LTE and non-LTE analyses for the spectra of SN 1987A obtained by Spyromilio et al. (1988). In the earliest spectrum, taken 192 d after discovery, the non-LTE fit is, as these authors acknowledge, no better than the LTE fit; indeed the non-LTE fit is clearly less satisfactory. It is only in the later spectra, between days 255 to 377, when the density falls and the gas becomes optically thin that the non-LTE models fare significantly better than the LTE. With this is mind, and drawing a parallel between LTE and non-LTE values of the and values presented in Tables 1 and 2 of Liu et al. (1992), we conclude that our estimated temperature and velocity values are not that different from what a non- LTE calculation would have given. However, given the differences in the deduced CO masses for SN 1987A for the cases of LTE and non-LTE, using the same datasets (Liu et al., 1992), it is likely that our LTE mass estimate may be underestimated by a factor of (see also Figure 3 of Sarangi & Cherchneff, 2013).
6.3 Comparison of the CO modeling with previous studies
| SN | Type | Latest | Earliest | Reference |
| non-detectiona (d) | detectiona (d) | |||
| 1987A | IIp Pec | 18 | 110?b(192) | Meikle et al. (1989) |
| 1995ad | IIP | — | 105 | Spyromilio & Leibundgut (1996) |
| 1998dl | IIP | — | 152 | Spyromilio et al. (2001) |
| 1999em | IIP | — | 170 | Spyromilio et al. (2001) |
| 2002hh | IIP | 137c | 200 | Pozzo et al. (2006) |
| 2004dj | IIP | — | 106 | Kotak et al. (2005) |
| 2004et | IIP | 64 | 300 | Kotak et al. (2009) |
| 2005af | IIP | — | 194 | Kotak et al. (2006) |
| 2017eaw | IIP | 53 | 107 | Rho et al. (2018b) |
| 1998S | IIn | 44 | 109 | Fassia et al. (2001) |
| 2011dh | IIb | — | 89 | Ergon et al. (2015) |
| 2016adj | IIb | 21 | 58 | This work |
| 2000ew | Ic | 39 | 97 | Gerardy et al. (2002) |
| 2007gr | Ic | 46.9 | 70.8 | Hunter et al. (2009) |
| 2013eg | Ib/c | — | 48 | Drout et al. (2016) |
| aDays from discovery. | ||||
| bWe have reassessed the CO detection in SN 1987A for day 110, reported by Meikle et al. (1989); the data for this time seem to show | ||||
| the CO band-head; there is a clear detection at day 192. | ||||
| cThe spectra of SN 2002hh is noisy so that it could contain CO band-head. | ||||
It is instructive to compare our estimates of the CO temperature and velocity with corresponding estimates of the CO parameters in other SNe. A summary of CO detections in SNe before is given in Table 1 of Gerardy et al. (2002); a summary of later detections is given in Table 1 of Sarangi et al. (2018). These are gathered together here in Table 4, together with more recent detections; the SNe in this Table are grouped acccording to Type.
We first discuss how the CO parameters in SN 2016adj compare with those of other SNe in which CO has been detected, and follow this with the implications for our understanding of CO formation in SNe.
6.3.1 SN 1987A
The CO emision in SN 1987A was the best observed and most thoroughly analysed. In this object, substantial variation between 192 d to 377 d is seen in these parameters with time, especially in the temperature, along with variations also arising depending on the choice of the model used (LTE versus non-LTE). The reader is referred to the temperature, mass and velocity values in Tables 1 and 2 of Liu et al. (1992), which analyses the data of Meikle et al. (1989). Gearhart, Wheeler & Swartz (1999), analysing the SN 1987A data, suggest that on day 192, a temperature closer to 4000 K, as also estimated by Sharp & Hoeflich (1990).
6.3.2 SN 2004dj
Detailed modelling of the fundamental CO emission spectra of the Type IIP supernova SN 2004dj has also been reported by Kotak et al. (2005), who also detect the first overtone emission but do not model it. Comparison between observed and model profiles for the fundamental band of CO on day 130 shows that the best agreement is obtained with K; this is even higher than our estimate in this study. While these authors do not mention the velocity of their best fit model, it is implicitly presumed to lie in the range of km s-1.
6.3.3 SNe 2007gr, 2000ew
While Hunter et al. (2009) and Gerardy et al. (2002) did not carry out detailed modelling of the CO emission seen in SNe 2007gr and 2000ew respectively, they estimate the temperature and velocity by overplotting their CO profiles on the SN 1987A profiles, and comparing the shapes and slopes of various band-heads. Hunter et al. conclude that, on day 137.7, the temperature of the CO emitting region in SN 2007gr was greater than 2000 K, and the expansion velocity was in the range 1800–2000 km s-1. Gerardy et al. conclude that, on day 97, the temperature was at least 2000 K in the CO emitting region, and that the CO has a velocity similar to that of SN 1987A, km s-1. However the spectrum of Gerardy et al. is of low signal-to-noise.
6.4 Timescale of CO formation in SNe
Our early detection of CO in SN 2016adj suggests that there is a range of time-scales over which CO and dust form in the ejecta of Type II SNe. A number of parameters, including hydrogen mixing, the C/O ratio and metal depletion, could contribute to those timescales (Cherchneff & Lilly, 2008). Models of CO formation during SN eruption indicate that the amount of CO increases from M⊙ at 100 days since the explosion, and thereafter increases to as much as 0.1 M⊙ after days, irrespective of SN progenitor (see e.g. Sarangi & Cherchneff, 2013). Figure 10 of Sarangi et al. (2018), summarising data to 2013, shows only four CO detections before day 100.
The summary of CO detections according to SN type (Table 4) suggests that, in Type II P SNe, most CO emission is detected for the first time shortly after 100 days, consistent with CO formation model of Sarangi & Cherchneff (2013, 2015). Type IIn are SNe that show interaction with the circum-stellar medium (CSM), and SN 1998S is the only Type IIn which shows behaviour similar to those of Type IIP. Sarangi et al. (2018) show that dust formation associated with a CSM occurs only after day 380, which may indicate that the CO and dust evolution of Type IIn SNe may not be very different from that of Type IIn. However, a larger sample is required to draw any firm conclusion.
On the basis of just two examples (SN 2000ew and SN 2007gr), the CO formation time-scale for Type Ic SNe appears to be much shorter than that for Type IIP SNe. The presence of ionised helium hinders CO formation (Liu & Dalgarno, 1995; Sarangi & Cherchneff, 2013, their Figure 7), while Type Ic SNe – with stripped helium – may show enhance CO formation.
A search of the literature indicates there is little theoretical work which addresses the formation of CO at very early times ( d or less), as observed in SN 2013eg or SN 2016adj; for example the Sarangi & Cherchneff (2013) models begin simulations at 100 d. Thus it is difficult to place the early formation of CO in SN 2016adj into a theoretical framework to compare observations and model predictions. In fact SNe such as SN 2013eg, SN 2016adj or SN 2010gr – all of which display early emergence of CO – could provide impetus for fresh modelling to understand early CO formation, the amount of CO expected to be produced, and the location of the CO production zones.
7 General characteristics of the NIR spectra
7.1 Line identification
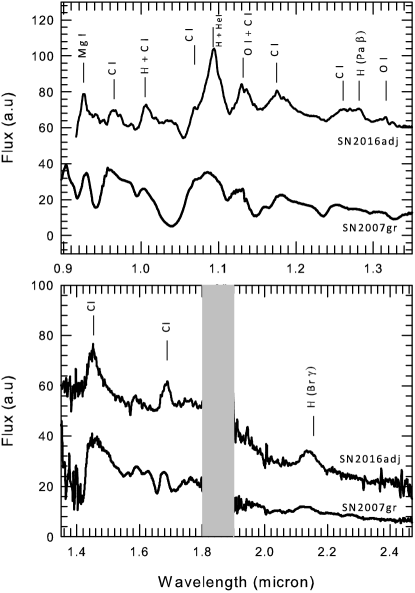
The prominent lines seen in the spectra are identified in Fig. 6, and listed in Table 2. It appears that we may be seeing several carbon lines in our spectra. We have compared our spectra with that of the carbon-rich Type Ic supernova SN 2007gr on +15.5d (Hunter et al., 2009, their Figure 12). Both spectra show considerable similarity, and most of the carbon features identified by Hunter et al. are also seen in SN 2016adj. We note that the C lines identified here are routinely encountered in the spectra of novae, where they are much easier to identify because of their smaller line widths. It may be seen that the O i feature at 1.1287m shows considerable fluctuation from epoch to epoch. This is primarily because the line is situated in a window of very poor atmospheric transmission and small differences in airmass between source and standard star can create large residuals and substantial noise in that region during the process of ratioing of the source and standard star spectra. Notwithstanding this, we note that the O i 1.1287m is pumped by Ly- photons (see e.g. Strittmatter et al., 1977; Osterbrock & Ferland, 2006), so the strength or absence of this feature might also be attributed to a lack of velocity overlap between the lines.
7.2 IIb or not IIb
Consistent with the traits of a SN IIb, SN 2016adj displays prominent hydrogen lines from the outset. Among these we unambiguously identify Pa-7 1.0049m, Pa- 1.0938m, Pa- 1.2818m and Br- 2.1656m. As discussed in Section 5, our data for day 1.45 broadly resemble the model SED of a Type IIb SN (see Dessart et al., 2015).
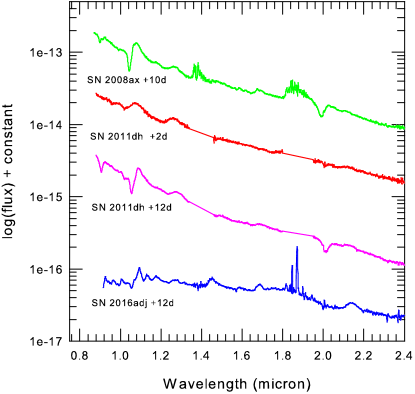
There is a feature at 0.9226m that may be Pa-9, but it could be blended with Mg i at a similar wavelength (m; see Table 2). Although H lines are dominant, a Type IIb supernova is expected to make a transition from an initial hydrogen-dominated spectrum to the helium-dominated spectrum of a SN Ib at later times. This can be seen in Fig. 7, where the spectra of SNe 2011dh and 2008ax, two well studied Type IIb SNe, are displayed, showing the strong and early development of the He i 1.0831m and 2.0581m lines (see Chornock et al., 2011; Ergon et al., 2014; Marion et al., 2014; Taubenberger et al., 2011, for a large collection of spectra spanning early to late evolution).
In contrast there is little or no evidence for the presence of He i 2.0581m in SN 2016adj, even up to 64 d after discovery. Its absence indicates that SN 2016adj may be different from a typical SN IIb. After the 1.0831m line, the 2.0581m line is the second strongest He i line in the NIR region, although the latter may be weak and is sometimes absent: this might be because the upper level 1Po of the He i 2.0581m line has a strongly allowed transition to the ground 1S state, whereas there is no such exit available for the upper 3Po level of the 1.0831m line. [We note that (the He i 1.8690m line is also strong, but lies in an atmospheric window where the transmission is poor].
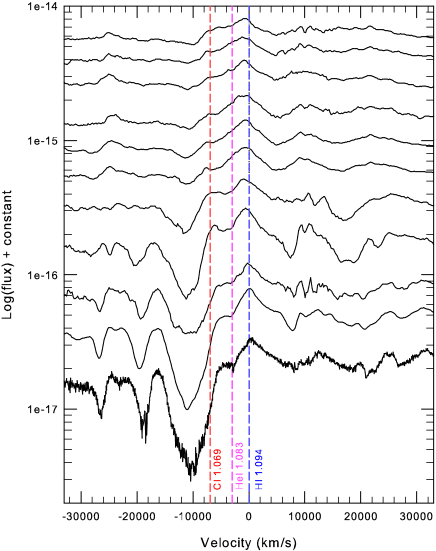
Towards the later stages (see, for example, the last two spectra of Fig. 2), there is a prominent shoulder forming on the blue wing of the 1.094m feature, which could result from the build-up of the He i 1.0831m. Attributing the peak of the 1.094m feature to H, the H i expansion velocity measured between peak to absorption minimum, is found to be 9150 km s-1 on day 1, which increases to km s-1 towards the end of the observations (see Fig. 8).
The absence of the He i 2.0581m line could indicate either that He is deficient, or that physical conditions are not suitable to excite He lines. If SN 2016adj is indeed a stripped envelope SN, the first layer of material that should be lost is hydrogen. Yet hydrogen is seen in all our spectra, implying that at least a portion of it has been retained. It is therefore difficult to understand how the helium layer, which lies beneath the hydrogen layer, could have been so significantly stripped that He should appear to be deficient. Rather, it appears more likely that the rather low photospheric temperatures of K, as indicated by the SED (Fig. 3), are not conducive to collisional excitation or ionisation of He (the 3P and 1P upper levels of the He i 1.0830, 2.0581m lines have excitation energies 20.96 and 21.22 eV respectively). Collisional ionisation followed by line formation through recombination, appears even more problematic. The role of the ambient radiation field in He line excitation needs to be examined in detail but we do not attempt this here (see Maurer et al., 2010, for a discussion of the excitation of He i). However a cautionary note that emerges, specifically with respect to the taxonomic classification of SNe, is that the absence of He lines may not always mean that it is deficient or that the He layer has been stripped.
Also we note that Sarangi & Cherchneff (2013) studied the formation of molecules and dust clusters in the ejecta of solar metallicity, Type II supernovae using a chemical kinetic approach. The chemically controlled simulation produces the evolution of molecules and small dust cluster masses from day 100 to day 1500 after explosion for the stellar progenitors with initial mass of 12, 15, 19 and 25 M⊙. Their simulaton demontrates that SNe with large progenitor masses tend to form dust efficiently, but are even more efficient at forming molecules; they find that the molecular component of the ejecta can be as large as 50% of the total ejected mass. The decrease of He+ content in the outermost ejecta zone by stripping (Liu et al. 2015) enhance CO formation. The Type IIb progenitor of SN 2016adj may be consistent with early CO formation, compared with (for example) SN 1987A (Type II-pec).
7.3 Some band emission features of special interest
Apart from the CO emission in the band discussed in Section 6, we identify the Na i 2.2056, 2.2084m lines as contributors to the prominent 2.2m blend seen in the CO modelling figures. These lines are known to effectively trace low temperature gas and invariably precede, in the case of novae, the formation of molecules and dust (Evans et al., 1996; Das et al., 2008). The reason for this can be understood from LTE calculations. At around 2500 K, only about 50% Na remains neutral but by 3000 K, almost 99% is ionised. These neutral Na i lines therefore originate in relatively cool zones, close to the temperature of K where the first dust condensates (carbon) are expected to form (see e.g. Bianchi & Schneider, 2007, and references therein). In the case of SN 2016adj observations taken in July-August 2016 confirm the formation of dust in this supernova through a significant NIR excess; this will discussed elsewhere.
Also notable is the likely absence of the unidentified feature at 2.26m that was prominently seen in SN 1987A during CO emission, as well as in a few other supernovae such as SN 1995ad (Spyromilio & Leibundgut, 1996), SNe 1998dl and 1999em (Spyromilio et al., 2001), but absent in several others (Gerardy et al., 2002). CO+ was proposed as a potential carrier, but was ruled out on the basis of detailed models of CO chemistry (Liu & Dalgarno, 1995; Gearhart et al., 1999). Furthermore, as Gerardy et al. (2002) point out, this feature did not evolve with the CO bands in SN 1987A, remaining visible long after the CO emission has faded (Meikle et al., 1993). We propose that this feature could arise from the combined presence of the Ca i lines at 2.261m, 2.263m, 2.266m, which are routinely and prominently seen in the spectra of cool K and M stars (see e.g. Kleinman & Hall, 1986). The low temperature environment in which these lines are excited is compatible with similar conditions prevalent in SN 2016adj, as implied by the formation of molecules like CO.
8 Conclusions
Near-IR spectra, covering the first 64 days after discovery, have been presented for the CC SN 2016adj in the nearby galaxy Centaurus A (NGC 5128). We detect first overtone CO emission on day 58, one of the earliest CO detections in a SN. LTE modelling of the CO emission yields temperature, velocity and mass values of K, km s-1 and M⊙ respectively for a gas composed entirely of 12CO. If the CO has a component of 13CO also (in addition to 12CO), then our best fit models suggest the following range of values for the above parameters: K, km s-1 and M⊙. However we should note that these masses may be lower limits, as the CO may be optically thick (see Section 6.2.3) The inclusion of 13CO was motivated by the isotopic analysis of pre-solar SiC meteoritic grains, which show large 13C enrichments and for which a CC SNe origin is strongly suggested (e.g. Nittler & Hoppe, 2005). Our analysis shows that the CO emission profile is adequately explained by a pure 12CO composition but does not rule out the presence of 13CO provided it is such that .
We estimate the reddening to the object to be , with the majority arising in the host galaxy. A blackbody fit to the optical and near IR data show that the photosphere has a low temperature of K at outburst. SN 2016adj has been proposed to be a Type IIb supernova, which show an initial hydrogen-dominated spectrum but later, undergo a transition to a helium-rich Type Ib spectrum. In SN 2016adj, hydrogen lines are prominent initially, but the helium lines do not strengthen as expected. It is possible that this is a peculiar object, or a SN making a rather slow transition from Type IIb to Ib. An unidentified line at 2.26m line has often been seen in the spectrum of SNe (e.g SN 1987A), which merges with the blue wing of the 2-0 band-head of CO. It is proposed that this feature arises from the Ca i 2.260, 2.262, 2.265m transitions routinely seen in the spectra of cool stars.
Acknowledgments
We thank an anonymous referee for their comments. The research work at Physical Research Laboratory is supported by the Department of Space, Government of India. RDG was supported by NASA and the United States Air Force. MSC was supported under contract NNH14CK55B with the National Aeronautics and Space Administration. TRG’s research is supported by the Gemini Observatory, which is operated by the Association of Universities for Research in Astronomy, Inc., under a cooperative agreement with the NSF on behalf of the Gemini partnership: the National Science Foundation (United States), the National Research Council (Canada), CONICYT (Chile), Ministerio de Ciencia, Tecnolog a e Innovación Productiva (Argentina), and Ministério da Ciência, Tecnología e Inovação (Brazil). JR acknowledges support from NASA ADAP grant NNX12AG97G for the study of SN dust. We are very thankful to A. Tokunaga for making the IRTF time available on short notice for this program.
References
- Asplund et al. (2009) Asplund M., Grevesse N., Sauval A. J., Scott P., 2009, ARAA, 47, 481
- Banerjee & Ashok (2012) Banerjee D. P. K., Ashok N. M., 2012, BASI, 40, 243
- Banerjee et al. (2016) Banerjee D. P. K., Srivastava M. K., Ashok N. M., Venkataraman V., 2016, MNRAS, 455, L109
- Benedict et al. (1962) Benedict W. S., Herman R., Moore G. E., Silverman S., 1962, ApJ, 135, 277
- Bertoldi et al. (2003) Bertoldi F., Carilli C. L., Cox P., Fan X., Strauss M. A., Beelen A., Omont A., Zylka R., 2003, A&A, 409, L55
- Bianchi & Schneider (2007) Bianchi S., Schneider R., 2007, MNRAS, 378, 973
- Biscaro & Cherchneff (2014) Biscaro C., Cherchneff I., 2014, A&A, 564, A25
- Cardelli, Clayton & Mathis (1989) Cardelli J. A., Clayton G.C., Mathis J. S., 1989, ApJ, 345, 245
- Catchpole & Glass (1987) Catchpole R., Glass I., 1987, IAUC 4457
- Catchpole et al. (1988) Catchpole R., et al., 1988, MNRAS, 231, 75P
- Cherchneff & Dwek (2010) Cherchneff I., Dwek E., 2009, ApJ, 703, 642
- Cherchneff & Dwek (2010) Cherchneff I., Dwek E., 2010, ApJ, 713, 1
- Cherchneff & Lilly (2008) Cherchneff I., Lilly S., 2008, ApJ, 683, L123
- Chornock et al. (2011) Chornock R., et al., 2011, ApJ, 739, 41
- Clocchiatti et al. (1996) Clocchiatti A., Wheeler J. C., Benetti S., Frueh M., 1996, ApJ, 459, 547
- Cushing, Vacca & Rayner (2004) Cushing M. C., Vacca W. D., Rayner J. T., 2004, PASP, 116, 362
- Das et al. (2008) Das R. K., Banerjee D. P. K., Ashok N. M., Chesneau O., 2008, MNRAS, 391, 1874
- Das et al. (2009) Das R. K., Banerjee D. P. K., Ashok N. M., 2009, MNRAS, 398, 37
- de Looze et al. (2017) De Looze I., Barlow M. J., Swinyard B. M., Rho, J., Gomez H. L., Matsuura M., Wesson R., 2017, MNRAS, 465, 3309
- Dessart et al. (2015) Dessart L., Hillier D. J., Woosley S., Livne E., Waldman R., Yoon S.-C., Langer N., 2015, MNRAS, 453, 2189
- Drout et al. (2016) Drout M. R., et al., 2016, ApJ, 821, 57
- Egner et al. (2010) Egner S., Ikeda Y., Watanabe M., Hayano Y., Golota T., Hattori M., Ito M., Minowa Y., Oya, S., Saito Y., Takami H., Iye M., 2010, SPIE, 7736, id. 77364V
- Ergon et al. (2014) Ergon M., et al., 2014, A&A, 562, 17
- Ergon et al. (2015) Ergon M., et al., 2015, A&A, 580, 142
- Evans et al. (1996) Evans A., Geballe T. R., Rawlings J. M. C., Scott A. D., 1996, MNRAS, 282, 1049
- Fassia et al. (2001) Fassia A., et al., 2001, MNRAS, 325, 907
- Fillipenko (1997) Filippenko A. V., 1997, ARAA, 35, 309
- Fox et al. (2010) Fox O. D., Chevalier R. A., Dwek E., Skrutskie M. F., Sugerman B. E. K., Leisenring J., 2010, ApJ, 725, 1768
- Gall, Hjorth & Andersen (2011) Gall C., Hjorth J., Andersen A. C., 2011, A&A Rev, 19, 43
- Gearhart et al. (1999) Gearhart R. A., Wheeler J. C., Swartz D. A., 1999, ApJ, 510, 944
- Gehrz (1989) Gehrz R. D., 1989, in IAU Symposium 135 Infrared Astronomy, p. 445, eds L. J. Allamandola, A. G. G. M. Tielens, Kluwer Academic Publishers, Dordrecht
- Gehrz & Ney (1990) Gehrz R. D., Ney A. P., 1990, Proc. Nat. Acad. Sci. (USA), 97, 4354
- Gerardy et al. (2000) Gerardy C. L., Fesen R. A., Hoflich P., Wheeler, J. C., 2000, AJ, 119, 2968
- Gerardy et al. (2002) Gerardy C. L., et al., 2002, PASJ, 54, 905
- Gomez et al. (2012) Gomez H. L., et al., 2012, ApJ, 760, 96
- Goorvitch (1994) Goorvitch D., 1994, ApJS, 95, 535
- Holoien et al. (2017) Holoien T. W.-S., et al., 2017, MNRAS, 471, 4966
- Hounsell et al. (2016) Hounsell R. A., et al., 2016, ATel 8663
- Hunter et al. (2009) Hunter D. J., et al., 2009, A&A, 508, 371
- Indebetouw et al. (2014) Indebetouw R., et al., 2014, ApJ, 782, L2
- Isaak et al. (2002) Isaak K. G., Priddey R. S., McMahon R. G., Omont A., Peroux C., Sharp R. G., Withington S., 2002, MNRAS,329, 149
- José & Hernanz (1998) José J., Hernanz M., 1998, ApJ, 494, 680
- Kamenetzky et al. (2013) Kamenetzky J., et al., 2013, ApJ, 773, L34
- Kiyota et al. (2016) Kiyota S., Shappe B. J., Stanek K. Z., Subo D., 2016, ATel 8654
- Kleinman & Hall (1986) Kleinman S. G., Hall D. N. B., 1986, ApJS, 62, 501
- Kotak et al. (2005) Kotak R., Meikle P., van Dyk S. D., Höflich P. A., Mattila S., 2005, ApJ, 628, L123
- Kotak et al. (2009) Kotak R., et al., 2009, ApJ,704, 306
- Kotak et al. (2006) Kotak et al. 2006, ApJ, 651, L117
- Lazzati & Heger (2016) Lazzati D., Heger A., 2016, ApJ, 817, 134
- Lepp et al. (1990) Lepp S., Dalgarno A., McCray R., 1990, ApJ, 358, 262
- Liu & Dalgarno (1995) Liu W., Dalgarno A., 1995, ApJ, 454, 472
- Liu et al. (1992) Liu W., Dalgarno A., Lepp S., 1992, ApJ, 396, 679
- Liu et al. (2016) Liu N., Nittler L. R., Alexander C. M. O’D., Wang J, Pignatari M., José J. Nguyen A., 2016, ApJ, 820, 140
- Lucy et al. (1991) Lucy L. B., Danziger I. J., Gouiffes C., Bouchet P., 1991, in Supernovae. The Tenth Santa Cruz Workshop in Astronomy and Astrophysics, p. 82 ed S. E. Woosley, Springer-Verlag, New York
- Marion et al. (2014) Marion G. H., et al., 2014, ApJ, 781, 69
- Marion et al. (2015) Marion G. H., et al., 2015, ApJ, 798, 39
- Marples, Bock & Parker (2016) Marples P., Bock G., Parker S., 2016, ATel, 8651
- Matsuura et al. (2011) Matsuura M., et al., 2011, Science, 333, 1258
- Matsuura et al. (2015) Matsuura M., et al., 2015, ApJ, 800, 50
- Matsuura et al. (2017) Matsuura M., et al., 2017, MNRAS, 469, 3347
- Maurer et al. (2010) Maurer I., Mazzali P. A., Taubenberger S., Hachinger S., 2010, MNRAS, 409, 1441
- McGregor & Hyland (1987) McGregor P. J., Hyland A. R., 1987, IAUC, 4468
- Meikle et al. (1989) Meikle W. P. S., Spyromilio J., Varani G.-F., Allen D. A., 1989, MNRAS, 238, 193
- Meikle et al. (1993) Meikle W. P. S., Spyromilio J., Allen D. A., Varani G.-F., Cumming R. J., 1993, MNRAS, 261 535
- Meikle et al. (2006) Meikle W. P. S., et al., 2006, ApJ, 649, 332
- Meikle et al. (2007) Meikle W. P. S., et al., 2007, ApJ, 665, 608
- Morgan & Edmunds (2003) Morgan H. L., Edmunds M. G., 2003, MNRAS, 343, 427
- Nittler & Hoppe (2005) Nittler L. R., Hoppe P., 2005, ApJ, 631, L89
- Olivia, Moorwood & Danziger (1987) Oliva E., Moorwood A. F., Danziger I. J., 1987, IAUC 4484
- Osterbrock & Ferland (2006) Osterbrock D. E., Ferland G. J., 2006, Astrophysics of gaseous nebulae and active galactic nuclei, Second Edition, University Science Books, Sausalito, California
- Patat et al. (2015) Patat F., et al., 2015, A&A, 577, A53
- Phillips et al. (2013) Phillips M. M., et al., 2013, ApJ, 779, 38
- Pignatari et al. (2015) Pignatari M., et al., 2015, ApJ, 808, L43
- Pozzo et al. (2006) Pozzo M., Meikle W. P. S., Rayner J. T., Joseph R. D., Filippenko A. V., Foley R. J., Li W., Mattila S., Sollerman J., 2006, MNRAS, 368. 1169
- Raj et al. (2012) Raj A., Ashok N. M., Banerjee D. P. K., Munari U., Valisa P., Dallaporta S., 2012, MNRAS, 425, 2576
- Raj et al. (2015) Raj A., Banerjee D. P. K., Ashok N. M., Kim Sang Chul, 2015, RAA, 15, 993
- Rayner et al. (2003) Rayner J. T., Toomey D. W., Onaka P. M., Denault A. J., Stahlberger W. E., Vacca W. D., Cushing M. C., Wang, S., 2003, PASP, 115, 362
- Rho et al. (2009) Rho J., Jarrett T. H., Reach W. T., Gomez H., Andersen M., 2009, 693, L39
- Rho et al. (2012) Rho J., Onaka T., Cami J., Reach W. T., 2012, ApJ, 747, L6
- Rho et al. (2018a) Rho J., Gomez H. L., Boogert A., Smith M. W. L., Lagage, P.-O., Dowell D., Clark C. J. R., Peters E., Cami J., 2018a, MNRAS, 479, 5101
- Rho et al. (2018b) Rho J., Geballe T. R., Banerjee D. P. K., Dessart L., Evans A., Joshi V., 2018b, ApJ, in press (arXiv:1808.00683)
- Richmond et al. (1994) Richmond M. W., Treffers R, R., Filippenko A, V., Paik Y., Leibundgut B., Schulman E., Cox C. V., 1994, AJ, 107, 1022
- Roche et al. (1993) Roche P. F., Aitken D. A., Smith C. H., 1993, MNRAS, 261, 522
- Sand et al. (2016) Sand D. J., et al., 2016, ApJ, 822, L16
- Sarangi & Cherchneff (2013) Sarangi A., Cherchneff I., 2013, ApJ, 776, 107
- Sarangi & Cherchneff (2015) Sarangi A., Cherchneff I., 2015, A&A, 575, A95
- Sarangi et al. (2018) Sarangi A., Matsuura M., Micelotta E. R., 2018, Sp. Sci. Rev., 214, 63
- Schlafly & Finkbeiner (2011) Schlafly E., Finkbeiner D. P., 2011, ApJ, 737, 103
- Sembach, Danks & Savage (1993) Sembach K. R., Danks A. C., Savage B. D., 1993, A&A, 100, 107
- Sharp & Hoeflich (1989) Sharp C., Höflich P., 1989, Highlights of Astronomy, 8, 207
- Sharp & Hoeflich (1990) Sharp C., Höflich P., 1990, Ap&SS, 171, 213
- Smith et al. (2011) Smith N., et al., 2011, MNRAS, 418, 1959
- Spyromilio et al. (1988) Spyromilio J., Meikle W. P. S., Learner R. C. M., Allen D. A., 1988, Nature, 334, 327
- Spyromilio & Leibundgut (1996) Spyromilio J., Leibundgut B., 1996, MNRAS, 283, L89
- Spyromilio et al. (2001) Spyromilio J., Leibundgut B., Gilmozzi R., 2001, A&A, 376, 188
- Srivastava et al. (2015) Srivastava M., Ashok N. M., Banerjee D. P. K., Sand D., 2015, MNRAS, 454, 1297
- Srivastava et al. (2016) Srivastava M., Banerjee D. P. K., Ashok N. M., 2016, ATel 8686
- Starrfield, Gehrz & Truran (1997) Starrfield S., Gehrz R. D., Truran J. W., 1997, in Bernatowicz T. J., Zinner E., eds, AIP Conf. Proc. 402, Astrophysical Implications of the Laboratory Study of Presolar Materials, American Institute of Physics, New York
- Strittmatter et al. (1977) Strittmatter P. A., Woolf N. J., Thompson R. I., Wilkerson S., Angel J. R. P., Stockman H. S., Gilbert G., Grandi S. A., Larson H., Fink U., 1977, ApJ, 216, 23
- Stritzinger et al. (2016) Stritzinger M., et al. 2016, ATel 8657
- Strutskie et al. (2006) Strutskie M. F., et al., 2006, AJ, 131, 1163
- Sugarman & Lawrence (2016a) Sugarman B., Lawrence S., 2016a, ATel 8759
- Sugarman & Lawrence (2016b) Sugarman B., Lawrence S., 2016b, ATel 8890
- Taubenberger et al. (2011) Taubenberger S., et al. 2011, MNRAS, 413, 2140
- Temim et al. (2017) Temim T., Dwek E., Arendt R. G., Borkowski K. J., Reynolds S. P., Slane P., Gelfand J. D., Raymond J. C., 2017, ApJ, 836, 129
- Thomas et al. (2016) Thomas A., et al. 2016, ATel 8664
- Todini & Ferrara (2001) Todini P., Ferrara A., 2001, MNRAS, 325, 726
- Vacca, Cushing & Rayner (2003) Vacca W. D., Cushing M. C., Rayner J. T., 2003, PASP, 115, 389
- Valenti et al. (2008) Valenti S., et al., 2008, ApJ, 673, L155.
- Van Dyk et al. (2016) Van Dyk S. D., et al., 2016, ATel 8693
- Yi et al. (2016) Yi Weimin, Zang Ju-Jia, Wu Xue-Bing, Shappee, B. J., Prieto, J. L., Subo D., 2016, ATel 8655
- Williams (1992) Williams R. E., 1992, AJ, 104, 725
- Wooden et al. (1993) Wooden D. H., Rank D. M., Bregman J, D., Witteborn F. C.. Tielens A. G. G. M., Cohen M., Pinto P. A., Axelrod T. S., 1993, ApJS, 88, 477
- Yang et al. (2016) Yang Y., et al., 2016, ATel 8668