Photoacoustic Sensing of Trapped Fluids in Nanoporous Thin Films: Device Engineering and Sensing Scheme
Abstract
Accessing fluid infiltration in nanogranular coatings is an outstanding challenge, of relevance for applications ranging from nanomedicine to catalysis. A sensing platform, allowing to quantify the amount of fluid infiltrated in a nanogranular ultrathin coating, with thickness in the 10 to 40 nm range, is here proposed and theoretically investigated by multiscale modelling. The scheme relies on impulsive photoacoustic excitation of hypersonic mechanical breathing modes in engineered gas-phase synthesised nanogranular metallic ultathin films and time-resolved acousto-optical read-out of the breathing modes frequency shift upon liquid infiltration. A superior sensitivity, exceeding 26x103 cm2/g, is predicted upon equivalent areal mass loading of a few ng/mm2. The capability of the present scheme to discriminate among different infiltration patterns is discussed. The platform is an ideal tool to investigate nanofluidics in granular materials and naturally serves as a distributed nanogetter coating, integrating fluid sensing capabilities. The proposed scheme is readily extendable to other nanoscale and mesoscale porous materials.
keywords:
Ultrafast opto-mechanics, granular materials, nano-mechanics, nanoporosity, getter materials, Ag nanoparticles, wettability, mass sensingDipartimento di Matematica e Fisica, Università Cattolica del Sacro Cuore, Via Musei 41, 25121 Brescia, Italy \alsoaffiliationLaboratory of Solid State Physics and Magnetism, Department of Physics and Astronomy, KU Leuven, Celestijnenlaan 200D, B-3001 Leuven, Belgium \alsoaffiliationDipartimento di Matematica e Fisica, Università Cattolica del Sacro Cuore, Via Musei 41, 25121 Brescia, Italy \alsoaffiliationLaboratory for Soft Matter and Biophysics, Department of Physics and Astronomy, KU Leuven, Celestijnenlaan 200D, B-3001 Leuven, Belgium \alsoaffiliationDipartimento di Matematica e Fisica, Università Cattolica del Sacro Cuore, Via Musei 41, 25121 Brescia, Italy \alsoaffiliationDipartimento di Matematica e Fisica, Università Cattolica del Sacro Cuore, Via Musei 41, 25121 Brescia, Italy \alsoaffiliationDipartimento di Matematica e Fisica, Università Cattolica del Sacro Cuore, Via Musei 41, 25121 Brescia, Italy
1 Introduction
Nanofluidics in nanoporous coatings is an emerging topic at the forefront of nanotechnology. The subject, at the cross-road of physics, material science and engineering, is of relevance both scientifically1, 2, fluid dynamics at the nanoscale differing significantly from its macroscale counterpart, and from a technological stand point, where applications have been proposed throughout disparate fields, ranging from biotechnology3 and nanomedicine4, 5, 6 to gas storage7, 8 and catalysis9.
In this context nanoporous films have been proposed as new platforms to investigate nanofluidics1 and the related wettability issues10, 11. As for the technological drive, whatever the application, the exploitation of nanoporous getter coatings ultimately relies on their capability to be infiltrated by a fluid12. Despite the demonstrated versatility and wide-spreading of porous thin films, measurements of their permeability remains an outstanding issue.
This issue is primarily tackled by conventional enviromental ellipsometric (EE) porosimetry13, 14 and by gas adsorption measurements.15, 16. Nevertheless information retrieval from these techniques is not straightforward. EE requires surfaces and interfaces of good optical quality and, eventually, exploitation of an index-matching fluid at the interface between the granular film and the supporting substrate (an issue in the frame of porosimetry measurements, where no other liquids should be present other than the one under investigation). For the case of EE the number of free fitting parameters is rather vast 14, 17, 18 and, in several instances, the results may be puzzling to interpret19. For instance, when dealing with metal nano-objects, as in the present case, modelling of the experimental data requires taking into account size-dependent corrections related to the presence of the surface plasmon resonance 18, adding to the complexity of the information retrieval process. Furthermore, EE porosimetry is based on recognition of minute, often spectrally featureless variations of the ellipsometric angles and upon fluid infiltration 20, 21. These facts complicate the recognition of fluid filling levels as opposed, for instance, to a technique exploiting the variation of a specific resonance. Similar difficulties are encountered in interpreting gas adsorption measurements, where the result may be biased by the specific model, among the many available ones22, chosen to fit the adsorption isotherm.
In this work we propose a novel sensing platform aimed at investigating fluid infiltration in nanogranular coatings. We engineer, via atomistic simulations, a gas-phase synthesised nanogranular metallic coating with open-porosity, specifically tailored for efficient ultrafast photoacoustic detection of the filling fluid. The detection scheme relies on impulsive photo-acoustic excitation of the device mechanical breathing modes - in the 50 GHz frequency range - and time-resolved acousto-optical read-out of the frequency shift upon fluid infiltration. From an applicative stand point, the gas-phase synthesised nanogranular metallic scaffold is readily exploitable as a distributed nanogetter coating, integrating fluid sensing capabilities and viable for multi-functionality.23, 24, 25, 26. The production technique is per se competitive owing to its simplicity, high throughput and flexibility.27, 28
2 Materials and methods
Molecular Dynamics. All the simulations have been performed with the LAMMPS package33. The velocity-Verlet algorithm was used to solve the equations of motion and temperature was controlled by a Nosé-Hoover thermostat. The Ag-Ag interactions were described with the 12-6 Lennard-Jones potential of Heinz et al., with cutoff at 8 Å. Further details are reported in the SI.
Film’s effective properties. The physical properties of the granular film have been retrieved by importing the raw xyz Molecular Dynamics (MD) results into MATLAB and by dividing the 3D simulation domain in small voxels. The average pore sizes have been computed by using an ImageJ plugin (BoneJ)35 and the method proposed by Sainto et al. for the bones’ trabeculae analysis36. The effective elastic constants are retrieved by using the MATLAB numerical solver (vpasolve) and the equations provided in the next chapters. Further details are reported in SI.
3 Results and discussion
3.1 Device design
We consider a gas-phase synthesised Ag nanoparticles (NPs) ultrathin film deposited on polydimethylsiloxane (PDMS). It was recently demonstrated that the morphology of these films may be characterised by interconnected, channel-like pores24, thus providing a potentially wettable device. The choice of Ag, although not a stringent one21, is based on the availability of an experimentally validated atomistic model for a virtual film reconstruction from gas-phase deposition parameters24. Moreover, for the Ag case and for film thicknesses in the tens of nm range, these films have been experimentally proven as ultrafast photoacoustic transducers37 with operating acoustic frequencies spanning the range from tens to hundreds of GHz37. A soft polymeric support, such as PDMS, for the granular thin films yields a high acoustic film-substrate mismatch. This increases the film’s breathing mode life time, thus maximising its quality factor. This fact will be further appreciated when discussing the details of the sensing scheme. Additionally, the choice of a soft polymeric support allows for a stick-on/stick-off highly bio-compatible device. The key parameter to tune the porosity of the film is the Kinetic Energy per atom (KE) of the NPs during the deposition process. Indeed, the higher the KE, the higher the NPs deformation upon landing and, consequently, the film’s filling factor. Assuming an average NPs diameter of 7 nm24 111The actual NPs distribution is is peaked at two diameters: 1.5 nm (small NP) and 7 nm (big NP). The big NPs account for 96% of the total deposited mass. The small NPs have been shown to be irrelevant in the reconstruction of the nanogranular thin film scaffold, its morphology, topography and mechanical properties being ruled by the big NPs only. We refer the reader to Ref. 24 for further details on this point., we implemented four different MD simulations, tuning the KE of the NPs-forming atoms across the set of values {0.1, 0.2, 0.3, 0.4} eV/at, the latter range being quite typical in Supersonic Cluster Beam Deposition (SCBD). In brief, each simulation reproduces the landing of 90 NPs of atoms on a 20x35nm2 base domain, for a total of 0.9 million atoms. In gas-phase NP sources, such as a SCBD apparatus, the KE of the NPs can be tuned by varying the source’s geometrical parameters38 and/or carrier gas type and temperature39.
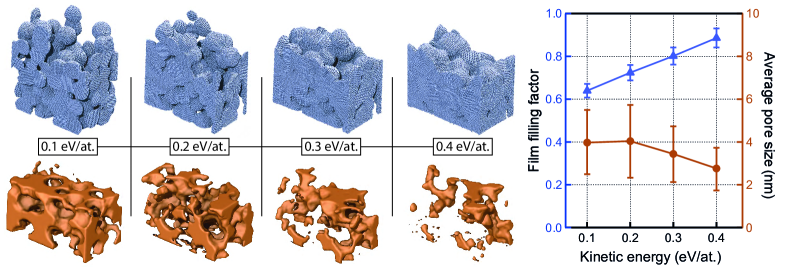
The rendering of the virtual films, resulting from MD simulations, is reported against KE in Figure 1, left panel - top row. The virtual films are composed of NPs (spherical agglomerates in Figure 1 left panel - top row). Every NP is assembled atom-by-atom (the atoms are the smaller spheres visible upon adopting an high magnification for figure inspection). The void scaffolds are reported for increasing KE in Figure 1, left panel - bottom row, the void portion being depicted in orange. The void scaffolds are the complementary of the NPs film scaffolds. For each scaffold, the film filling factor, where is the total volume of all the NPs and is the overall film volume24, and the average pore size36, 40, 35 are reported against KE in Figure 1, right panel, refer to SI for further details. Simulations results show that, decreasing the KE from 0.4 to 0.1 eV/at, the filling factor decreases from 0.9 to 0.64 whereas the void morphology evolves from sparse, mostly clogged pores to an open-pore trabecular-like structure. The average pore size increases from 2.8 to 4 nm and the average film thickness from 25 to 35 nm.
Among the simulated granular films, the best geometrical features for device engineering are achieved for a deposition KE of 0.1eV/at. Indeed, the connected pores morphology, together with the lower =0.64 and the biggest pores of this film - 4 nm average pore diameter - yield maximum sensitivity and higher storage capacity while minimising the pinning-related issues, which impede fluid infiltration inside the film. Finally, a value of KE = 0.1 eV/at. should prevent in-depth NPs implantation in PDMS, as is expected for instance for KE=0.5 eV/at.41. We will henceforth contextualise the discussion focusing on the Ag granular ultrathin film of thickness =35 nm obtained with KE = 0.1 eV/at.
3.2 Sensing scheme
The sensor working principle relies on ultrafast photoacousics42, among the emerging techniques for mechanical nanometrology in a variety of systems ranging from phononic crystals43, 44, 45, ultrathin-films46, 47, 48, to multilayer tube49 and granular materials50. The transduction scheme is as follows: in the excitation step (opto-acoustic transduction) an ultrafast IR laser pump pulse illuminates the device. The energy absorbed by the granular metallic film leads to an impulsive lattice temperature increase of the order of a few Kelvins, avoiding any annealing effect.222This value is obtained accounting for the typical fluences and repetition rates in use in Fiber-Laser 37 or Ti:sapphire oscillator based set-ups 51.. The subsequent thermal expansion excites the film’s breathing modes at their frequencies , being the mode order. The excited breathing modes decay with time-constants , radiating acoustic waves into the substrate. In the detection step the excited breathing modes modulate the film’s dielectric constants (acousto-optic transduction). The acoustic oscillations are ultimately encoded in the relative reflectivity/transmissivity variations, /, as measured by a time-delayed probe pulse, the time-delay being with respect to the instant of the pump-pulse arrival =037. Here =-, where is the reflectivity/transmissivity at time-delay and the reflectivity/transmissivity of the unexcited sample (static reflectivity/transmissivity). The contribution of the breathing mode to the time-resolved optical trace, once thermal effects are filtered out, is well mimicked by:
| (1) |
where is the Heaviside step function, , , and the breathing mode life-time, frequency, phase and amplitude contribution to the optical signal respectively. Calculating the magnitude of the Fourier transform (FT) of the time resolved trace given by Eq. 1, under the assumption , we obtain the following resonance line shape:
| (2) |
We refer the reader to SI for further details on this point.
The quantities ruling the resonance, and of relevance to the present discussion, are , and their interplay synthesised by the quality factor . With this notion in mind, we now inspect the device acoustic properties within the frame of the effective medium approximation (EMA). The granular NPs thin film, weather fluid-infiltrated or not, is modelled as an effective homogeneous and isotropic thin film of effective density, , and effective stiffness tensor, . The longitudinal sound velocity is , where is the first element of the film effective stiffness tensor. The acoustic impedance reads . The granular film adheres on a PDMS substrate of acoustic impedance . Within this frame, the relevant breathing mode parameters read:
| (3) |
| (4) |
| (5) |
We refer the reader to SI for further details on the model and equations derivation.
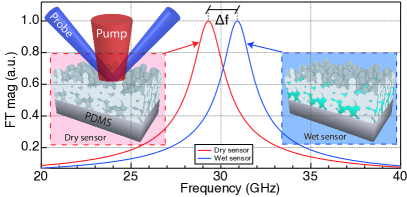
A “dry” device is characterised by a resonance centred at a frequency and with decay-time (we dropped the mode index for brevity). Upon fluid infiltration in the granular film, both and increase, leading to a resonance of frequency and lifetime . For the sake of exemplification we here anticipate results that will be derived further on. Figure 2 reports the FT modulus of the fundamental breathing mode, n=1, expected for the dry (red resonance) and for the fully water infiltrated - fully wet - device (blue resonance). Upon full water filling the resonance shifts by an amount =-=1.61 GHz and the linewidth decreases from = 2.83 GHz to =2.68 GHz, where is the resonance’s FWHM. The frequency shift and the decay time variations thus allow to quantify the amount of infiltrated fluid. The resonance frequency is first measured on the bare device (dry configuration). The device is then loaded (wet configuration) and its resonance frequency measured. The resonance frequencies of the dry and wet device are hence acquired in separate measurement sessions.333This is at variance with respect to the problem of separating two peaks from a signal which is the superposition of them, such as resolving the two diffraction peaks in a double slit optical diffraction experiment.. The minimum resolvable shift has thus to be considered as the error in the estimation of the peaks centers. The higher the resonance Q-factor, the smaller is the error in the peak center estimation, a high Q-factor thus being a desirable feature.
3.3 The Practical Case
In general, the detection strategy is based on resolving the resonance frequencies between the wet and dry configurations, linking to the amount of filling fluid. We here illustrate the strategy for the paradigmatic case of water adsorption, the idea being alike for other fluids. We chose water owing to its relevance in biology and bio-related applications. We consider the optimised device, i.e., the one obtained with KE of 0.1eV/at. The interconnected porous structure and pores size allow for a homogeneous water distribution in the whole accessible volume, thus justifying an EMA approach (see SI for further information on this point); other infiltration scenarios will be addressed further on. The device is therefore considered as an effective homogeneous and isotropic film of effective density, , effective shear, , and bulk, , modulus (the effective stiffness tensor being completely defined by and within the EMA). These quantities depend of the amount of infiltrated water. The density is obtained as a weighted mean of the silver and water densities ( and respectively) on the corresponding occupied volume in the scaffold: . The relative loading, , is the infiltrated water volume, , normalized against the total volume available for infiltration, . and are retrieved numerically solving Budiansky equations 52:
| (6) | |||
where the index runs over the materials composing the effective film (i = Ag, water, voids); and are the constituents bulk and shear modulus; are the constituents normalised concentrations: , and . We stress that and , are both functions of the loading . This dependence has been omitted in Eq. 6 for ease of visualisation. is a function of through the equality . All the above-mentioned materials parameters are reported in SI. We are therefore in the position to calculate , and of the first two breathing modes, =1 and =2, as a function of the relative loading (see Equations 3, 4 and 5).
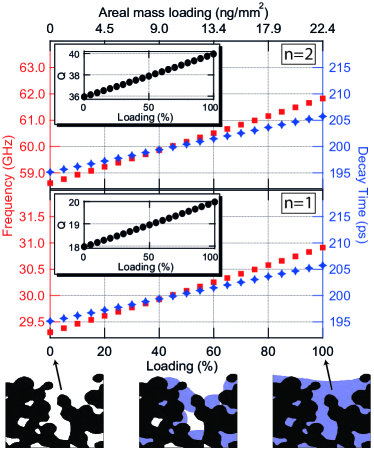
The results are reported in Figure 3. The frequencies are linear with (red squares, left vs bottom axis), so as the frequency shifts, =-. The decay times (blue diamonds) are mode-independent and, consistently, (see insets of Figure 3). The high value of , as compared to the values recently reported on similar systems37, , stems from the tailored choice of the substrate material. A soft substrate maximises the acoustic impedance mismatch, the device approaching the ideal free-standing case.
We now focus on the device sensitivity issue. Making the necessary changes from Ref. 53, we introduce as a sound definition to quantify the device’s sensitivity to liquid infiltration. Provided the linearity of (see Figure 3) and that , the sensitivity reads . Furthermore, the sensitivity is thickness- and mode-independent: from Eq. 3 where no dependence on and appears. On the contrary is mode-dependent, as shown in the insets of Figure 3. As previously mentioned, a high is a desirable feature to minimise the error in frequency shift read-out, thus privileging higher modes for sensing purposes.
For the sake of comparison against typical figures of merit53, 44, we introduce the areal mass loading . The value quantifies the mass of infiltrated water normalized on the device’s unit area. The standard sensitivity to mass-loading definition reads53 . Holding the same approximations discussed to evaluate , the mass sensitivity reads cm2/g. The latter figure can be further increased, since it scales as ( is h-independent). A minimum value of h in excess of 14 nm is a realistic figure, granting a film with a fully developed granularity 24.
For the sake of comparison, we note that the proposed device sensitivity outperforms, by three orders of magnitude, that of commercially available quartz crystal microbalances (QCM) and, by an order of magnitude, that of flexural plate wave (FPW) devices, see Table 1.
| Device type | (GHz) | |
|---|---|---|
| NOT | ||
| QCM | 14 | |
| FPW | 951 |
The frequency vs loading curves are well within the detectability range of current ultrafast photo-acoustic technology. In Figure 3 we calculated the device response discretising the liquid loading in steps of 5, resulting in frequencies separated by 0.1 GHz for the n=1 case (0.2 GHz for n=2). Nevertheless, the frequency resolution which may be achieved with state-of-the art photo-acoustic technology is way higher. For instance, subharmonic resonant optical excitation of acoustic modes in thin membranes allows resolving frequency shifts with megahertz resolution.55. The minimum detectable infiltrated liquid variation reads . Taking 1 MHz, 0.05 and 29.5 GHz for mode =1 we find 7. This value can be further decreased exploiting higher modes, in fact scales as . This fact may be readably appreciated comparing the slopes of the frequency vs loading curves for the and reported in Figure 3.
As opposed to Inter Digital Transducer (IDT) technology, within the present sensing scheme acoustic wave generation, detection and sensing of the infiltrated fluid take place in the same active region, identified by the probe beam spot size. This fact favours miniaturization and allows working with minute quantities of total infiltrated fluid. For instance, assuming a typical probe beam diameter of 10 m a fully infiltrated active area is tantamount to 1 femtoliter of infiltrated fluid.
3.4 Discriminating among different infiltration patterns
In the previous discussion we assumed a homogeneous infiltration scheme. We now argue that the proposed sensing platform may be exploited to gain insight into the fluid infiltration pattern, a yet unsolved issue in nanoporous materials and forming the object of extensive research.13, 56, 57 Let’s analyse the layered infiltration pattern which comprises two scenarios. The “water layer on top” (L-TOP) scenario consists of a water infiltrated layer sitting on top of an empty one (see inset at bottom-left corner of Figure 4). This situation might be expected for high filling factors, such as the one predicted for KE of 0.4eV/at. In this situation some inner pores might be clogged and not accessible, as suggested by Bisio et al. 14. The opposite scenario, “water layer on bottom” (L-BOT), consists in a water infiltrated layer sitting on the polymeric substrate and covered by an empty layer on top (see inset in top-left corner of Figure 4). This scenario might arise, for instance, when water starts evaporating from a fully infiltrated scaffold. In this context one may for instance follow the evaporation process as it takes place, tracking in time the loading curve evolution. We pinpoint that, for the case of a fully infiltrated device, the L-TOP and L-BOT scenario coincide.
The stratified scenario is conveniently modelled as two effective media in series deposited on a semi-infinite substrate, the effective media mimicking the fully wet (fully water infiltrated-Ag scaffold: Ag and water filled voids) and dry layers (non-infiltrated Ag scaffold: Ag and empty voids). For the layered-case the breathing mode frequency and decay time read =Re/2 and =1/Im respectively, where the complex-valued is the root of the following equation 37:
| (7) |
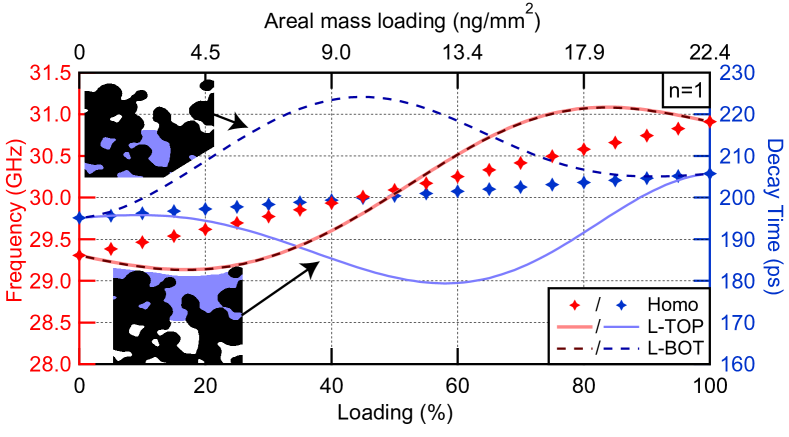
The subscripts t, b and s stand for top layer, bottom layer and substrate respectively; is the acoustic reflection amplitude between the and -indexed layers and , and the -indexed layer acoustic impedance, longitudinal sound velocity and thickness respectively. for the fully dry and wet layers (corresponding to the homogeneous wetting case of l=0 and l=100% respectively) are calculated from Equation 6, whereas equals and for the dry and wet layers respectively. These quantities allow calculating , and , . The total film thickness is . The relative water loading reads =/ for the L-TOP case (=/ for L-BOT) . For sake of comparison, we analyse the acoustic response keeping the same scaffold as in the homogeneous wetting case, i.e. the one obtained for KE = 0.1 eV/at. The breathing mode frequency, , and decay time, , for the n=1 mode, obtained upon numerical solution of Equation 7, are reported in Figure 4. As opposed to the homogeneous wetting case, both and are non linear vs .
The L-TOP and L-BOT are characterised by the same vs loading curve (continous and dashed red lines respectively in Figure 4). This is due to the fact that, with regards to , the boundary condition at the nanoporous film-PDMS interface is substantially stress free. With respect to the device behaves as a free-standing layered membrane, resulting in a symmetric situation between the L-TOP and L-BOT scenarios.
Conversely, the vs loading curves (continous and dashed blue lines in Figure 4) show opposite trends in the L-TOP and L-BOT scenarios. In particular, whatever the quantity of adsorbed water, is smallest for the L-TOP scenario, is biggest for the L-BOT scenario and sits between the two for the homogeneous filling case. The physical explanation has to do with the acoustic impedance jumps across the device thickness. The smoother are the impedance changes across the device, the highest is the acoustic wave transmission to the PDMS substrate, hence the lower is the breathing mode damping time. In the L-TOP scenario the acoustic impedance decreases across the sample from the device free-surface all the way into the PDMS layer: . This scenario maximises acoustic transmission from the device to the substrate, hence leading to the lowest decay times. The L-BOT scenario is characterised by the greatest acoustic impedance jumps across the sample: and , hence leading to the longest decay times. The homogeneous filling case lays in between: where , the nanoporous film acoustic impedance for the homogeneous water infiltration case, ranges between the fully wet and dry device, corresponding to l=0 and l=100% respectively. The cases for n=2 and n=3 are discussed in SI.
The curves thus allow discriminating between homogeneous and layered infiltration scenarios. As for the latter, the L-TOP and L-BOT cases may be differentiated on the basis of the (or ) curves. This proves the potential of the present strategy in uncovering the fluid infiltration pattern in nanoporous materials.
4 Conclusions
We designed a novel sensing platform allowing to quantify the amount of fluid infiltrated in a nanoporous coating. The platform is based on a gas-phase synthesised nanogranular metallic coating with open-porosity, specifically engineered via molecular-dynamics for efficient ultrafast photoacoustic detection of the filling fluid. For the paradigmatic case of water filling we predict a sensitivity exceeding 26103 cm2/g, upon equivalent areal mass loading of few ng/mm2, outperforming current microbalance-based technology by three orders of magnitude. The predictions are robust, the theoretical frame having been recently benchmarked against experiments24, and ultrafatst photoacoustic read-out of mechanical resonances in metallic nanoporous coatings demonstrated37.
The nanogranular metallic scaffold is readily exploitable as a distributed nanogetter coating, integrating fluid sensing capabilities and serving as a stick-on/stick-off highly bio-compatible device. The film may be deposited on virtually any surface while varying the metal composition27, 28, allowing to foresee integration of the fluid sensing capabilities with a variety of applications23, 24, 26. The present strategy, relying on the variation of a specific acoustic resonance upon fluid infiltration, provides data that are intrinsically simpler to interpret as compared to existing techniques such as EE and gas adsorption-based porosimetry. For this reason it might serve as a valid alternative/complement to current technologies.
Finally, we showed that the proposed sensing scheme allows discriminating among different filling patterns, providing a means to investigate pinning-related issues of relevance for nanoporous membrane wettability.
The present scheme is general and easily implementable. It may be expanded to other emerging gas-phase synthesized granular materials29 and extended to materials with mesoscale porosity30, 31, 32. In perspective, the present scheme could be expanded to include granular multi-layers synthesized with different metals. This would allow expanding the range of exploitable acoustic parameters so as to fine-tune the loading curve when choosing other substrate materials, for instance by engineering an acoustic-impedance graded device. Furthermore, this strategy would allow to exploit a Ti granular film as an adhesion layer to increase the overall device sticking-factor when working with rigid substrates. The sensing apparatus may be implemented taking advantage of readily available compact, table-top sources relying on superior sampling speed and telecom technology - such as the ASOPS technique46, 58 - and EUV coherent sources granting superior photoacoustic sensitivity59, 60.
5 Supporting Information
Device design details (MD details, Filling factor, Volume and thickness, pore size), Sensing scheme (Derivation of Eq.2 and its applicability, Details of the model: derivation of Eq.s 3 and 4, A possible mechanism to convey water to the device), The Practical Case (Materials constant, Layered cases for n3).
6 Acknowledgements
G.B. acknowledges financial support from the Research Foundation Flanders (FWO). C.C. and F.B. acknowledge financial support from the MIUR Futuro in ricerca 2013 Grant in the frame of the ULTRANANO Project (project number: RBFR13NEA4). F.B. and C.G. acknowledge support from Università Cattolica del Sacro Cuore through D.2.2 and D.3.1 grants. F.B. acknowledge financial support from Fondazione E.U.L.O. C.C. acknowledges financial support from Programma Operativo Nazionale 2007-2013 “Ricerca e competitività” financed by EU through project PON04a2_00490 “Ricerca Applicata a Reti di comunicazione M2M e modem integrati innovativi dedicati a servizi avanzati per le Smart Cities - M2M Netergit”, and computational support from PRACE for awarding access to Marconi hosted at CINECA, Italy, through project UNWRAP (call 14), and ISCRA through project UNWRAPIT.
References
- Bocquet and Charlaix 2010 Bocquet, L.; Charlaix, E. Nanofluidics, From Bulk to Interfaces. Chem. Soc. Rev. 2010, 39, 1073–1095
- Schoch et al. 2008 Schoch, R. B.; Han, J.; Renaud, P. Transport Phenomena in Nanofluidics. Rev. Mod. Phys. 2008, 80, 839–883
- Zhang et al. 2016 Zhang, H.; Tian, Y.; Jiang, L. Fundamental Studies and Practical Applications of Bio-Inspired Smart Solid-State Nanopores and Nanochannels. Nano Today 2016, 11, 61 – 81
- van den Berg and Wessling 2007 van den Berg, A.; Wessling, M. Nanofluidics: Silicon for the Perfect Membrane. Nature 2007, 445, 726
- Adiga et al. 2009 Adiga, S. P.; Jin, C.; Curtiss, L. A.; Monteiro-Riviere, N. A.; Narayan, R. J. Nanoporous Membranes for Medical and Biological Applications. Wiley Interdiscip. Rev. Nanomed. Nanobiotechnol. 2009, 1, 568–581
- Kholmanov et al. 2012 Kholmanov, I. N.; Stoller, M. D.; Edgeworth, J.; Lee, W. H.; Li, H.; Lee, J.; Barnhart, C.; Potts, J. R.; Piner, R.; Akinwande, D.; Others, Nanostructured Hybrid Transparent Conductive Films With Antibacterial Properties. ACS Nano 2012, 6, 5157–5163
- Kumar et al. 2017 Kumar, K. V.; Preuss, K.; Titirici, M.-M.; Rodriguez-Reinoso, F. Nanoporous Materials for the Onboard Storage of Natural Gas. Chem. Rev. 2017, 117, 1796–1825, PMID: 28094515
- Morris and Wheatley 2008 Morris, R. E.; Wheatley, P. S. Gas Storage In Nanoporous Materials. Angew. Chem. Int. Ed. 2008, 47, 4966–4981
- Bau and Takanabe 2017 Bau, J. A.; Takanabe, K. Ultrathin Microporous SiO2 Membranes Photodeposited on Hydrogen Evolving Catalysts Enabling Overall Water Splitting. ACS Catal. 2017, 7, 7931–7940
- Ceratti et al. 2015 Ceratti, D. R.; Faustini, M.; Sinturel, C.; Vayer, M.; Dahirel, V.; Jardat, M.; Grosso, D. Critical Effect of Pore Characteristics on Capillary Infiltration in Mesoporous Films. Nanoscale 2015, 7, 5371–5382
- Chen et al. 2015 Chen, C.; Xu, X.; Li, Y.; Jans, H.; Neutens, P.; Kerman, S.; Vereecke, G.; Holsteyns, F.; Maes, G.; Lagae, L.; Stakenborg, T.; van Dorpe, P. Full Wetting of Plasmonic Nanopores Through Two-Component Droplets. Chem. Sci. 2015, 6, 6564–6571
- Mercuri et al. 2017 Mercuri, M.; Pierpauli, K. A.; Berli, C. L.; Bellino, M. G. An Open Pit Nanofluidic Tool: Localized Chemistry Assisted by Mesoporous Thin Film Infiltration. ACS Appl. Mater. Interfaces 2017, 9, 16679–16684, PMID: 28463480
- Boissiere et al. 2005 Boissiere, C.; Grosso, D.; Lepoutre, S.; Nicole, L.; Bruneau, A. B.; Sanchez, C. Porosity and Mechanical Properties of Mesoporous Thin Films Assessed by Environmental Ellipsometric Porosimetry. Langmuir 2005, 21, 12362–12371
- Bisio et al. 2010 Bisio, F.; Prato, M.; Cavalleri, O.; Barborini, E.; Mattera, L.; Canepa, M. Interaction of Liquids with Nanoporous Cluster Assembled Au Films. J. Phys. Chem. C 2010, 114, 17591–17596
- Mooney et al. 1952 Mooney, R. W.; Keenan, A. G.; Wood, L. A. Adsorption of Water Vapor by Montmorillonite. I. Heat of Desorption and Application of BET Theory. J. Am. Chem. Soc. 1952, 74, 1367–1371
- Foo and Hameed 2010 Foo, K.; Hameed, B. Insights Into the Modeling of Adsorption Isotherm Systems. Chem. Eng. J. 2010, 156, 2–10
- Toccafondi et al. 2014 Toccafondi, C.; Uttiya, S.; Cavalleri, O.; Gemme, G.; Barborini, E.; Bisio, F.; Canepa, M. Optical Properties of Nanogranular and Highly Porous TiO2 Thin Films. J. Phys. D: Appl. Phys. 2014, 47, 485301
- Cavaliere et al. 2017 Cavaliere, E.; Benetti, G.; Van Bael, M. J.; Winckelmans, N.; Bals, S.; Gavioli, L. Exploring the Optical and Morphological Properties of Ag and Ag/TiO2 Nanocomposites Grown by Supersonic Cluster Beam Deposition. Nanomat. 2017, 7, 442
- Jungk 1993 Jungk, G. Possibilities and Limitations of Ellipsometry. Thin Solid Films 1993, 234, 428–431
- Bisio et al. 2009 Bisio, F.; Palombo, M.; Prato, M.; Cavalleri, O.; Barborini, E.; Vinati, S.; Franchi, M.; Mattera, L.; Canepa, M. Optical Properties of Cluster-Assembled Nanoporous Gold Films. Phys. Rev. B 2009, 80, 205428
- Bisio et al. 2011 Bisio, F.; Prato, M.; Barborini, E.; Canepa, M. Interaction of Alkanethiols With Nanoporous Cluster-Assembled Au Films. Langmuir 2011, 27, 8371–8376
- Quirk 1955 Quirk, J. P. Significance Of Surface Areas Calculated From Water Vapor Sorption Isotherms By Use Of The B.E.T. Equation. Soil Sci. 1955, 80, 423–430
- Bettini et al. 2017 Bettini, L. G.; Bellacicca, A.; Piseri, P.; Milani, P. Supersonic Cluster Beam Printing of Carbon Microsupercapacitors on Paper. Flexible Printed Electron. 2017, 2, 025002
- Benetti et al. 2017 Benetti, G.; Caddeo, C.; Melis, C.; Ferrini, G.; Giannetti, C.; Winckelmans, N.; Bals, S.; Van Bael, M. J.; Cavaliere, E.; Gavioli, L.; Banfi, F. Bottom-Up Mechanical Nanometrology of Granular Ag Nanoparticles Thin Films. J. Phys. Chem. C 2017, 121, 22434–22441
- Galvanetto et al. 2018 Galvanetto, N.; Perissinotto, A.; Pedroni, A.; Torre, V. Fodis: Software for Protein Unfolding Analysis. Biophys. J. 2018, 114, 1264–1266
- Borghi et al. 2018 Borghi, F.; Podestá, A.; Piazzoni, C.; Milani, P. Growth Mechanism of Cluster-Assembled Surfaces: From Submonolayer to Thin-Film Regime. Phys. Rev. Appl 2018, 9, 044016
- Benetti et al. 2017 Benetti, G.; Cavaliere, E.; Canteri, A.; Landini, G.; Rossolini, G. M.; Pallecchi, L.; Chiodi, M.; Van Bael, M. J.; Winckelmans, N.; Bals, S.; Gavioli, L. Direct Synthesis of Antimicrobial Coatings Based on Tailored Bi-Elemental Nanoparticles. APL Mat. 2017, 5, 036105
- Corbelli et al. 2011 Corbelli, G.; Ghisleri, C.; Marelli, M.; Milani, P.; Ravagnan, L. Highly Deformable Nanostructured Elastomeric Electrodes With Improving Conductivity Upon Cyclical Stretching. Adv. Mat. 2011, 23, 4504–4508
- Nasiri et al. 2015 Nasiri, N.; Elmøe, T. D.; Liu, Y.; Qin, Q. H.; Tricoli, A. Self-Assembly Dynamics and Accumulation Mechanisms of Ultra-Fine Nanoparticles. Nanoscale 2015, 7, 9859–9867
- Voti et al. 2015 Voti, R. L.; Leahu, G.; Larciprete, M.; Sibilia, C.; Bertolotti, M.; Nefedov, I.; Anoshkin, I. Photoacoustic Characterization of Randomly Oriented Silver Nanowire Films. Int. J. Thermophys. 2015, 36, 1342–1348
- de Castro et al. 2018 de Castro, L. D. C.; Larocca, N. M.; Pessan, L. A. Towards the Development of Superhydrophilic SiO2-Based Nanoporous Coatings: Concentration and Particle Size Effect. Thin Solid Films 2018, 651, 138–144
- Lamastra et al. 2017 Lamastra, F.; Grilli, M.; Leahu, G.; Belardini, A.; Voti, R. L.; Sibilia, C.; Salvatori, D.; Cacciotti, I.; Nanni, F. Diatom Frustules Decorated With Zinc Oxide Nanoparticles for Enhanced Optical Properties. Nanotechnology 2017, 28, 375704
- Plimpton 1995 Plimpton, S. Fast Parallel Algorithms for Short-Range Molecular Dynamics. J. Comput. Phys. 1995, 117, 1–19
- Heinz et al. 2008 Heinz, H.; Vaia, R. A.; Farmer, B. L.; Naik, R. R. Accurate Simulation of Surfaces and Interfaces of Face-Centered Cubic Metals Using 12-6 and 9-6 Lennard-Jones Potentials. J. Phys. Chem. C 2008, 112, 17281–17290
- Doube et al. 2010 Doube, M.; Kłosowski, M. M.; Arganda-Carreras, I.; Cordelières, F. P.; Dougherty, R. P.; Jackson, J. S.; Schmid, B.; Hutchinson, J. R.; Shefelbine, S. J. BoneJ: Free and extensible bone image analysis in ImageJ. Bone 2010, 47, 1076–1079
- Saito and Toriwaki 1994 Saito, T.; Toriwaki, J.-I. New Algorithms for Euclidean Distance Transformation of an N-Dimensional Digitized Picture With Applications. Pattern Recognit. 1994, 27, 1551 – 1565
- Peli et al. 2016 Peli, S.; Cavaliere, E.; Benetti, G.; Gandolfi, M.; Chiodi, M.; Cancellieri, C.; Giannetti, C.; Ferrini, G.; Gavioli, L.; Banfi, F. Mechanical Properties of Ag Nanoparticle Thin Films Synthesized by Supersonic Cluster Beam Deposition. J. Phys. Chem. C 2016, 120, 4673–4681
- Vahedi Tafreshi et al. 2002 Vahedi Tafreshi, H.; Piseri, P.; Barborini, E.; Benedek, G.; Milani, P. Simulation on the Effect of Brownian Motion on Nanoparticle Trajectories in a Pulsed Microplasma Cluster Source. J. Nanopart. Res. 2002, 4, 511–524
- Mazza et al. 2011 Mazza, T.; Devetta, M.; Milani, P.; Bongiorno, G.; Coreno, M.; Piseri, P. Accessing the Fractal Dimension of Free Clusters in Supersonic Beams. New J. Phys. 2011, 13, 023009
- Hildebrand and Rüegsegger 1997 Hildebrand, T.; Rüegsegger, P. A New Method for the Model-Independent Assessment of Thickness in Three-Dimensional Images. J. Microsc. 1997, 185, 67–75
- Ravagnan et al. 2009 Ravagnan, L.; Divitini, G.; Rebasti, S.; Marelli, M.; Piseri, P.; Milani, P. Poly (Methyl Methacrylate)–Palladium Clusters Nanocomposite Formation by Supersonic Cluster Beam Deposition: a Method for Microstructured Metallization of Polymer Surfaces. J. Phys. D: Appl. Phys. 2009, 42, 082002
- Matsuda et al. 2015 Matsuda, O.; Larciprete, M. C.; Voti, R. L.; Wright, O. B. Fundamentals of Picosecond Laser Ultrasonics. Ultrasonics 2015, 56, 3–20
- Travagliati et al. 2015 Travagliati, M.; Nardi, D.; Giannetti, C.; Gusev, V.; Pingue, P.; Piazza, V.; Ferrini, G.; Banfi, F. Interface Nano-Confined Acoustic Waves in Polymeric Surface Phononic Crystals. Appl. Phys. Lett. 2015, 106, 021906
- Nardi et al. 2012 Nardi, D.; Zagato, E.; Ferrini, G.; Giannetti, C.; Banfi, F. Design of a Surface Acoustic Wave Mass Sensor in the 100 GHz Range. Appl. Phys. Lett. 2012, 100, 253106
- Mante et al. 2014 Mante, P.-A.; Chen, C.-C.; Wen, Y.-C.; Chen, H.-Y.; Yang, S.-C.; Huang, Y.-R.; Ju Chen, I.; Chen, Y.-W.; Gusev, V.; Chen, M.-J.; Kuo, J.-L.; Sheu, J.-K.; Sun, C.-K. Probing Hydrophilic Interface of Solid/Liquid-Water by Nanoultrasonics. Sci. Rep. 2014, 4, 6249
- Nardi et al. 2015 Nardi, D.; Travagliati, M.; Murnane, M. M.; Kapteyn, H. C.; Ferrini, G.; Giannetti, C.; Banfi, F. Impulsively Excited Surface Phononic Crystals: a Route Toward Novel Sensing Schemes. IEEE Sens. J. 2015, 15, 5142–5150
- Hoogeboom-Pot et al. 2016 Hoogeboom-Pot, K. M.; Turgut, E.; Hernandez-Charpak, J. N.; Shaw, J. M.; Kapteyn, H. C.; Murnane, M. M.; Nardi, D. Nondestructive Measurement of the Evolution of Layer-Specific Mechanical Properties in Sub-10 nm Bilayer Films. Nano Lett. 2016, 16, 4773–4778
- Grossmann et al. 2017 Grossmann, M.; Schubert, M.; He, C.; Brick, D.; Scheer, E.; Hettich, M.; Gusev, V.; Dekorsy, T. Characterization of Thin-Film Adhesion and Phonon Lifetimes in Al/Si Membranes by Picosecond Ultrasonics. New J. Phys. 2017, 19, 053019
- Brick et al. 2017 Brick, D.; Engemaier, V.; Guo, Y.; Grossmann, M.; Li, G.; Grimm, D.; Schmidt, O. G.; Schubert, M.; Gusev, V. E.; Hettich, M.; Dekorsy, T. Interface Adhesion and Structural Characterization of Rolled-up GaAs/In 0.2 Ga 0.8 As Multilayer Tubes by Coherent Phonon Spectroscopy. Sci. Rep. 2017, 7, 5385
- Avice et al. 2017 Avice, J.; Boscher, C.; Vaudel, G.; Brotons, G.; Juv , V.; Edely, M.; M thivier, C.; Gusev, V. E.; Belleville, P.; Piombini, H.; Ruello, P. Controlling the Nanocontact Nature and the Mechanical Properties of a Silica Nanoparticle Assembly. J. Phys. Chem. C 2017, 121, 23769–23776
- Caddeo et al. 2017 Caddeo, C.; Melis, C.; Ronchi, A.; Giannetti, C.; Ferrini, G.; Rurali, R.; Colombo, L.; Banfi, F. Thermal Boundary Resistance From Transient Nanocalorimetry: A Multiscale Modeling Approach. Phys. Rev. B 2017, 95, 085306
- Budiansky 1965 Budiansky, B. On the Elastic Moduli of Some Heterogeneous Materials. J. Mech. Phys. Solids 1965, 13, 223–227
- Vellekoop 1998 Vellekoop, M. J. Acoustic Wave Sensors and Their Technology. Ultrasonics 1998, 36, 7–14
- Cheeke and Wang 1999 Cheeke, J.; Wang, Z. Acoustic Wave Gas Sensors. Sens. Actuators, B 1999, 59, 146–153
- Bruchhausen et al. 2011 Bruchhausen, A.; Gebs, R.; Hudert, F.; Issenmann, D.; Klatt, G.; Bartels, A.; Schecker, O.; Waitz, R.; Erbe, A.; Scheer, E.; Huntzinger, J.-R.; Mlayah, A.; Dekorsy, T. Subharmonic Resonant Optical Excitation of Confined Acoustic Modes in a Free-Standing Semiconductor Membrane at GHz Frequencies with a High-Repetition-Rate Femtosecond Laser. Phys. Rev. Lett. 2011, 106, 077401
- Huang et al. 2017 Huang, P.; Chang, W.-S.; Ansell, M. P.; John, C. Y. M.; Shea, A. Porosity estimation of Phyllostachys edulis (Moso bamboo) by computed tomography and backscattered electron imaging. Wood Sci. Technol. 2017, 51, 11–27
- Zhang et al. 2017 Zhang, P.; Li, J.; Lu, S.; Xue, H.; Zhang, J.; Yang, J. A Precise Porosity Measurement Method for Oil-Bearing Micro/Nano Porous Shales Using Low-Field Nuclear Magnetic Resonance (LF-NMR). J. Nanosci. Nanotechnol. 2017, 17, 6827–6835
- Schubert et al. 2012 Schubert, M.; Grossmann, M.; Ristow, O.; Hettich, M.; Bruchhausen, A.; Barretto, E. C.; Scheer, E.; Gusev, V.; Dekorsy, T. Spatial-Temporally Resolved High-Frequency Surface Acoustic Waves on Silicon Investigated by Femtosecond Spectroscopy. Appl. Phys. Lett. 2012, 101, 013108
- Nardi et al. 2013 Nardi, D.; Hoogeboom-Pot, K. M.; Hernandez-Charpak, J. N.; Tripp, M.; King, S. W.; Anderson, E. H.; Murnane, M. M.; Kapteyn, H. C. Probing Limits of Acoustic Nanometrology Using Coherent Extreme Ultraviolet Light. Metrology, Inspection, and Process Control for Microlithography XXVII. 2013; p 86810N
- Nardi et al. 2011 Nardi, D.; Travagliati, M.; Siemens, M. E.; Li, Q.; Murnane, M. M.; Kapteyn, H. C.; Ferrini, G.; Parmigiani, F.; Banfi, F. Probing Thermomechanics at the Nanoscale: Impulsively Excited Pseudosurface Acoustic Waves in Hypersonic Phononic Crystals. Nano Lett. 2011, 11, 4126–4133