Time evolution of the X-ray and -ray fluxes of the Crab pulsar
Abstract
We studied the evolution of the X-ray and -ray spectra of the Crab pulsar utilizing the 11-year observations from the Rossi X-ray Timing Explorer (RXTE) and 9-year observations from the Fermi Gamma-ray Space Telescope (FGST). By fitting the spectrum of each observation, we obtained the corresponding flux, and then analysed the long term evolution of the X-ray (or -ray) luminosities as well as their correlations with the spin down power of the pulsar. The X-ray flux in 5–60 keV obtained by the Proportional Counter Array (PCA) of RXTE decreases with a rate of erg cm-2 s-1 per day. The X-ray flux in 15-250 keV obtained by the High Energy X-ray Timing Experiment (HEXTE) of RXTE and the -ray flux in 0.1–300 GeV by the Large Area Telescope (LAT) onboard FGST show similar decreasing trend, but are unsignificant statistically. The 5–60 keV X-ray luminosity is correlated with the spin down power by , which is similar to the statistical results for young pulsars.
1 Introduction
Much effort has been devoted to statistical studies of pulsar high energy emission properties, with particular emphasis on the efficiency of the conversion of the pulsar spin down power into X-ray and -ray luminosities, so as to test the pulsar emission models and to predict the properties of a specific source. Previous studies show the X-ray luminosities of pulsars have a correlation with their spin down power . Seward & Wang (1988) first found that the 0.2–4 keV X-ray luminosity . Becker & Trmper (1997) used 27 pulsars detected in 0.1–2.4 keV and found that . In the higher energy band, Saito (1998) gave the relation in 2–10 keV, but Possenti et al. (2002) obtained a relation of in the same energy band using a larger sample of 39 pulsars. However, all the X-ray luminosities above contain the emission from the pulsar wind nebula (PWN), which is nonpulsed and often dominates the nonthermal emission of pulsars. To eliminate the influence of the PWN emission, Cheng & Zhang (1999) presented the empirical relation between the pulsed luminosity and the spin down power, i.e. in 2–10 keV. Because of the improvement of spatial resultion of detectors, Cheng et al. (2004) divided the total X-ray emission into pulsed and nonpulsed components, and found that the pulsed component follows in 2–10 keV, which is more gentle than the nonpulsed component and can be explained by the outer gap radiation model (Zhang & Jiang, 2006). By using the Chandra and XMM-Newton observations, Li et al. (2008) resolved the pulsar X-ray emission from that of the PWNe and got in the same energy band. The relation between the pulsar -ray luminosity and the spin down luminosity are different from that in the X-ray band. Saito et al. (1997) obtained , and Marelli et al. (2011) further found that the relation between () and () could not be represented by a single linear function. These correlations are in accord with the expectation that the X-ray and -ray emission of a pulsar is at the expense of rotational energy. This could be from magnetosphere and near the light cylinder (Becker & Trmper, 1997; Malov, 2003). Specific predictions of the correlations for emission from outside the light cylinder have not yet been given.
However, all the previous results are obtained from the statistics of pulsar samples. The different properties of these pulsars, such as ages, magnetic field strengths, masses, and directions of the magnetic and rotation axes, bring complexity to these relations, which may in turn make it more difficult to understand the physics process behind. Therefore, to obtain the exact dependence of the high energy luminosity on the evolutionary spin down power of a specific pulsar in a long time span could provide much purer information for pulsar physics study.
Among all the pulsars, the Crab pulsar is the most suitable source for such studies, because it has been frequently and comprehensively studied in almost all wavelength bands from radio to very high energy -rays. Recently, for this pulsar, secular changes with X-ray pulse profiles and phases are reported (Ge et al., 2012, 2016; Yan et al., 2017). But, the evolution of the X-ray and -ray spectra have not been studied in details yet, which are what we want to examine in the current paper. Thanks to the long term observation from the RXTE and the FGST, we can study the evolution of the spectra in 5–60 keV, 15–250 keV and 0.1–300 GeV, using the PCA and the HEXTE of RXTE and the LAT onboard FGST, respectively. These results are then used to test the pulsar emission models.
The organization of this paper is as follows: the data processing and reduction are presented in Section 2, results are given in Sections 3, discussions on the physical implications of our results in Section 4, and a short summary in Section 5. All through the paper, the errors of the parameters are at 1 level.
2 Observations and Data Processing
2.1 Timing Ephemeris from Jodrell Bank Observatory
A 13-m radio telescope at Jodrell Bank Observatory (JBO) monitors the Crab pulsar daily (Lyne et al., 1993), offering a radio ephemeris 111http://www.jb.man.ac.uk/pulsar/crab.html that is used for the analyses of RXTE and FGST data. For monthly validity intervals, this ephemeris contains up-to-date parameters of the rotation frequency and its first two time derivatives. The radio pulsar position is R.A.=05h 34m 31.972s, decl.=+22∘ 00′ 52.07′′ (J2000). These parameters are essential in the phase folding step of data analysis. Besides the pulse profile folding, we also use this ephemeris to reckon the spin period and its derivative at a certain time.
2.2 RXTE Observations and Spectra Fitting Method
The X-ray data used in this work were obtained by both PCA and HEXTE, which are described in details in Rothschild et al. (1998), Jahoda et al. (2006) and Yan et al. (2017). The PCA data were taken in MJD 51983–55928 (UTC 2000 December 15–2012 January 02) and are in event mode E_250us_128M_0_1s, while the HEXTE data were taken in MJD 51302–55913(UTC 1999 May 04–2011 December 18) and are in data mode E_8us_256_DX0F. However, even in these durations, observations with short exposure time and thus limited photon counts were not used, to ensure small statistic errors in our analyses.
The RXTE data were analyzed by using the FTOOLS from the astronomy software HEASOFT (v6.17). To get the spectrum and flux from each observation, we first select the good events and then fold them by using the FTOOLS commands fasebin and fbssum. As we focus on the X-ray properties of the Crab pulsar, we need to subtract the background from the nebula. To do this, we use the command fbfsum to get the spectra in the whole phase range and that in phase 0.6–0.8 (off-pulse window) which is similar to that in Ge et al. (2016), and the later is taken as the contribution from the nebula.
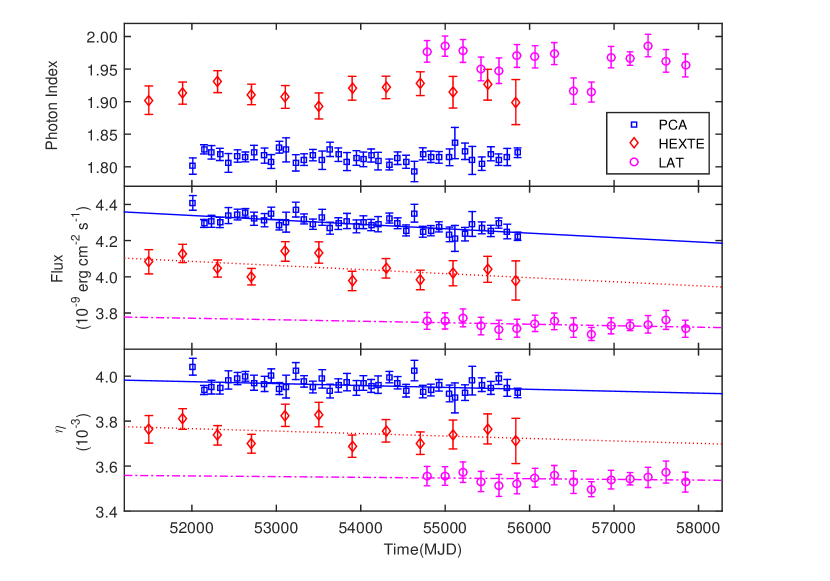
The XSPEC in the software package HEASOFT is used to fit the spectrum of each observation by using the files produced above. The fitting model we used is wabs combined with powerlaw. The first component is used to represent the absorption of the interstellar medium, whose column density is fixed as cm-2 (Ge et al., 2012), and the second component is used to fit the shape of the spectrum of the pulsar X-ray emission. By fitting the PCA and HEXTE spectra of each observation, we got the photon indices and fluxes of the pulsar in 5–60 keV and 15–250 keV, and these values are further averaged over a duration of about 100 days and 400 days, respectively, as shown in Fig. 1.
2.3 FGST Observations and Spectra Fitting Methond
The purpose of FGST/LAT is to detect -rays in the energy range from 20 MeV to 300 GeV, with an effective area of 8000 cm2. It consists of a high-resolution converter tracker, a CsI(Tl) crystal calorimeter, and an anti-coincidence detector, which could measure the direction and energy of the -rays, and in the same time discriminate the particle background events (Atwood et al., 2009). The -ray events from MJD 54771–57966 (UTC 2008 November 01–2017 August 01) in 0.1–300 GeV are analysed in this paper. To balance the requirements of statistics and evolution study, the observations are divided into 15 groups, and each group has a time span of about 230 days.
The LAT data analysis was accomplished by using the Fermi Science Tools (v10r0p5). First, we use the commands gtselect and gtmktime to select the events in good time intervals. Then, in order to reduce the contamination from neighboring sources and to get more accurate spectral fitting results, photon events in the region of 10∘ around the pulsar radio position are selected, which is smaller than previously used (Abdo et al., 2010). At the end, the timing ephemeris from JBO was used to calculate the phase of each -ray photon, and photons in phase 0.52–0.87 (off-pulse, Abdo et al. (2010)) are used for nebula spectrum fitting.
The analysis of -ray spectra was performed by using a maximum-likelihood method implemented in the Fermi science analysis tools 222https://fermi.gsfc.nasa.gov/ssc/data/analysis/scitools/binned_likelihood_tutorial.html. The events within 10∘ from the Crab pulsar contain the emission from the Crab pulsar itself, the Crab nebula, the nearby sources, and the diffuse -ray background. To get the spectral parameters of the pulsar reliably, we determine the spectral parameters of the other three components first, and then use these information in the final spectral fitting. The spectral parameters of the Crab nebula were obtained by using the photons in phase 0.52–0.87 that were selected previously. Contribution of all the neighboring sources (within 15∘) are considered, in which the spectral parameters of sources more than 3∘ away from the pulsar direction were fixed as those obtained from the all-sky analysis, and those for sources within 3∘ were taken as free parameters. The contamination produced by the interactions between the cosmic-rays and the Earth’s atmosphere was avoided by selecting a zenith angle greater than . The Galactic diffuse emission model we used is gll_iem_v06.fits, the isotropic model is iso_P8R2_SOURCE_V6_v06.txt, LAT 4-year Point Source Catalog is gll_psc_v16.fit (Acero et al., 2015), and the instrument response function is P8R2_SOURCE_V6. At the end, the spectra of the Crab pulsar were obtained by utilizing events in the whole phase range with the contaminations from the other components taken into account. The detailed spectral analysis process is the same as in Abdo et al. (2010).
From the spectral analysis results, we can compute the X-ray and -ray luminosities (Marelli et al., 2011) and then study their correlation with the spin down power (Condon & Ransom, 2016), where kpc (Trimble, 1973) is the pulsar distance, and are the X-ray and -ray fluxes, and account for the X-ray and -ray beaming geometries that depend on the viewing angle and the magnetic inclination of the pulsar, which are taken as 1 (Marelli et al., 2011), and are the spin period and its derivative, is the neutron star momentum, is the mass of the Crab pulsar, and km is the typical radius of a neutron star.
2.4 Linear Fitting
The long term evolutions of the fluxes and photon indices are studied by a linear fitting method that was used by Li et al. (2008) and Ge et al. (2012), and the relation between the high energy luminosities and the spin down power are studied in a similar way. The value of the slope and its error obtained from the fitting show whether there are any long term evolution and dependence. To double check, we also use robust linear modeling (RLM) to fit the evolution and dependance trends.
The RLM is inherited from the R statistical software package (Feigelson & Babu, 2012). The MASS (Modern Applied Statistics with S) library based on R-language has the rlm function for RLM, in which the best fit is achieved using an iteratively reweighted least-squares algorithm. This method is used to fit the spectral parameters versus time and the correlation between different data groups. The fitting results are listed in Table 1 and Table 2.
2.5 Correlation Analysis
The Pearson correlation coefficient is a suitable parameter to describe the dependance of a parameter on the other parameters quantitatively (Lee Rodgers and Nicewander, 1988). In order to evaluate the significance level of the correlations of two parameters concerned, we evaluate the widely used Pearson correlation coefficient () and the two-sided significance level (). The results are listed in Table 2.
3 Results
3.1 The Spectra and Energy Conversion Efficiency Evolution
Given that the rotation parameters of the Crab pulsar are evolving with time, and the previous statistical studies show strong correlation between the high energy luminosities and the spin down power of isolated pulsars, what we are interested in is whether the observed high energy emission properties of the Crab pulsar change with time. In the upper two panels of Fig. 1, the photon indices and fluxes obtained from the three instruments are plotted. The photon indices don’t have any obvious evolution with time, and the mean spectral indices from PCA, HEXTE and LAT are 1.81, 1.91, 1.96, respectively, these results are consistent with previous studies (Kuiper et al., 2001; Abdo et al., 2010). The X-ray and -ray fluxes show a similar decrease trend with time. Linear fitting to these data points gives that, the PCA flux decreases with a rate of erg cm-2 s-1 per day, the HEXTE flux decreases with a rate of erg cm-2 s-1 per day, and the LAT flux decreases with erg cm-2 s-1 per day. The errors listed here are the statistical errors only. However, the instrument effect for the observations from PCA and HEXTE are very small and could be neglected (Ge et al., 2016). So, the PCA flux has decreased significantly in the 11 years of observation and this trend is consistent with previous studies in Wilson-Hodge et al. (2011), which show that the Crab pulsar’s flux steadily decreases at 0.2% per year, while the evolution of the HEXTE and LAT fluxes have not been detected significantly, probably due to the limited number of photons detected.
The bottom panel of Fig. 1 plots the conversion efficiency versus time in each energy band, which is simply the ratio of the X-ray or -ray luminosity to the spin down power of the pulsar, . The mean energy conversion efficiencies in the three energy bands are 0.40%, 0.29% and 0.12%, respectively. The in this work is consistent with the constraints for young pulsars in Possenti et al. (2002).
The energy conversion efficiency in 5–60 keV decreases with time, with a rate of per day. But the conversion efficiencies in the higher energy bands inferred from the HEXTE and LAT data don’t show any detectable evolution, due to the limited number of photons detected again.
3.2 The Correlation between the X-ray Luminosity and Spin down Power
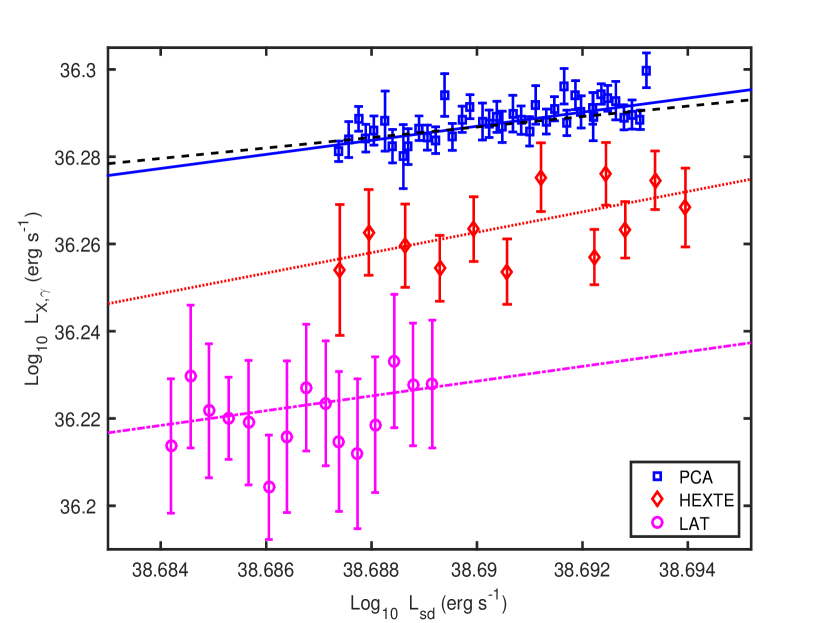
As shown in Fig. 2, there exist clear positive correlations between the observed high energy luminosity and the spin down power. The linear fitting parameters of the – relations are listed in Table 1, in which the Pearson correlation tests are: and significance level for the observations by PCA, and for the HEXTE observations, and and for the LAT observations. Therefore,the correlation between and is significantly detected, while that between and is undetected with the LAT data.
We further fit the relations between and with the function , where and are the free parameters need to be determined. This function is the same as used in the previous statistical studies (Becker & Trmper, 1997; Saito, 1998; Cheng et al., 2004; Li et al., 2008). From the PCA data, we obtained a relationship . For the HEXTE and LAT data, the relations are , and , which means that the indices have not been well determined.
4 Discussions
4.1 Comparisons with the Previous Works
In this work, we find that the pulsed X-ray luminosity of the Crab pulsar decreases significantly in the 11 years of RXTE/PCA observations, and it is strongly correlated with the spin down power by . This is well consistent with the value found by Vink et al. (2011) in a study of young pulsars, but a little higher than the values obtained in older statistical studies, of about 1.0 (Cheng et al., 2004; Li et al., 2008). We suggest that this discrepancy is probably due to the different samples used in these studies. As dozens of pulsars were used in the previous studies, and the magnetic field strength, inclination angle of the magnetic axis, rotation frequency, direction of the rotation axis, and age are different for one pulsar from the others, the previous statistical results are actually the combined effects of all these factors rather than the consequence of the spin down power alone. Our results thus provide relatively purified data to study the changes of the structure and energy release mechanism of the pulsar magnetosphere when the spin down power decreases.
4.2 Constraints on Pulsar Radiation Models
There are different radiation and magnetosphere models to explain the high energy emission properties of pulsars, such as vacuum magneto-dipole radiation model (Pacini, 1968), longitudinal current model (Beskin et al., 1983), outer gap model (hereafter OG model, Cheng et al. (1986)) and FIDO (Force-free Inside, Dissipative Outside) model (Spitkovsky, 2006), and the relation between high energy luminosities and spin down powers predicted by different models could be a good tool to test these models. It is notable that the OG model in Cheng et al. (1998), which used the thick outer gap model of Zhang & Cheng (1997) gave a prediction for the relation between X-ray (1 MeV) luminosities and spin down powers,
| (1) |
| (2) |
where is the inclination angle, is the surface magnetic field strength, is the spin down power and is the theoretical prediction for total X-ray luminosity. In the following we test this theoretical relation of X-ray luminosity and spin down power by comparing it with our observational results. We simply take G (Cheng et al., 1986) and (Du et al., 2012) because the correlation exponent for the OG model dose not change for different and . As shown in Fig. 2, the correlation between the total theoretical X-ray luminosities and spin down powers has the same trend with observations in selected energy bands (i.e. PCA observations). The energy bands of the theoretical predictions and observations are different, so the normalization parameter of them are not the same. The relation between the theoretical X-ray luminosities and spin down powers is , and the correlation exponent predicted by OG model is in the 1.5 limits of the observational index. Thus the OG model we used is compatible with the 5–60 keV observations, but as pointed out by Viganò et al. (2015) the model as well as the data has significant uncertainties.
Alternatively, we realised that the decrease of the X-ray luminosity could be also due to the geometrical evolution of the magnetosphere. Studies of the radio and X-ray profiles show that the separation and relative strength of the two peaks changes gradually with time, which were explained as the increase of the inclination angle of the magnetic axis (Lyne et al., 2013; Ge et al., 2016). Possibly, the evolution of the inclination angle also changes the geometry of the X-ray beam and consequently makes the X-ray flux lower.
5 Summaries
In this work, using the available observations of the RXTE/PCA, RXTE/HEXTE and FGST/LAT in 5–60 keV, 15–250 keV and 0.1–300 GeV, we obtain the spectral properties of the Crab pulsar in these energy bands. We find that the 5-60 keV X-ray flux observed by PCA has significantly decreased in the 11 years with a rate of erg cm-2 s-1 per day, while in the higher energy bands this trend is not significant, probably due to the limited number of photons collected. We also find a strong correlation between the 5-60 keV X-ray luminosities and the spin down powers of the Crab pulsar, which can be represented by . Such a correlation is consistent with the predictions of the OG model in Cheng et al. (1998), but may also be consistent with other models.
Acknowledgments
We thank the referee for his/her very helpful comments. We appreciate Jian Li, Feifei Kou, Xian Hou, and Shanshan Weng for their useful suggestions and discussions. We thank the High Energy Astrophysics Science Archive Research Center and Fermi Science Support Center for maintaining its online archive service that provided the data used in this research. This work is supported by the National Key R&D Program of China (2016YFA0400803, 2016YFA0400800), National Science Foundation of China (11233001, 11503027 and 61471003), the Strategic Pionner Program on Space Science, and Chinese Academy of Sciences, Grant No.XDA15051400.
References
- Abdo et al. (2010) Abdo, A. A., Ackermann, M., Ajello, M., et al. 2010, ApJ, 708, 1254
- Acero et al. (2015) Acero, F., Ackermann, M., Ajello, M., et al. 2015, ApJS, 218, 23
- Atwood et al. (2009) Atwood, W. B., Abdo, A. A., Ackermann, M., et al. 2009, ApJ, 697, 1071
- Becker & Trmper (1997) Becker, W., & Trmper, J. 1997, A&A, 326, 682
- Beskin et al. (1983) Beskin, V. S., Gurevich, A. V., & Istomin, I. N. 1983, Zhurnal Eksperimentalnoi i Teoreticheskoi Fiziki, 85, 401
- Beskin (2017) Beskin, V. 2017, 6th International Symposium on High Energy Gamma-Ray Astronomy, 1792, 020001
- Cheng et al. (1986) Cheng, K. S., Ho, C., & Ruderman, M. 1986, ApJ, 300, 500
- Cheng et al. (1998) Cheng, K. S., Gil, J., & Zhang, L. 1998, ApJ, 493, L35
- Cheng & Zhang (1999) Cheng, K. S., & Zhang, L. 1999, ApJ, 515, 337
- Cheng et al. (2004) Cheng, K. S., Taam, R. E., & Wang, W. 2004, ApJ, 617, 480
- Condon & Ransom (2016) Condon, J. J., & Ransom, S. M. 2016, Essential Radio Astronomy, by James J. Condon and Scott M. Ransom. ISBN: 978-0-691-13779-7. Princeton, NJ: Princeton University Press, 2016.
- Du et al. (2012) Du, Y. J., Qiao, G. J., & Wang, W. 2012, ApJ, 748, 84
- Feigelson & Babu (2012) Feigelson, E. D., & Babu, G. J. 2012, Modern Statistical Methods for Astronomy
- Ge et al. (2012) Ge, M. Y., Lu, F. J., Qu, J. L., et al. 2012, ApJS, 199, 32
- Ge et al. (2016) Ge, M. Y., Yan, L. L., Lu, F. J., et al. 2016, ApJ, 818,48
- Harding (2017) Harding, A. K. 2017, arXiv:1712.02409
- Jahoda et al. (2006) Jahoda, K., Markwardt, C. B., Radeva, Y., et al. 2006, ApJS, 163, 401
- Kuiper et al. (2001) Kuiper, L., Hermsen, W., Cusumano, G., et al. 2001, A&A, 378, 918
- Lee Rodgers and Nicewander (1988) Lee Rodgers, J., & Nicewander, W. A., 1988, The American Statistician, 42(1), 59-66
- Li et al. (2008) Li, X.-H., Lu, F.-J., & Li, Z. 2008, ApJ, 682, 1166-1176
- Li & Zhang (2010) Li, X., & Zhang, L. 2010, ApJ, 725, 2225
- Lyne et al. (1993) Lyne, A. G., Pritchard, R. S., Smith, F. G. 1993, MNRAS, 265, 1003
- Lyne et al. (2013) Lyne, A., Graham-Smith, F., Weltevrede, P., et al. 2013, Science, 342, 598
- Malov (2003) Malov, I. F. 2003, Astronomy Letters, 29, 502
- Marelli et al. (2011) Marelli, M., De Luca, A., & Caraveo, P. A. 2011, ApJ, 733, 82
- Pacini (1968) Pacini, F. 1968, Nature, 219, 145
- Possenti et al. (2002) Possenti, A., Cerutti, R., Colpi, M., & Mereghetti, S. 2002, A&A, 387, 993
- Rothschild et al. (1998) Rothschild, R. E., Blanco, P. R., Gruber, D. E., et al. 1998, ApJ, 496,538
- Saito (1998) Saito Y. 1998 Ph.D. Thesis, Univ. of Tokyo
- Saito et al. (1997) Saito, Y., Kawai, N., Kamae, T., & Shibata, S. 1997, Proceedings of the Fourth Compton Symposium, 410, 628
- Seward & Wang (1988) Seward, F. D., & Wang, Z.-R. 1988, ApJ, 332, 199
- Spitkovsky (2006) Spitkovsky, A. 2006, ApJ, 648, L51
- Trimble (1973) Trimble, V. 1973, PASP, 85, 579
- Viganò et al. (2015) Viganò, D., Torres, D. F., Hirotani, K., & Pessah, M. E. 2015, MNRAS, 447, 2649
- Vink et al. (2011) Vink, J., Bamba, A., & Yamazaki, R. 2011, ApJ, 727, 131
- Wilson-Hodge et al. (2011) Wilson-Hodge, C. A., Cherry, M. L., Case, G. L., et al. 2011, ApJ, 727, L40
- Yan et al. (2017) Yan, L. L., Ge, M. Y., Yuan, J. P., et al. 2017, ApJ, 845, 119
- Zhang & Cheng (1997) Zhang, L., & Cheng, K. S. 1997, ApJ, 487, 370
- Zhang & Jiang (2006) Zhang, L., & Jiang, Z. J. 2006, A&A, 454, 537
| Instrument | Energy | Flux (erg cm-2 s-1) | ||||
|---|---|---|---|---|---|---|
| Rate (/day) | Intercept (10-9 ) | Rate (/day) | Intercept (10-3 ) | |||
| PCA | 5–60 keV | |||||
| HEXTE | 15–250 keV | |||||
| LAT | 0.1–300 GeV | |||||
[a] These intercepts correspond to the values at MJD 55000.
| Group | Instrument | Energy Band | Parameter1 | Parameter2 | |||||
|---|---|---|---|---|---|---|---|---|---|
| 1 | PCA | 5–60 keV | vs. | ||||||
| 2 | HEXTE | 15–250 keV | vs. | 0.05 | |||||
| 3 | LAT | 0.1–300 GeV | vs. | 0.28 | |||||
| 4 | X-ray ( 1 MeV) | vs. | … | … |