Multi-wavelength study of the short term TeV flaring activity from the blazar Mrk 501 observed in June 2014
Abstract
In this work, we study the short term flaring activity from the high synchrotron peaked blazar Mrk 501 detected by the FACT and H.E.S.S. telescopes in the energy range 2-20 TeV during June 23-24, 2014 (MJD 56831.86-56831.94). We revisit this major TeV flare of the source in the context of near simultaneous multi-wavelength observations of –rays in MeV-GeV regime with Fermi-LAT, soft X-rays in 0.3-10 keV range with Swift-XRT, hard X-rays in 10-20 keV and 15-50 keV bands with MAXI and Swift-BAT respectively, UV-Optical with Swift-UVOT and 15 GHz radio with OVRO telescope. We have performed a detailed temporal and spectral analysis of the data from Fermi-LAT, Swift-XRT and Swift-UVOT during the period June 15-30, 2014 (MJD 56823-56838). Near simultaneous archival data available from Swift-BAT, MAXI and OVRO telescope along with the V-band optical polarization measurements from SPOL observatory are also used in the study of giant TeV flare of Mrk 501 detected by the FACT and H.E.S.S. telescopes. No significant change in the multi-wavelength emission from radio to high energy –rays during the TeV flaring activity of Mrk 501 is observed except variation in soft X-rays. The varying soft X-ray emission is found to be correlated with the –ray emission at TeV energies during the flaring activity of the source. The soft X-ray photon spectral index is observed to be anti-correlated with the integral flux showing harder-when-brighter behavior. An average value of 4.5 for V-band optical polarization is obtained during the above period whereas the corresponding electric vector position angle changes significantly.We have used the minimum variability timescale from the H.E.S.S. observations to estimate the Doppler factor of the emission region which is found to be consistent with the previous studies of the source.
keywords:
(Galaxies:) BL Lac objects: individual : Mrk 501, Methods: data analysis, Gamma-rays:general1 Introduction
Blazars are a special class of radio loud active galactic nuclei (AGN) with powerful and highly relativistic jets oriented at small angles () to the line of sight of the observer on the Earth (Readhead et al., 1978; Urry and Padovani, 1995). The jets of blazars are assumed to be powered by rotating supermassive black holes surrounded by accretion disks at the centers of massive elliptical type host galaxies. They are observed to be highly luminous at all wavelengths throughout the electromagnetic spectrum from radio to very high energy (VHE, E100 GeV) –rays. The multi-wavelength emission from blazars is dominated by relativistic effects like Doppler boosting of the observed flux and dilation/compression of timescales due to orientation of the jets. The observed broadband spectral energy distribution (SED) of blazars from radio to –rays is characterized by two broad peaks. The origin of non-thermal SED is attributed to the relativistic charged particles in the blazar jets. The physical process responsible for the low energy peak at UV/optical to soft X-ray is relatively well understood and assumed to be the synchrotron radiation of relativistic electrons in the tangled magnetic field of the jet (Urry and Mushotzky, 1982; Marscher, 2008). A significant contribution to the low energy hump has also been observed in the SED of many blazars in the narrow energy range from non-jet components like accretion disk, broad line region (BLR) and dusty torus (Kushwaha et al., 2014; Nalewajko et al., 2014).
The origin of high energy (HE, 30 MeV) component of the SED peaking at hard X-rays to MeV-GeV –rays is not well understood and two alternative approaches: leptonic and hadronic have been proposed. In the leptonic approach, the origin of HE component of the SED is attributed to the inverse Comptonization of different circumnuclear low energy seed photons produced within the jet or outside it by relativistic leptons. If seed photons for the inverse Compton upscattering are the synchrotron photons produced by the same population of relativistic leptons within the jet, the process is referred to as synchrotron self Compton (SSC) model (Maraschi et al., 1992; Sokolov et al., 2004). On the other hand, if the seed photon field is external to the jet, namely from accretion disk, torus, broad line region or cosmic microwave background radiation, the process is termed as external Comptonization (EC) model (Dermer et al., 1992; Sikora et al., 1994; Agudo et al., 2011). Alternatively, in the hadronic approach, the emission of high energy component of the blazar SED is attributed to proton synchrotron or secondary emission from p- interactions (Mannheim, 1993; Pohl and Schlickeiser, 2000; Aharonian, 2002). However, the leptonic models are more favored than hadronic processes for modelling the rapid variability observed in –ray emission from blazars (Böttcher et al., 2013; Cerruti et al., 2015).
Blazars are classified into two broad categories: BL Lacertae objects (BL Lacs) and Flat Spectrum Radio Quasars (FSRQs) on the basis of the strength of emission lines in their optical spectra. The optical spectra of BL Lacs are characterized as featureless continuum emission with very weak or no emission lines, whereas FSRQs have prominent and broad emission lines (Urry and Padovani, 1995; Stocke et al., 1991; Marcha et al., 1996). The position of peak frequency in the low energy component of the SED has also been used to subdivide blazars in three subclasses namely high synchrotron peaked (HSP), intermediate synchrotron peaked (ISP) and low synchrotron peaked (LSP) blazars (Abdo et al., 2010). The location of synchrotron peak frequency for HSPs is observed at UV/X-ray energies whereas FSRQs and ISPs have peak at IR/optical energies. The peak of HE component of the SED lies at GeV-TeV energies for HSPs and at hard X-ray energies for FSRQs and LSPs. BL Lacs and FSRQs have low and high luminosity respectively-forming the so called blazar sequence, but there is no general consensus on this phenomenological feature of blazars (Ghisellini et al., 2017).
Emissions from most of the blazars have been observed to be variable over the entire electromagnetic spectrum at short timescales during the flaring activities followed by quiescent state. The multi-wavelength emissions from blazars show a high degree of polarization and strong variability on timescales from days to minutes. Rapid flaring activities in blazars on hour and minute timescales are dominant at –ray energies with change in flux up to few magnitudes (Falomo et al., 2014; Ackermann et al., 2016; Rani et al., 2013). In general, the flaring activity in X-ray and VHE regimes has become one of the most important observational features of the blazars. However, the physical processes involved in the origin of such dramatic behaviour of blazars have not been clearly explained. In this paper, we present the multi-wavelength study of the short term TeV flaring activity from the blazar Mrk 501 detected by the H.E.S.S. and FACT telescopes (Chakraborty and Cologna, 2015; Cologna et al., 2016) during the night of June 23-24, 2014 (MJD 56831.86-56831.94) . In Section 2, we briefly describe the observational history of the blazar Mrk 501 over the last two decades. The details of multi-wavelength observations and data analysis are given in Section 3. Section 4 provides discussion of the results obtained in this study. Finally, we summarize the important findings of this work in Section 5. We have assumed a flat CDM cosmology with , and throughout the paper.
2 Mrk 501
Mrk 501 is one of the nearest (z=0.034, 145 Mpc) and the brightest HSP blazars at X-ray and TeV energies in the extragalactic Universe. This source has been observed over the last two decades to undergo major outbursts on long timescales and rapid short timescales prominently in X-ray and TeV energy bands. Therefore, most of the –ray studies of Mrk 501 in the past have been performed during its flaring activity. Both low and high energy peaks of Mrk 501 SED are observed to shift towards higher energies during different flaring activities of the source. The first TeV emission from Mrk 501 was detected in 1995 by the Whipple telescope above 300 GeV (Quinn et al., 1996) and subsequently confirmed by the HEGRA group (Bradbury et al., 1997). In 1997, it was observed in high state of activity by the CAT observatory at energies above 250 GeV with flux level two orders of magnitude higher than its discovery level (Djannati-Atai et al., 1999). During the same time, the source was also observed in flaring state at soft X-ray energies by All Sky Monitor (ASM). In 2005, the MAGIC telescope observed Mrk 501 in flaring state with fastest VHE –ray variability on a timescale of minutes (Albert et al., 2007). Between March and May 2008, a multi-wavelength campaign was planned on Mrk 501 to perform an unbiased characterization of –ray emission together with X-ray to radio emission from the source in the low state of activity (Aleksić et al., 2015). The VHE flux during this campaign was found to be 10–20 of the flux level measured from the flaring activity of Mrk 501.
In 2009, Fermi-LAT observed remarkable spectral variability and mild flux variability in the energy range 100 MeV–300 GeV from Mrk 501 during first 480 days of Fermi operation (Abdo et al., 2011). In March 2009, a short-term multi-wavelength observation of Mrk 501 was coordinated to provide a baseline measurement of the source in the quiescent state including the TeV observations with VERITAS and MAGIC (Acciari et al., 2011). A major VHE outburst was observed on May 1, 2009 by Whipple and VERITAS during an extensive multi-wavelength campaign of Mrk 501 between April 17 and May 5, 2009 (Aliu et al., 2016). In the flaring state, the VHE flux above 400 GeV increased to five times the Crab Nebula flux and ten times the pre-flare flux showing a fast flux variation with an increase of a factor 4 in 25 minutes and decay time of 50 minutes (Aliu et al., 2016). In 2011, the brightest TeV flare from Mrk 501 since 2005 was observed by ARGO-YBJ experiment (Bartoli et al., 2012). An increase of –ray flux above 1 TeV by a factor of 7 from its quiescent state emission had been detected by ARGO-YBJ during this period. Again in May 2012, Mrk 501 was observed in relatively high –ray emission state by TACTIC telescope in the energy range above 850 GeV (Chandra et al., 2017).
First detailed study of the synchrotron peak in the SED of Mrk 501 was reported using broad band observations of the source during April-August 2013 (Furniss et al., 2015). In this study, the hard X-ray observations with NuSTAR provided unprecedented evidence for the rapid variability at hour timescales in the energy range 3-79 keV. During March-October 2014, short term strong X-ray flares with flux level varying by factors of 2-5 were detected from Mrk 501 on timescales of few weeks or shorter (Kapanadze et al., 2017). The X-ray flux points in the energy range 0.3-10 keV were observed to be correlated with the TeV flux measurements during the flaring activity in the source. Apart from the TeV-X-ray correlation, more complicated variability patterns had also been observed which indicated that –ray emission region in Mrk 501 is more complex than a single blob (Kapanadze et al., 2017). Different features at TeV energies in low and high activity states of Mrk 501 have been reported by various observational studies but the physical mechanism involved is not yet completely understood.
3 Multi-Wavelength observations and Data Analysis
In 2014, the H.E.S.S. telescopes observed Mrk 501 on several nights between June 19-25 and on July 29-30. A major flaring activity from the source was detected during the night of June 23-24, 2014 (MJD 56831.86-56831.94) with the highest flux level of Mrk 501 ever observed by H.E.S.S. (Chakraborty and Cologna, 2015). The model analysis of H.E.S.S. data yielded an excess of 1200 –ray photons with statistical significance of 67 for 2.1 hours of observations on the night of June 23-24, 2014. This unprecedented flaring activity from Mrk 501 with variability timescale of 6 minutes (Chakraborty and Cologna, 2015) in the energy range 2-20 TeV provides a unique opportunity to investigate the emission mechanism from high synchrotron peaked blazars like Mrk 501. Near simultaneous observations of the flaring activity of Mrk 501 with FACT (Cologna et al., 2016) above 750 GeV provided important pre- and post-flare information with dense sampling. In the night of June 23-24, 2014 (MJD 56831.86-56831.94), FACT observed Mrk 501 for a live time of 4 hours with flux level more than four times the Crab Nebula flux above 750 GeV allowing for better characterization of the flaring activity in the VHE band. A simple linear correlation was observed between the nightly averaged flux points including the flaring activity recorded with H.E.S.S. and FACT telescopes (Cologna et al., 2016). With the motivation of understanding the broadband emission of Mrk 501 during the short term giant flaring activity, we use near simultaneous multi-wavelength data in the lower energy bands from HE –ray to radio observations of the source during the period June 15-30, 2014 (MJD 56823-56838). A brief description of the details of multi-wavelength data from various instruments world wide and their analysis procedure is given below.
3.1 Fermi-LAT
The Large Area Telescope (LAT) on board Fermi satellite is a pair-conversion –ray telescope with wide field of view of 2.4 steradians and can detect photons of energy above 100 MeV with an energy resolution of 10 at 1 GeV in survey mode (Atwood et al., 2009). We have downloaded the Pass 8 Fermi-LAT data for Mrk 501 from Fermi Science Support Center (FSSC)111https://fermi.gsfc.nasa.gov/cgi-bin/ssc/LAT/LATDataQuery.cgi during the period June 15-30, 2014 including the H.E.S.S. observations of the source in flaring state. The LAT data have been analysed using publicly available Fermi ScienceTools v10r0p5. We have selected photons from a circular region of interest of 15∘ radius centered on the position of Mrk 501 using Pass 8 response function (event class=128, event type=3) corresponding to response in the energy range 100 MeV–300 GeV. In addition, we use maximum zenith angle cut of 90∘ to avoid the contamination from Earth limb –rays and spacecraft rocking angle 52∘ to limit the time periods when Earth entered LAT field of view. We have constructed the sky source model file using third Fermi –ray catalog (3FGL) (Acero et al., 2015). The Galactic diffuse and extragalactic isotropic background emissions have been modelled using and files respectively. The spectral parameters of the source and detection significance for daily observations are estimated using an unbinned maximum-likelihood implemented in gtlike tool. The daily fluxes for the light curve of the source have been estimated using power law model keeping spectral index and normalization as free parameters. For daily observations with test static (TS) less than 10, we have calculated 2 upper limit on the integral flux above 100 MeV.
We have also performed the spectral analysis of Mrk 501 in the energy band 100 MeV–300 GeV for the time interval June 22-24, 2014 (MJD 56830-56832) overlaping with flare period observed with the H.E.S.S. telescopes. The spectrum of the source for this time period is determined by dividing the energy band 100 MeV–300 GeV into three smaller energy bins : 0.1–1 GeV, 1–5 GeV and 5–300 GeV. A power law model is fit to the data in three energy bins with the normalization as free parameter and spectral index set to the value obtained from the integration of data for the above time interval in the energy range 100 MeV–300 GeV.
3.2 Swift-BAT
The Burst Alert Telescope (BAT) on board Neil Gehrels Swift Observatory provides an all-sky hard X-ray survey covering the energy range 15-150 keV (Barthelmy et al., 2005). The instrument is a highly sensitive, coded mask imager with large field of view and provides positional accuracy between 1-3 arcmin. The Swift-BAT hard X-ray transient monitor (Krimm et al., 2013) provides X-ray observations in the energy range 15-50 keV and generates light curves of sources spanning over more than thirteen years. We have downloaded daily light curve of Mrk 501 for the period June 15-30, 2014 from online Swift-BAT transient monitor program222https://swift.gsfc.nasa.gov/results/transients.
3.3 MAXI
The Monitor of All-sky X-ray Image (MAXI) is a payload on Japanese Experimental Module on the International Space Station to investigate the long term behaviour of X-ray sources in the energy range 2-20 keV (Matsuoka et al., 2009). This mission has two X-ray detectors consisting of gas proportional counters and X-ray charge coupled devices with the ability to make an all-sky X-ray map at soft and medium energy X-rays. The instrument has poor angular resolution, but can acheive localization accuracy up to 0.1∘ for bright sources. We have obtained daily observations of Mrk 501 with MAXI in the energy range 10-20 keV during the period June 15-30, 2014 from the online data archive provided by MAXI team333http://maxi.riken.jp/pubdata/.
3.4 Swift-XRT
The X-Ray Telescope (XRT) on board the Swift satellite is a grazing incidence Wolter I telescope with CCD detector covering the energy range 0.3–10 keV with effective area of 110 cm2 and field of view of 23.6 arcmin (Burrows et al., 2005). The archival data on Mrk 501 have been downloaded from the Swift multi-wavelength support program444http://www.swift.psu.edu/monitoring/ for the observation period June 15-30, 2014. We have analyzed the Swift-XRT data to derive the spectral features of the source during these periods using HEASoft package version 6.19. The observations have been performed in windowed timing (WT) mode and the cleaned XRT event files with standard filtering criteria are produced using xrtpipeline version 0.13.2 with recent calibration files (version 20160609). The spectra of the source and the background are generated from Xselect V2.4d in the energy band 0.3-10 keV. The source photons have been extracted from a circular region with radius around source position. The nearby background with similar radius from the source free region is selected for individual observation according to the source position in the detector. The ancillary response files (ARFs) have been generated with the xrtmkarf task, applying corrections for the point spread function losses and CCD defects using the cumulative exposure map. Finally, the observations are binned to have atleast 30 counts per spectral bin using grppha.
The spectrum has been fitted using power law model with absorption due to a neutral hydrogen using xspec (ver 12.9) model phabszpow for source redshift in the energy range 0.3-10 keV. The line-of-sight absorption is fixed to a neutral hydrogen column density () of obtained from the Leiden-Argentine-Bonn (LAB) survey of Galactic HI (Kalberla et al., 2005). The analysis results for each observations during the period June 15-30, 2014 (MJD 56823-56838) have been summarized in Table 1. We have also estimated the energy flux values in four sub-energy bands: 0.3-0.7 keV, 0.7-1.7 keV, 1.7-4.0 keV and 4.0- 10.0 keV for each observation to derive the spectral energy distribution of the source and to study the spectral evolution during this period. We have also tried to fit the spectrum using log-parabola model instead of the simple power law because some of the -values reported in 1 are high for power law fit. The fit improves marginally with almost no change in the photon spectral index parameter () but the curvature index () has large uncertainty. Therefore, we have used simple power law model to fit the spectrum in the energy range 0.3-10 keV in the present study.
| Obs ID | MJD start | Exposure | Photon index | /dof |
|---|---|---|---|---|
| (sec) | () | |||
| 00030793249 | 56824.729 | 1470 | 1.760.01 | 305/274 |
| 00035023038 | 56826.191 | 963 | 1.700.01 | 269/240 |
| 00035023039 | 56829.000 | 722 | 1.580.02 | 229/233 |
| 00030793253 | 56830.004 | 681 | 1.720.02 | 211/186 |
| 00030793252 | 56830.998 | 683 | 1.670.02 | 221/216 |
| 00035023040 | 56832.004 | 1137 | 1.600.01 | 274/265 |
| 00035023041 | 56832.253 | 620 | 1.640.02 | 221/199 |
| 00035023042 | 56832.982 | 315 | 1.730.03 | 99/78 |
| 00035023043 | 56834.050 | 833 | 1.690.02 | 234/219 |
| 00035023044 | 56834.982 | 1246 | 1.730.01 | 371/262 |
| 00035023045 | 56835.249 | 958 | 1.690.01 | 280/232 |
| 00035023047 | 56836.982 | 1519 | 1.880.01 | 350/256 |
3.5 Swift-UVOT
The Ultraviolet/Optical Telescope (UVOT) on board the Swift observatory is a modified optical configuration having micro-channel plate intensified CCD detectors to provide observations in the wavelength range 170-600 nm (Roming et al., 2005). Swift-UVOT utilizes three optical filters V(546.8 nm), B(439.2 nm), U(346.5 nm) and three ultraviolet filters UVW1(260.0 nm), UVM2(224.6 nm), UVW2(192.8 nm) during the observations. We have downloaded the online available raw data files from the Swift-UVOT observations of Mrk 501 during the period June 15-30, 2014 from the archive555http://www.swift.psu.edu/monitoring/. The data available in each filter has been analyzed using uvotsource task. A circular region of 13′′ radius is selected around the source to extract the UVOT source counts, while extracting the background for two circular regions of radius 30′′ each from the source free regions near to the source. The approximate aperture corrections have been applied by specifying “apercorr=CURVEOFGROWTH” when running the task uvotsource. Finally, the magnitudes of the source measured by UVOT in the six filters have been converted to energy fluxes for each observation available during the above period using the corresponding zero flux points given in (Poole et al., 2008).
3.6 SPOL
The optical spectropolarimetric (SPOL) monitoring program at Steward observatory (Smith et al., 2009) has been designed to measure the linear polarization and flux from –ray bright blazars and to provide the data to the research community under Fermi Multiwavelength Observing-Support Programs666https://fermi.gsfc.nasa.gov/ssc/observations/ multi/programs.html. SPOL is dual-beam spectropolarimeter with a waveplate and Wollaston prism to modulate and analyze polarized light and provides spectral coverage in the wavelength range 400–755 nm with a resolution of about 2 nm (Smith et al., 2009). We have obtained the polarization data for Mrk 501 during the period June 15-30, 2014, publicly available from SPOL observations of bright Fermi blazars777http://james.as.arizona.edu/psmith/Fermi.
3.7 OVRO
The Owens Valley Radio Observatory (OVRO) 40 m monitoring program (Schmidt et al., 1992) provides blazar observations at 15 GHz under Fermi Multiwavelength Observing-Support Programs. The OVRO 40 m telescope is a f/0.4 parabolic reflector with its receiver operating in Ku band at central frequency of 15 GHz, bandwidth of 3 GHz and a noise-equivalent reception bandwidth of 2.5 GHz (Richards et al., 2011). We have downloaded publicly available data from OVRO archive888http://www.astro.caltech.edu/ovroblazars/data for Mrk 501 observations during the period June 15-30, 2014.
4 Results and Discussion
4.1 Multi-wavelength light curve
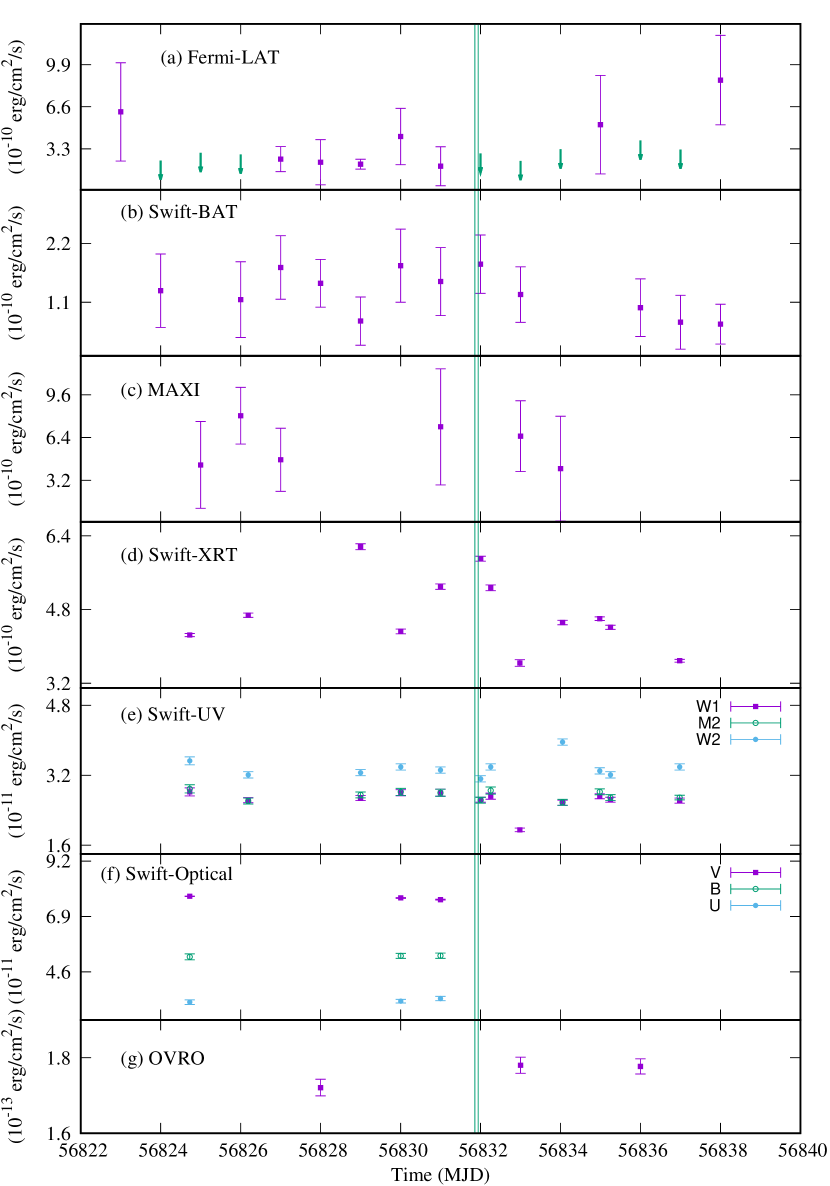
The multi-wavelength light curves of Mrk 501 from HE –rays to radio for the period June 15-30, 2014 (MJD 56823-56838) covering the period of VHE –ray flare on the night of June 23-24, 2014 (MJD 56831.86-56831.94) are shown in Figure 1(a-g). The duration of short term TeV flaring activity detected by the H.E.S.S. telescopes is indicated by two vertical lines in Figure 1. The values of average emission in all the energy bands estimated from the constant fit to the light curves and corresponding reduced (dof: degree of freedom) are given in Table 2. We observe that the multi-wavelength emission of the blazar Mrk 501 from HE –rays to radio is consistent with constant emission except for soft X-ray emission detected by Swift-XRT during this period. The daily averaged soft X-ray flux in the energy range 0.3-10 keV measured by Swift-XRT is shown in Figure 1(d). It is evident that near simultaneous X-ray activity of the source in the energy range 0.3-10 keV is consistent with the VHE activity in the energy range 2-20 TeV detected with H.E.S.S. (Figure 1 in Chakraborty and Cologna (2015)) and above 750 GeV observed with FACT (Figure 1 in Cologna et al. (2016)). In soft X-ray band, the source is observed in the highest activity state on June 21, 2014 (MJD 56829), but no contemporeneous activity is detected in VHE band by the FACT and H.E.S.S. telescopes. In VHE band, the source is observed in extreme activity state on the night of June 23-24 (MJD 56831.86-56831.94) with near simultaneous high state emission in soft X-rays. The variability of the source in VHE band is observed to be very fast with minimum variability timescale of 6 minutes (Chakraborty and Cologna, 2015) in the observations of flaring activity with H.E.S.S. but no minute scale variability is obtained in the FACT observations Cologna et al. (2016) due to low sensitivity of the telescope. With this rapid variability of the source, the absence of VHE flare during the highest soft X-ray activity on June 21, 2014 (MJD 56829) can be attributed to the non-simultaneous observations with H.E.S.S., FACT and Swift-XRT. However, X-ray emissions in the energy bands 10-20 keV (Figure 1(c)) and 15-50 keV (Figure 1(b)) detected with MAXI and Swift-BAT respectively are consistent with constant emission within statistical uncertainties.
The HE –ray emission of Mrk 501 observed with Fermi-LAT as shown in Figure 1(a), also does not show any signature of variability during this period. The flux points with downward arrow in the Figure 1(a) represent 2 upper limits on the integral flux above 100 MeV for the observations when source is not significantly detected with Fermi-LAT. The constant emissions in UV, optical and radio bands depicted in Figure 1(e-g) respectively during the period June 15-30, 2014 (MJD 56823-56838) are consistent with the source behaviour known from the past observations. A positive correlation between VHE –ray emission above 750 GeV observed with FACT and X-rays in the energy range 2-10 keV had been reported by Cologna et al. (2016) for the above observation period. But, the correlation was violated during the TeV flaring activity observed on the night of June 23-24, 2014 (Cologna et al., 2016, 2015). This suggests that the physical parameters involved in the VHE –ray emission during the extreme flaring state may be different from the rest of the emissions observed from Mrk 501 Cologna et al. (2016). Different values of correlation index between the TeV and X-ray emissions can be derived depending on the assumed evolution scenario in different spectral bands under the frame-work of homogeneous single zone SSC model (Katarzyński et al., 2005). A quadratic or more than quadratic correlation between the TeV and X-ray flux points is expected for simultaneous emission from two independent zones, where one zone emits in X-ray band and other zone dominates at TeV –rays (Katarzyński and Walczewska, 2010). However, a quadratic correlation between soft X-ray and TeV –ray flux points during the flaring activity can be explained for a specific choice under the framework of single zone SSC model when the source activity is attributed to the variation in the leptonic particle density (Singh et al., 2017; Sahayanathan et al., 2018). In this case, TeV flux due to SSC process varies quadratically with respect to X-ray flux produced by the synchrotron process. Referring to the VHE flare detected by the H.E.S.S. telescopes, the TeV light curve in the energy range 2-20 TeV has been divided into two sub energy bands: 2-4.5 TeV and 4.5-20 TeV (Figure 2 in Chakraborty and Cologna (2015)). Variations at short timescale are observed in both energy bands. The detailed temporal analysis of the VHE light curve is beyond the scope of the present study.
| Energy band | Instrument | Constant flux (erg s) | /dof |
|---|---|---|---|
| 0.1-300 GeV | Fermi/LAT | (2.300.31) | 0.86/7 |
| 15-50 keV | Swift/BAT | (1.170.12) | 0.66/11 |
| 10-20 keV | MAXI | (6.100.68) | 0.36/5 |
| 0.3-10 keV | Swift/XRT | (4.520.26) | 234/11 |
| 203 nm (W2 band) | Swift/UVOT | (3.360.07) | 9.8/10 |
| 223 nm (M2 band) | Swift/UVOT | (2.720.03) | 2/10 |
| 263 nm (W1 band) | Swift/UVOT | (2.540.09) | 25/11 |
| 350 nm (U band) | Swift/UVOT | (3.400.05) | 0.78/2 |
| 432 nm (B band) | Swift/UVOT | (5.250.02) | 0.49/2 |
| 540 nm (V band) | Swift/UVOT | (7.680.04) | 0.13/2 |
| 15 GHz (Radio) | OVRO | (1.760.02) | 2.34/2 |
4.2 Variability analysis
The variability present in the flux values simultaneously measured in different energy bands would provide useful information regarding the physical processes involved in the emission mechanism at the source. In order to search for the intrinsic variability in the near simultaneous multi-wavelength light curves obtained for the period June 15-30, 2014 during the TeV flaring activity of Mrk 501, we have estimated the fractional variability amplitude (Fvar) parameter. We have used the description proposed in (Vaughan et al., 2003) to estimate the fractional variability amplitude in different energy bands from radio to HE –rays. Fvar is defined as
| (1) |
where is the average flux, S is the standard deviation and is the mean square error of N-flux measurements of a given light curve. Realizing that the variability is not clearly detected (weak intrinsic amplitude or low signal-to-noise ratio) in the multi-wavelength light curves shown in Figure 1, the uncertainty in Fvar can be estimated using the expression (Vaughan et al., 2003)
| (2) |
We have estimated the values of Fvar for all the energy bands from radio to HE –rays during the period June 15-30, 2014 (MJD 56823-56838) of Mrk 501 observations. It is to be noted that for Fermi-LAT data, Fvar has been calculated using only the detected flux points and excluding the upper limits as shown in the light curve. The values of Fvar are obtained to be negligibly small for OVRO, Swift-UVOT, MAXI, Swift-BAT and Fermi-LAT observations during the above period. However, the soft X-ray emission in the energy range 0.3-10 keV observed with Swift-XRT is found to be significantly varying with the value of Fvar 0.230.07 during the VHE flaring activity. The value of Fvar 0.110.03 has been estimated for VHE –ray emission in the energy range 2–20 TeV during the flaring state of the source observed for 2.1 hours on the night of June 23-24, 2014 (MJD 56831.86-56831.94) by the H.E.S.S. telescopes (Chakraborty and Cologna, 2015). It is observed that the estimated value of Fvar for the soft X-ray variability is compatible with the VHE variability observed quasi-simultaneously by H.E.S.S. during the flaring activity. However, it can be noted that the estimated value of Fvar for a given light curve also depends on the size of the time bin. A light curve with smaller time bin can give higher value of Fvar, whereas larger time bins can smooth out the flux variations in the light curve and yield lower value of Fvar. The values of Fvar estimated for soft X-rays and TeV –rays support the synchrotron and SSC emission models for the blazars like Mrk 501.
4.3 Optical Polarization and TeV flare
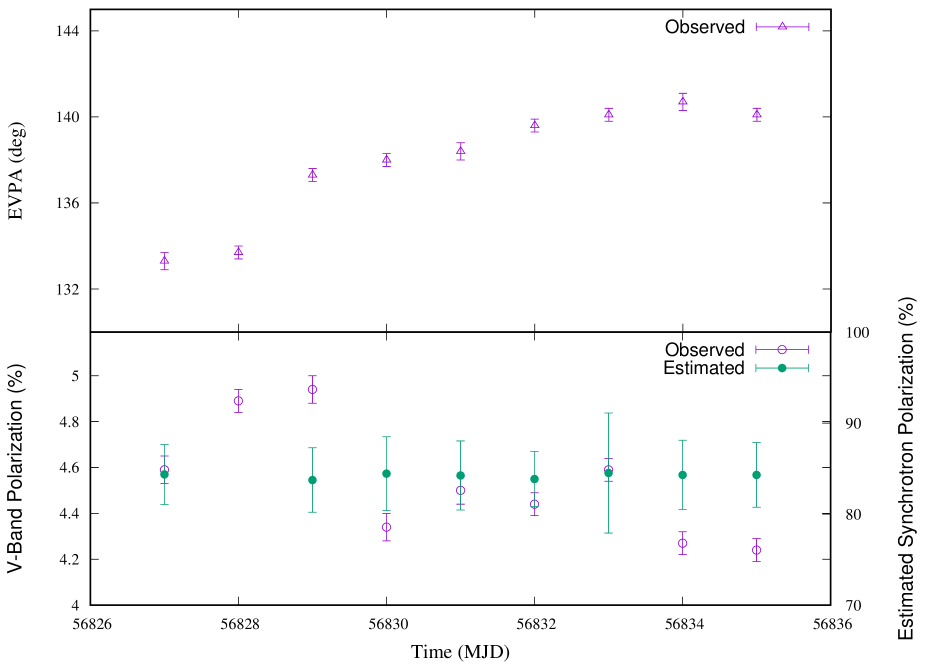
Polarization studies of relativistic outflows in extreme astrophysical environments like blazar jets provide important tools to probe the geometry of the magnetic field in the emission region and to identify physical processes for the non-thermal emission. The observables of polarization of electromagnetic radiation emitted from blazars are degree of polarization () and electric vector position angle (EVPA) or simply polarization angle (). The degree of polarization is the fraction of total flux which is polarized, whereas EVPA provides information about the orientation of electric field vector in the sky plane. The optical polarization also directly indicates the ordering of magnetic field in the jet. The time variation of degree of polarization in the optical V-band and associated EVPA measured from Mrk 501 by the SPOL telescope during the period June 15-30, 2014 (MJD 56823-56838) is shown in Figure 2. The degree of polarization in the V-band optical emission of the blazar Mrk 501 is observed to be constant with an average value of 4.5, whereas EVPA changes from 133∘ to a maximum of 141∘ with a rotation rate of 1∘ per day during the above period. It is to be noted that the degrees of polarization from SPOL measurements shown in Figure 2 are not corrected for thermal emission from host galaxy. The variation in EVPA is nearly simultaneous with the flaring activity of the source in the soft X-ray and TeV energy bands. The observed possible coincidence of soft X-ray and VHE –ray flares with change in optical polarization angle provides evidence for involvement of the synchrotron and SSC processes in the broad-band emission of the source.
The measurement of synchrotron polarization is the standard approach to investigate the properties of magnetic field and energy distribution of emitting electrons in the blazar jet (Westfold, 1959; Itoh et al., 2016). If the underlying energy distribution of leptons (electrons and positrons) emitting synchrotron radiation is described by a power law with spectral index , the maximum degree of linear polarization for a given direction of the magnetic field (ordered) is given by (Westfold, 1959; Rybicki and Lightman, 1986; Marscher, 2014)
| (3) |
The spectral distribution of synchrotron photons emitted from the source is also described by a power law with spectral index , which is related to as
| (4) |
Equation 3 gives maximum degree of polarization for the synchrotron radiation in an ordered magnetic field. We have estimated the maximum degree of polarization () for synchrotron radiation using the values of photon spectral indices () obtained from the Swift-XRT analysis (Table 1) in equations 3 & 4. The values of maximum synchrotron polarization calculated from the soft X-ray observations have been compared with the V-band optical polarization measured by SPOL at Steward Observatory in Figure 2 (bottom panel). It is evident from Figure 2 that the maximum synchrotron polarization () during the period of our study has an average value of more than 80, which is much higher than the observed V-band optical polarization with an average value of 4.5. The large difference between observed and estimated maximum polarization values can be attributed to the various physical effects like tangled and inhomogeneous magnetic field (Gruzinov and Waxman, 1999), Faraday rotation and presence of thermal components in the optical emission from the host galaxy (Netzer, 2013). The host galaxies of low redshift blazars like Mrk 501 are huge and luminous with elliptical morphology (Hyvönen et al., 2007; Nilsson et al., 2007). The previous optical studies of Mrk 501 indicate that the subtraction of host galaxy contamination is correlated with the observed magnitudes of the source. A reasonable host galaxy subtraction has been found from the optical photometry of the blazar Mrk 501 (Feng et al., 2017). Therefore, the thermal emission from the host galaxy of Mrk 501 has strong impact on the observed polarization of the source. Also, no clear correlation is observed between the V-band optical flux and degree of polarization during the period of TeV flaring activity detected by the H.E.S.S. telescopes. This can be attributed to the presence of turbulent magnetic field in the jet emission region. Detailed study of the depolarization effects like random magnetic field in the jet emission region and thermal contamination from the host galaxy emission is beyond the scope of this work.
4.4 X-ray Spectral Evolution
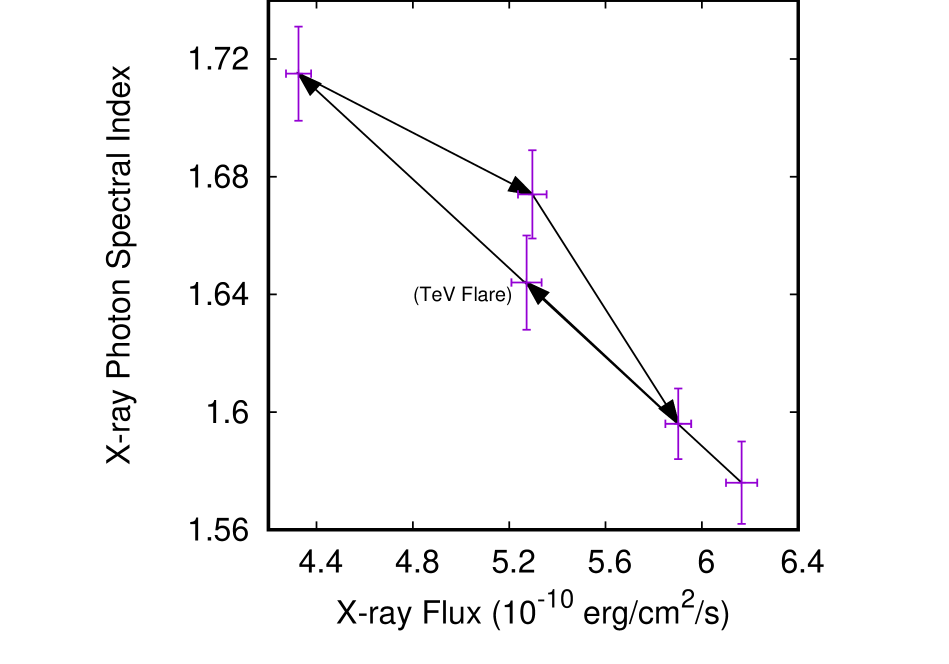
The spectral evolution in the blazar emission helps in investigating the acceleration and cooling features in the jet. This is acheived by analysing the hysteresis patterns of the photon spectral index as function of the source integral flux. The spectral evolution of soft X-ray emission observed with Swift-XRT in the energy range 0.3-10 keV during the VHE flaring activity of Mrk 501 detected with H.E.S.S. on June 23, 2014 (MJD 56831.86-56831.94) is shown in Figure 3. The Swift-XRT measurements shown in Figure 3 correspond to the observation period during June 21-24, 2014 (MJD 56829-56832) including the period of VHE flaring activity. We observe that the soft X-ray photon spectral index is anti-correlated with the integral flux in the energy range 0.3-10 keV and indicates the presence of a possible clockwise hysteresis loop structure in the spectral index versus flux plane showing harder-when-brighter behavior.
4.5 Estimation of active region parameter from observables
The source paremeter like Doppler factor () can be estimated from the minimum variability timescale observed in the emission of the source. The rapid variability, apparent superluminal motion and high bolometric luminosity observed in blazar emission indicate that the broad band non-thermal emission of blazars is produced in a compact active region, relativistically moving along the jet oriented towards the observer. The flux variability from radio to VHE –rays at timescales from seconds to years is an important observational characteristics of blazars powered by supermassive black holes at the center of elliptical host galaxy. Blandford-Znajek mechanism suggests that the jets in blazars are powered by the extraction of rotational energy from the supermassive black holes at the center (Blandford and Znajek, 1977). For a maximally rotating supermassive black hole of mass , the gravitaional radius is given by
| (5) |
where is the universal gravitational constant and is the speed of light. An observer can see into the hot dense, highly magnetized plasma in the inner parts of the jet forming region, whose size will be of the order of (O’ Riordan et al., 2016). Assuming that the emitted radiation is dominated by the turbulent plasma of the jet forming region close to the event horizon, the minimum variability timescale in the comoving frame () would be comparable to the event horizon light crossing time () which is given by
| (6) |
Relativistic boosting in the blazar emission leads to the shortening of the observed variability timescale () as compared to the variability timescale in the comoving frame () given by
| (7) |
where is the redshift of the source. With the assumption that , the observed minimum variability timescale gives
| (8) |
The host galaxy of blazar Mrk 501 harbours a supermassive black hole of mass 2.2 109 at its center (Barth et al., 2002). The flare of Mrk 501 detected by H.E.S.S. on the night of June 23-24, 2014 (MJD 56831.86-56831.94) at TeV energies shows fast flux variations on a timescale of 6 minutes (Chakraborty and Cologna, 2015). Using these observed quantities in equation 8, we have estimated the value of Doppler factor 31 which is compatible with the value of bulk Lorentz factor for very small jet viewing angle. This implies that the hypothesis that the jet forming region in the blazar Mrk 501 is close to the event horizon of the supermassive black hole at the center of its host galaxy.
5 Summary
The main motivation for this work is to study the major TeV flaring activity state of the high energy synchrotron peaked blazar Mrk 501 observed by the FACT and H.E.S.S. telescopes on the night of June 23-24, 2014 in the multi-wavelength context from radio to GeV –rays. The TeV flux variations observed during this unprecedented flaring activity are characterized by the flux doubling timescale of few minutes (Chakraborty and Cologna, 2015). This has provided a unique opportunity to explore the physical process involved in the jet emission during the high activity state of the source. We have used multi-wavelength data collected during the period June 15-30, 2014 on Mrk 501 from the observations with various ground and space-based telescopes covering the electromagnetic spectrum from radio to high energy –rays. The important points derived from this study are :
-
1.
Near simultaneous multi-wavelength light curves do not show significant change in the source activity from radio to high energy –ray emission except for the soft X-rays in the energy range 0.3-10 keV detected by Swift-XRT during the period June 15-30, 2014.
-
2.
In soft X-rays, the highest activity of the source is detected on June 21, 2014 whereas the VHE flaring activity above 2 TeV is observed on the night of June 23-24, 2014 for a very short duration of 2.1 hours.
-
3.
Variability analysis of the multi-wavelength light curves using fractional variability amplitude also indicates that the source exhibits negligible variations in radio, UV/Optical, X-rays in 10-20 keV and 15-50 keV bands and HE –rays in the energy range 0.1-100 GeV. However, soft X-ray emission of the source in the energy range 0.3-10 keV is observed to vary significantly with the variability amplitude value compatible with that estimated for the TeV light curve during the flaring activity. This can be understood in the frame-work of the synchrotron and SSC model with specific physical condition, wherein, the variation in source emission activity is entirely attributed to the sudden change of the particle density in the emission region. In this case, a quadratic correlation is expected between TeV and soft X-ray flux points.
-
4.
The degree of polarization in optical V-band and electric vector position angle are observed to be uncorrelated. The observed optical polarization has an average value of 4.5 during the TeV flaring activity whereas electric vector position increases gradually with an average rate of 1∘ per day during this period. The estimated values of synchrotron polarization emitted by a power law distribution of electrons/positrons in an ordered magnetic field are more than 80 which are much higher than the observed values of V-band optical polarization. These large differences between the two values of degree of polarization may arise due to presence of different conditions like inhomogeneous and tangled magnetic field and dominance of thermal component in the optical emission from the accretion disk.
-
5.
The minimum variability timescale of the TeV flux points measured by the H.E.S.S. telescopes during flaring state of the source gives Doppler factor 31. This indicates that the jet forming region in the HSP blazar Mrk 501 is near to the event horizon of the supermassive black hole at the center of the host galaxy and radiation is emitted from the turbulent plasma in the jet forming region.
The TeV flaring activity of Mrk 501 in June 2014 has been observed by the FACT and H.E.S.S. telescopes with a flux level comparable to the historical flare of the source detected in April 1997 (Djannati-Atai et al., 1999). The observed differential energy spectrum in the energy range 330 GeV-13 TeV was described by a log-parabola model with significant curvature during the flaring activity detected in April 1997. However, during June 2014 flare, the intrinsic differential energy spectrum of Mrk 501 is represented by a simple power law model with no evidence of curvature or cut-off in the energy range 2-20 TeV (Lorentz et al., 2016). Also, more than quadratic correlation between soft X-ray and TeV –ray photons was computed during the flaring activity in April 1997 (Katarzyński et al., 2005), iwhereas a linear correlation is violated during the TeV flaring activity in June 2014 (Cologna et al., 2016). The differential energy spectra of TeV photons during the flaring activities of Mrk 501 measured on two nights in June-July 2005 were also described by log-parabolic function with significant curvature (Albert et al., 2007). The flux variability in the two nights in 2005 is similar to the one discussed in the present study. A decrease in the optical polarization and change in EVPA by 15∘ was observed during the strong VHE flaring activity of Mrk 501 detected on May 1, 2009 with flux level five times the Crab Nebula flux (Aliu et al., 2016). In the present study, no variation in the optical polarization is observed, whereas EVPA changes with a rotation rate of 1∘ per day during the TeV flaring activity. The optical and HE –ray emissions do not show any correlation with the TeV flaring activity considered in the present study. The HE –ray emission indicates low activity state of the source during the near simultaneous TeV flaring activity. This can not be explained in the frame-work of simple one SSC model and possibly indicates the presence of two emission zones during the flaring activity of the source.
Acknowledgements
We thank the anonymous reviewers for their helpful suggestions and comments to improve the contents of the manuscript. We acknowledge the use of public data obtained through Fermi Science Support Center (FSSC) provided by NASA. This work made use of data supplied by the UK Swift Science Data Centre at the University of Leicester. This research has made use of the MAXI data, provided by RIKEN, JAXA and the MAXI team. Data from the Steward Observatory spectropolarimetric monitoring project were used. This program is supported by Fermi Guest Investigator grants NNX08AW56G, NNX09AU10G, NNX12AO93G, and NNX15AU81G. Radio data at 15 Ghz is used from OVRO 40 M Telescope and this Fermi blazar monitoring program is supported by NASA under award NNX08AW31G, and by the NSF under AST-0808050.
References
- Abdo et al. (2010) Abdo, A. A., Ackermann, M., Agudo, I., Ajello, M., Aller, H. D., Aller, M. F., Angelakis, E., Arkharov, A. A., Axelsson, M., Bach, U., et al., Jun. 2010. The Spectral Energy Distribution of Fermi Bright Blazars. ApJ, 716, 30–70.
- Abdo et al. (2011) Abdo, A. A., Ackermann, M., Ajello, M., et al., Feb. 2011. Insights into the High-energy -ray Emission of Markarian 501 from Extensive Multifrequency Observations in the Fermi Era. ApJ, 727, 129.
- Acciari et al. (2011) Acciari, V. A., Arlen, T., Aune, T., et al., Mar. 2011. Spectral Energy Distribution of Markarian 501: Quiescent State Versus Extreme Outburst. ApJ, 729, 2.
- Acero et al. (2015) Acero, F., Ackermann, M., Ajello, M., et al., Jun. 2015. Fermi Large Area Telescope Third Source Catalog. ApJS, 218, 23.
- Ackermann et al. (2016) Ackermann, M., Anantua, R., Asano, K., et al., Jun. 2016. Minute-timescale 100 MeV -Ray Variability during the Giant Outburst of Quasar 3C 279 Observed by Fermi-LAT in 2015 June. ApJL, 824, L20.
- Agudo et al. (2011) Agudo, I., Marscher, A. P., Jorstad, S. G., et al., Jul. 2011. On the Location of the -Ray Outburst Emission in the BL Lacertae Object AO 0235+164 Through Observations Across the Electromagnetic Spectrum. ApJL, 735, L10.
- Aharonian (2002) Aharonian, F. A., May 2002. Proton-synchrotron radiation of large-scale jets in active galactic nuclei. MNRAS, 332, 215–230.
- Albert et al. (2007) Albert, J., Aliu, E., Anderhub, H., et al., Nov. 2007. Variable Very High Energy -Ray Emission from Markarian 501. ApJ, 669, 862–883.
- Aleksić et al. (2015) Aleksić, J., Ansoldi, S., Antonelli, L. A., et al., Jan. 2015. Multiwavelength observations of Mrk 501 in 2008. A&A, 573, A50.
- Aliu et al. (2016) Aliu, E., Archambault, S., Archer, A., et al., Oct. 2016. Very high energy outburst of Markarian 501 in May 2009. A&A, 594, A76.
- Atwood et al. (2009) Atwood, W. B., Abdo, A. A., Ackermann, M., et al., Jun. 2009. The Large Area Telescope on the Fermi Gamma-Ray Space Telescope Mission. ApJ, 697, 1071–1102.
- Barth et al. (2002) Barth, A. J., Ho, L. C., Sargent, W. L. W., Feb. 2002. Stellar Velocity Dispersion and Black Hole Mass in the Blazar Markarian 501. ApJL, 566, L13–L16.
- Barthelmy et al. (2005) Barthelmy, S. D., Barbier, L. M., Cummings, J. R., et al., Oct. 2005. The Burst Alert Telescope (BAT) on the SWIFT Midex Mission. SSRv, 120, 143–164.
- Bartoli et al. (2012) Bartoli, B., Bernardini, P., Bi, X. J., et al., Oct. 2012. Long-term Monitoring of Mrk 501 for its Very High Energy Emission and a Flare in 2011 October. ApJ, 758, 2.
- Blandford and Znajek (1977) Blandford, R. D., Znajek, R. L., May 1977. Electromagnetic extraction of energy from Kerr black holes. MNRAS, 179, 433–456.
- Böttcher et al. (2013) Böttcher, M., Reimer, A., Sweeney, K., Prakash, A., May 2013. Leptonic and Hadronic Modeling of Fermi-detected Blazars. ApJ, 768, 54.
- Bradbury et al. (1997) Bradbury, S. M., Deckers, T., Petry, D., et al., Apr. 1997. Detection of -rays above 1.5TeV from MKN 501. A&A, 320, L5–L8.
- Burrows et al. (2005) Burrows, D. N., Hill, J. E., Nousek, J. A., et al., Oct. 2005. The Swift X-Ray Telescope. SSRv, 120, 165–195.
- Cerruti et al. (2015) Cerruti, M., Zech, A., Boisson, C., Inoue, S., Mar. 2015. A hadronic origin for ultra-high-frequency-peaked BL Lac objects. MNRAS, 448, 910–927.
- Chakraborty and Cologna (2015) Chakraborty, N., Cologna, G., Jul. 2015. Rapid variability at very high energies in Mrk 501. In: 34th International Cosmic Ray Conference (ICRC2015). Vol. 34 of International Cosmic Ray Conference. p. 872.
- Chandra et al. (2017) Chandra, P., Singh, K. K., Rannot, R. C., et al., Jul. 2017. Multiwavelength study of VHE emission from Markarian 501 using TACTIC observations during April-May, 2012. NewA, 54, 42–51.
- Cologna et al. (2016) Cologna, G., Chakraborty, N., Jacholkowska, A., Lorentz, M., Mohamed, M., Perennes, C., Romoli, C., Wagner, S. J., Alicja Wierzcholska for the H. E. S. S. Collaboration, Daniela Dorner for the FACT Collaboration, Kurtanidze, O., Nov. 2016. The Exceptional Flare of Mrk 501 in 2014: Combined Observations with H.E.S.S. and FACT. ArXiv e-prints:1611.03983.
- Cologna et al. (2015) Cologna, G., Chakraborty, N., Mohamed, M., et al., Sep. 2015. Spectral characteristics of Mrk 501 during the 2012 and 2014 flaring states. ArXiv e-prints:1509.04458.
- Dermer et al. (1992) Dermer, C. D., Schlickeiser, R., Mastichiadis, A., Mar. 1992. High-energy gamma radiation from extragalactic radio sources. A&A, 256, L27–L30.
- Djannati-Atai et al. (1999) Djannati-Atai , A., Piron, F., Barrau, A., et al., Oct. 1999. Very High Energy Gamma-ray spectral properties of MKN 501 from CAT Čerenkov telescope observations in 1997. A&A, 350, 17–24.
- Falomo et al. (2014) Falomo, R., Pian, E., Treves, A., Sep. 2014. An optical view of BL Lacertae objects. A&ARv, 22, 73.
- Feng et al. (2017) Feng, H.-C., Liu, H. T., Fan, X. L., Zhao, Y., Bai, J. M., Wang, F., Xiong, D. R., Li, S. K., Nov. 2017. Search for Intra-day Optical Variability in Mrk 501. ApJ, 849, 161.
- Furniss et al. (2015) Furniss, A., Noda, K., Boggs, S., et al., Oct. 2015. First NuSTAR Observations of Mrk 501 within a Radio to TeV Multi-Instrument Campaign. ApJ, 812, 65.
- Ghisellini et al. (2017) Ghisellini, G., Righi, C., Costamante, L., Tavecchio, F., Jul. 2017. The Fermi blazar sequence. MNRAS, 469, 255–266.
- Gruzinov and Waxman (1999) Gruzinov, A., Waxman, E., Feb. 1999. Gamma-Ray Burst Afterglow: Polarization and Analytic Light Curves. ApJ, 511, 852–861.
- Hyvönen et al. (2007) Hyvönen, T., Kotilainen, J. K., Falomo, R., Örndahl, E., Pursimo, T., Dec. 2007. The stellar content of low redshift BL Lacertae host galaxies from multicolour imaging. A&A, 476, 723–734.
- Itoh et al. (2016) Itoh, R., Nalewajko, K., Fukazawa, Y., et al., Dec. 2016. Systematic Study of Gamma-ray-bright Blazars with Optical Polarization and Gamma-Ray Variability. ApJ, 833, 77.
- Kalberla et al. (2005) Kalberla, P. M. W., Burton, W. B., Hartmann, D., et al., Sep. 2005. The Leiden/Argentine/Bonn (LAB) Survey of Galactic HI. Final data release of the combined LDS and IAR surveys with improved stray-radiation corrections. A&A, 440, 775–782.
- Kapanadze et al. (2017) Kapanadze, B., Dorner, D., Romano, P., Vercellone, S., Mannheim, K., Lindfors, E., Nilsson, K., Reinthal, R., Takalo, L., Kapanadze, S., Tabagari, L., Aug. 2017. The prolonged X-ray flaring activity of Mrk 501 in 2014. MNRAS, 469, 1655–1672.
- Katarzyński et al. (2005) Katarzyński, K., Ghisellini, G., Tavecchio, F., Maraschi, L., Fossati, G., Mastichiadis, A., Apr. 2005. Correlation between the TeV and X-ray emission in high-energy peaked BL Lac objects. A&A, 433, 479–496.
- Katarzyński and Walczewska (2010) Katarzyński, K., Walczewska, K., Feb. 2010. On the correlation between the X-ray and gamma-ray emission in TeV blazars. A&A, 510, A63.
- Krimm et al. (2013) Krimm, H. A., Holland, S. T., Corbet, R. H. D., et al., Nov. 2013. The Swift/BAT Hard X-Ray Transient Monitor. ApJS, 209, 14.
- Kushwaha et al. (2014) Kushwaha, P., Singh, K. P., Sahayanathan, S., Nov. 2014. Brightest Fermi-LAT Flares of PKS 1222+216: Implications on Emission and Acceleration Processes. ApJ, 796, 61.
- Lorentz et al. (2016) Lorentz, M., Brun, P., for the H. E. S. S. Collaboration, Jun. 2016. Limits on Lorentz invariance violation at the Planck energy scale from H.E.S.S. spectral analysis of the blazar Mrk 501. ArXiv e-prints:1606.08600.
- Mannheim (1993) Mannheim, K., Mar. 1993. The proton blazar. A&A, 269, 67–76.
- Maraschi et al. (1992) Maraschi, L., Ghisellini, G., Celotti, A., Sep. 1992. A jet model for the gamma-ray emitting blazar 3C 279. ApJL, 397, L5–L9.
- Marcha et al. (1996) Marcha, M. J. M., Browne, I. W. A., Impey, C. D., Smith, P. S., Jul. 1996. Optical spectroscopy and polarization of a new sample of optically bright flat radio spectrum sources. MNRAS, 281, 425–448.
- Marscher (2008) Marscher, A. P., Jun. 2008. The Core of a Blazar Jet. In: Rector, T. A., De Young, D. S. (Eds.), Extragalactic Jets: Theory and Observation from Radio to Gamma Ray. Vol. 386 of Astronomical Society of the Pacific Conference Series. p. 437.
- Marscher (2014) Marscher, A. P., Jan. 2014. Turbulent, Extreme Multi-zone Model for Simulating Flux and Polarization Variability in Blazars. ApJ, 780, 87.
- Matsuoka et al. (2009) Matsuoka, M., Kawasaki, K., Ueno, S., et al., Oct. 2009. The MAXI Mission on the ISS: Science and Instruments for Monitoring All-Sky X-Ray Images. PASJ, 61, 999–1010.
- Nalewajko et al. (2014) Nalewajko, K., Sikora, M., Begelman, M. C., Nov. 2014. Reconciling Models of Luminous Blazars with Magnetic Fluxes Determined by Radio Core-shift Measurements. ApJL, 796, L5.
- Netzer (2013) Netzer, H., Nov. 2013. The Physics and Evolution of Active Galactic Nuclei.
- Nilsson et al. (2007) Nilsson, K., Pasanen, M., Takalo, L. O., Lindfors, E., Berdyugin, A., Ciprini, S., Pforr, J., Nov. 2007. Host galaxy subtraction of TeV candidate BL Lacertae objects. A&A, 475, 199–207.
- O’ Riordan et al. (2016) O’ Riordan, M., Pe’er, A., McKinney, J. C., Nov. 2016. Effects of Spin on High-energy Radiation from Accreting Black Holes. ApJ, 831, 62.
- Pohl and Schlickeiser (2000) Pohl, M., Schlickeiser, R., Feb. 2000. On the conversion of blast wave energy into radiation in active galactic nuclei and gamma-ray bursts. A&A, 354, 395–410.
- Poole et al. (2008) Poole, T. S., Breeveld, A. A., Page, M. J., et al., Jan. 2008. Photometric calibration of the Swift ultraviolet/optical telescope. MNRAS, 383, 627–645.
- Quinn et al. (1996) Quinn, J., Akerlof, C. W., Biller, S., et al., Jan. 1996. Detection of Gamma Rays with E 300 GeV from Markarian 501. ApJL, 456, L83.
- Rani et al. (2013) Rani, B., Lott, B., Krichbaum, T. P., Fuhrmann, L., Zensus, J. A., Sep. 2013. Constraining the location of rapid gamma-ray flares in the flat spectrum radio quasar 3C 273. A&A, 557, A71.
- Readhead et al. (1978) Readhead, A. C. S., Cohen, M. H., Pearson, T. J., Wilkinson, P. N., Dec. 1978. Bent beams and the overall size of extragalactic radio sources. Nature, 276, 768–771.
- Richards et al. (2011) Richards, J. L., Max-Moerbeck, W., Pavlidou, V., et al., Jun. 2011. Blazars in the Fermi Era: The OVRO 40 m Telescope Monitoring Program. ApJS, 194, 29.
- Roming et al. (2005) Roming, P. W. A., Kennedy, T. E., Mason, K. O., et al., Oct. 2005. The Swift Ultra-Violet/Optical Telescope. SSRv, 120, 95–142.
- Rybicki and Lightman (1986) Rybicki, G. B., Lightman, A. P., Jun. 1986. Radiative Processes in Astrophysics.
- Sahayanathan et al. (2018) Sahayanathan, S., Sinha, A., Misra, R., Mar. 2018. Broadband spectral fitting of blazars using XSPEC. Research in Astronomy and Astrophysics 18, 035.
- Schmidt et al. (1992) Schmidt, G. D., Stockman, H. S., Smith, P. S., Oct. 1992. Discovery of a sub-megagauss magnetic white dwarf through spectropolarimetry. ApJL, 398, L57–L60.
- Sikora et al. (1994) Sikora, M., Begelman, M. C., Rees, M. J., Jan. 1994. Comptonization of diffuse ambient radiation by a relativistic jet: The source of gamma rays from blazars? ApJ, 421, 153–162.
- Singh et al. (2017) Singh, K. K., Sahayanathan, S., Sinha, A., et al., Jul. 2017. A time dependent approach to model X-ray and -ray light curves of Mrk 421 observed during the flare in February 2010. NewA, 54, 24–29.
- Smith et al. (2009) Smith, P. S., Montiel, E., Rightley, S., et al., Dec. 2009. Coordinated Fermi/Optical Monitoring of Blazars and the Great 2009 September Gamma-ray Flare of 3C 454.3. ArXiv e-prints:0912.3621.
- Sokolov et al. (2004) Sokolov, A., Marscher, A. P., McHardy, I. M., Oct. 2004. Synchrotron Self-Compton Model for Rapid Nonthermal Flares in Blazars with Frequency-dependent Time Lags. ApJ, 613, 725–746.
- Stocke et al. (1991) Stocke, J. T., Morris, S. L., Gioia, I. M., Maccacaro, T., Schild, R., Wolter, A., Fleming, T. A., Henry, J. P., Jul. 1991. The Einstein Observatory Extended Medium-Sensitivity Survey. II - The optical identifications. ApJS, 76, 813–874.
- Urry and Mushotzky (1982) Urry, C. M., Mushotzky, R. F., Feb. 1982. PKS 2155-304 - Relativistically beamed synchrotron radiation from a BL Lacertae object. ApJ, 253, 38–46.
- Urry and Padovani (1995) Urry, C. M., Padovani, P., Sep. 1995. Unified Schemes for Radio-Loud Active Galactic Nuclei. PASP, 107, 803.
- Vaughan et al. (2003) Vaughan, S., Edelson, R., Warwick, R. S., Uttley, P., Nov. 2003. On characterizing the variability properties of X-ray light curves from active galaxies. MNRAS, 345, 1271–1284.
- Westfold (1959) Westfold, K. C., Jul. 1959. The Polarization of Synchrotron Radiation. ApJ, 130, 241.