Multi-object spectroscopy of CL1821+643: a dynamically relaxed cluster with a giant radio halo?
Abstract
We present the study of the dynamical status of the galaxy cluster CL1821+643, a rare and intriguing cool-core cluster hosting a giant radio halo. We base our analysis on new spectroscopic data for 129 galaxies acquired at the Italian Telescopio Nazionale Galileo. We also use spectroscopic data available from the literature and photometric data from the Sloan Digital Sky Survey. We select 120 cluster member galaxies and compute the cluster redshift and the global line-of-sight velocity dispersion km s-1. The results of our analysis are consistent with CL1821+643 being a massive () dynamically relaxed cluster dominated by a big and luminous elliptical at the centre of the cluster potential well. None of the tests employed to study the cluster galaxies kinematics in the 1D (velocity information), 2D (spatial information), and 3D (combined velocity and spatial information) domains is able to detect significant substructures. While this picture is in agreement with previous results based on X-ray data and on the existence of the central cool core, we do not find any evidence of a merging process responsible for the radio halo discovered in this cluster. Thus, this radio halo remains an open problem that raises doubts about our understanding of diffuse radio sources in clusters.
keywords:
Galaxies: clusters: general. Galaxies: cluster: individual: CL1821+643. Galaxies: kinematics and dynamics.1 INTRODUCTION
A fraction of the most massive galaxy clusters exhibits in their inner regions diffuse radio sources named radio haloes (also giant radio haloes, or GRHs). They are extended (on 1 Mpc scales) unpolarized synchrotron sources produced by relativistic electrons and large-scale magnetic fields spread out the intracluster medium (ICM), not associated with compact radio sources like radio galaxies (see e.g., Feretti et al. 2012 for a review).
The existence of GRHs indicates the presence in the ICM of particle acceleration mechanisms. In particular, GRHs are probably related to turbulence induced in the ICM by recent mergers (e.g. Brunetti & Jones 2015). In fact, for several decades after their discovery, these sources have always been found in dynamically disturbed systems, i.e. massive merging clusters characterized by the absence of a cool core (Feretti et al. 2012 and references therein).
This picture has dramatically changed in 2014, when Bonafede et al. (2014, hereafter B14) published the discovery of a GRH in the cool-core cluster CL1821+643. More recently, Sommer et al. (2017) found diffuse radio emission at Mpc scale on two relaxed clusters, Abell 2390 and Abell 2261. Another case is Abell 2142 (), where Venturi et al. (2017) surprisingly found a GRH despite the fact that its optical and X-ray properties do not reveal a major merger. Finally, Savini et al. (2018) reported the detection of diffuse radio emission on scales larger than the core in the cool-core cluster PSZ1G139.61+24 ().
In summary, these recent findings suggest the possible existence of a new class of dynamically relaxed clusters with GRHs. In the framework of turbulent models this is surprising and challenges the idea that major mergers, necessary to power GRHs, always disrupt the cool core.
In this paper, we focus on one of the puzzling clusters cited above: CL1821+643 (hereafter CL1821). CL1821 hosts an extended central diffuse emission with linear size and an extrapolated radio power W Hz-1 elongated along the SE–NW direction (see B14). Because of its location and size, B14 classified this source as a GRH.
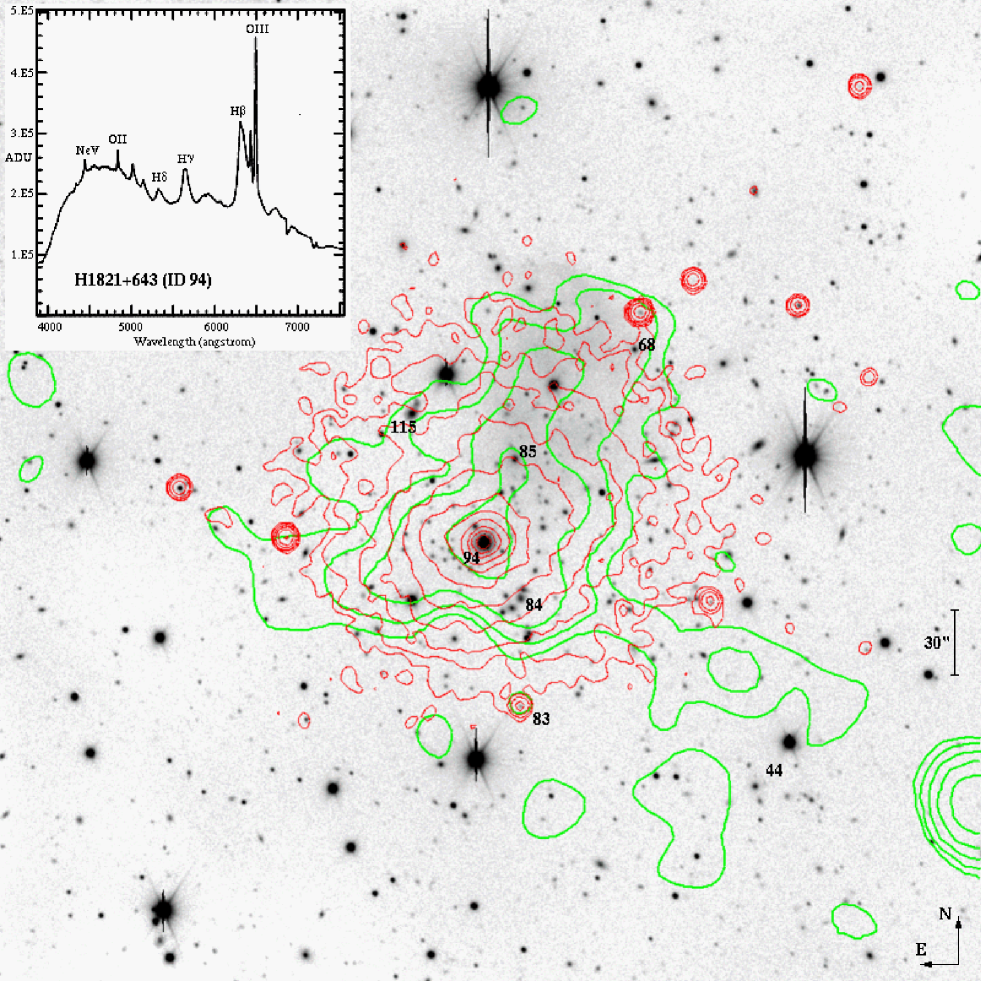
From the optical point of view, CL1821 (at 0.299, Schneider et al. 1992) is dominated by the central quasar H1821+643 (e.g. Hutchings & Neff 1991; Aravena et al. 2011; Reynolds et al. 2014; Walker et al. 2014), an uncommon example of an optically very luminous quasar hosted by the central dominant elliptical galaxy of a massive cluster (see Fig. 1). Moreover, CL1821 appears slightly elongated in the SE–NW direction, as inferred from its weak lensing properties (Wold et al. 2002). However, our present knowledge on this cluster is mainly based on X-ray data. Russell et al. (2010) analysed Chandra data taken with the ACIS-S instrument to study the ICM properties. In particular, they found that the ICM temperature drops from 9 to 1 keV, with a short central cooling time of 1 Gyr typical of a relaxed strong cool-core cluster. They also concluded that the quasar did not have a strong impact on the large-scale ICM properties.
The ACIS-S images suggest a projected morphology elongated on the SE–NW direction (a feature revealed also by radio and weak lensing data, see above and Fig. 1) but do not show any evidence of a major merger in this cluster similar to those detected in other clusters with GRHs. Moreover, an analysis of CL1821 based on classical X-ray morphological estimators (concentration parameter and power ratio ; see B14 and references therein) also supports the hypothesis that it is a relaxed galaxy system. Only the estimator (centroid shift parameter), could suggest the existence of an undergoing minor or off-axis merger (see B14).
A more recent work by Kale and Parekh (2016) partially disagrees with the findings of B14, claiming that a morphological analysis of the same Chandra data (based on the parameters Gini, , and ; see Parekh et al. 2015) puts CL1821 in the category of relaxed/non-relaxed clusters when H1821+643 is included/excluded in/from the analysis.
Nevertheless, the X-ray morphological indicators cited above are not sensitive to eventual mergers along the line of sight (LOS). The only way to explore this possibility and to finally assess the dynamical status of this intriguing cluster is to perform spectroscopic observations of the cluster member galaxies. In fact, the spatial and kinematical analysis of member galaxies constitute an effective tool to detect substructures in clusters and highlight eventual pre-merging subgroups or merger remnants (e.g. Boschin et al. 2004; Boschin et al. 2013). The optical information complements the results of X-ray studies, also considering that the collisional and non-collisional components of clusters (ICM and galaxies, respectively) exhibit different behaviours during mergers (see e.g. simulations by Roettiger et al. 1997).
At the moment only a few dozen of galaxies have known redshifts in an area 30 arcmin wide around H1821+643. Therefore, we decided to perform a spectroscopic survey of CL1821, mainly sampling the central 1 Mpc size region of the cluster characterized by the diffuse X-ray and radio emissions. In particular, we obtained new spectroscopic data at the Italian Telescopio Nazionale Galileo (TNG), whose facilities are well suited for the study of a galaxy cluster at like CL1821 (see e.g. the DARC project, Girardi et al. 2011 and references therein 111see also http://wwwuser.oats.inaf.it/girardi/darc, the web site of the DARC project.).
This paper is organized as follows. We describe the optical observations and present our spectroscopic data catalogue in Sect. 2. In Sect. 3 we explain the results of our analysis of the cluster structure. We discuss our results and present the conclusions in Sect. 4.
Throughout this paper, we use km s-1 Mpc-1 and km s-1 Mpc-1) in a flat cosmology with and . In the adopted cosmology, 1 arcmin corresponds to kpc at the cluster redshift. Unless otherwise stated, we indicate errors at the 68% confidence level (hereafter c.l.).
2 OBSERVATIONS AND BUILDING OF THE GALAXY CATALOGUE
2.1 TNG optical observations
We used the instrument DOLORES of the TNG to perform multi-object spectroscopic (MOS) observations of CL1821 in 2016 June (program CAT16A_15). In particular, we observed four MOS masks with the LR-B Grism222http://www.tng.iac.es/instruments/lrs obtaining spectra for 155 objects. The total exposure times were 5400s for three masks and 3600s for the last one.
We reduced the spectra with standard IRAF333IRAF is distributed by the National Optical Astronomy Observatories, which are operated by the Association of Universities for Research in Astronomy, Inc., under cooperative agreement with the National Science Foundation. tasks and were able to compute redshifts for 123 galaxies by using the classic cross-correlation technique (Tonry & Davis 1979). For another six galaxies (IDs. 11, 31, 67, 72, 113, and 180, see Table 1) we estimated the redshifts by measuring the wavelength location of prominent emission lines in their spectra (see details of the redshift computation and their errors in Boschin et al. 2013).
2.2 Spectroscopic catalogue and prominent galaxies
We also explored the NASA/IPAC Extragalactic Database (NED)444NASA/IPAC Extragalactic Database is operated by the Jet Propulsion Laboratory, California Institute of Technology, under contract with the National Aeronautics and Space Administration. to search for galaxies with known redshift lying in the field covered by our spectroscopic survey. In total, we found a set of 72 galaxies with measured redshift. 14 of these galaxies are in common with our TNG data. Since there is no evidence of systematic deviations between these 14 literature redshifts and our measurements, we added the remaining 58 NED galaxies to our sample.
Our final spectroscopic catalogue includes 187 galaxies in the field of CL1821. For all the galaxies, we also use photometric information from the Sloan Digital Sky Survey (SDSS) DR13 in the magnitude bands and .
Table 1 lists the velocity catalogue (see also Fig. 2): identification number of each galaxy, ID (Column 1); equatorial coordinates right ascension and declination, and (J2000, Column 2); (dereddened) SDSS magnitude (Column 3); heliocentric radial velocities, (Column 4) with errors; (Column 5).
The cluster galaxy population is dominated by the quasar H1821+643 (ID 94 and hereafter BCG; see its optical spectrum in Fig. 1). Although classified as a radio-quiet quasar, the BCG is a Fanaroff–Riley type I source (Blundell & Rawlings 2001), and is evident in high-resolution radio images of CL1821 taken by B14 (see their fig. 1) and at X-ray wavelengths. ID 85 is the second brightest cluster member in our catalogue and is also an FR-I (head–tail) radio galaxy (Lacy et al. 1992; Blundell & Rawlings 2001). B14 report a bright and elongated radio source 2.9 arcmin SW of BCG (their source “D”), at only 3 arcsec from the member galaxy ID 44, which is the probable optical counterpart. Among other galaxies with radio and/or X-ray emission in the field of CL1821, our galaxy ID 83 is a background active galactic nucleus with z0.88. Fainter radio sources (from B14) appear associated to our galaxies ID 68 (a cluster member) and 84 and 115 (foreground non-member galaxies).
3 ANALYSIS OF THE SAMPLE
3.1 Members selection and global properties
The selection of cluster members was performed using two statistical tools: the 1D adaptive-kernel method (hereafter 1D-DEDICA, Pisani 1993) and the “shifting gapper” method (Fadda et al. 1996). First, we ran 1D-DEDICA on the 187 galaxies of our spectroscopic catalogue and detected CL1821 as a prominent velocity peak at populated by 131 provisional cluster members (see Fig 3). In the second step, we combined the spatial and velocity information for the provisional members by running the “shifting gapper” test. In particular, we chose a gap of 1000 km s(see also Girardi et al. 1996) and adopted for the cluster centre the location of the BCG. With this tool we rejected another eleven galaxies leading to a final sample of 120 cluster members, whose projected phase space is shown in Fig. 4.
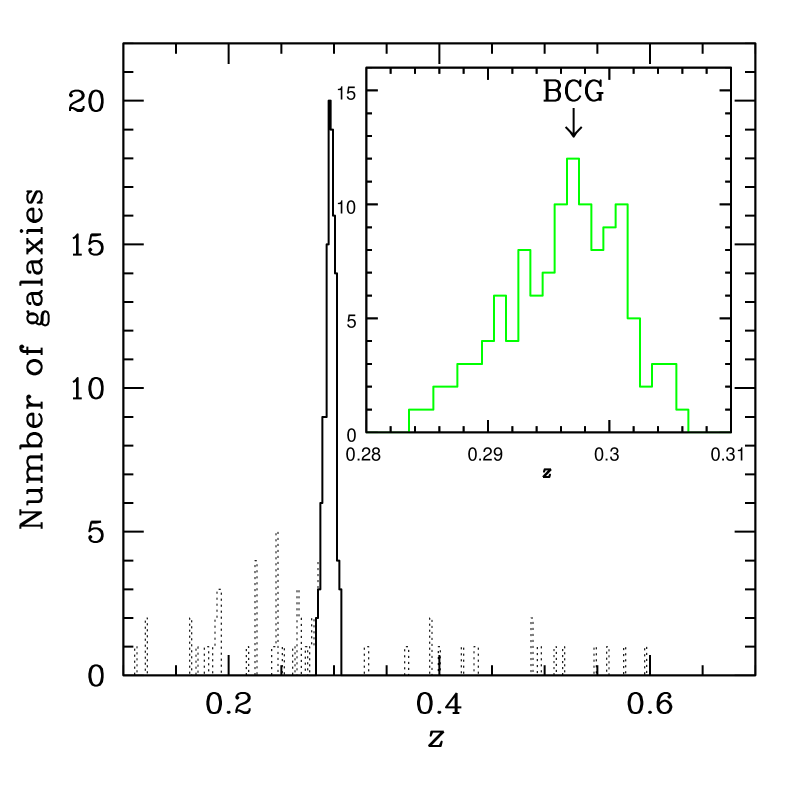
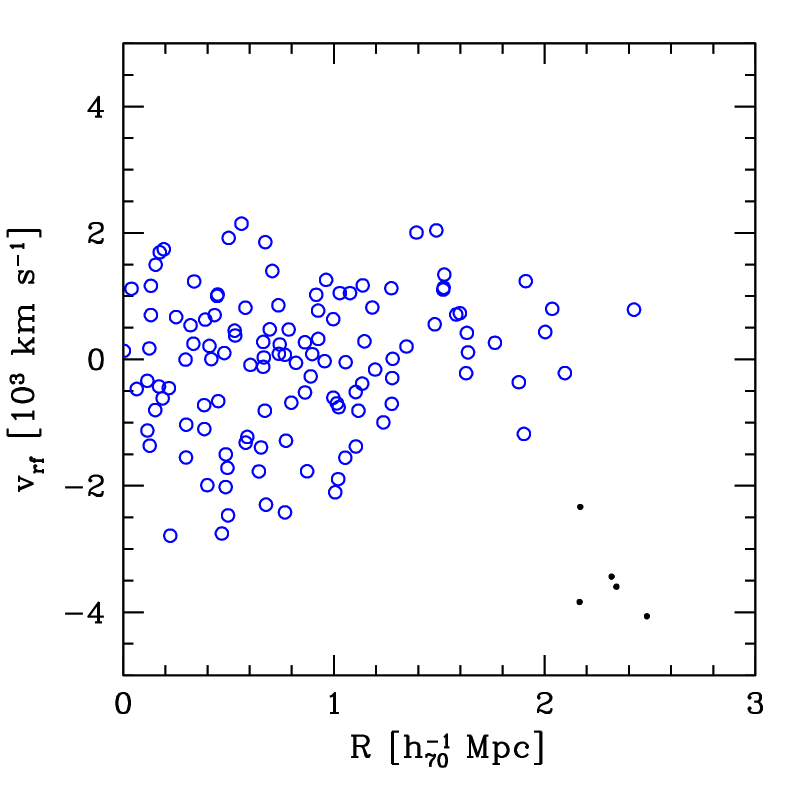
The velocity distribution of the 120 cluster members was analysed with the biweight routines by Beers et al. (1990), which provide robust estimates of location and scale. Our measurement of the mean cluster redshift is (i.e., km s-1). Instead, the global LOS velocity dispersion is km s-1. Adopting the - relation of Munari et al. (2013; derived from cosmological -body and hydrodynamic simulations in the -cold dark matter framework), we compute a total cluster mass of within Mpc.
3.2 Cluster substructures
We searched for substructures by using 1D (velocity information), 2D (spatial distribution), and 3D (combined velocity and spatial information) statistical tests.
The 1D analysis consists of a detailed study of the properties of the velocity distribution of member galaxies (Fig. 3). In particular, we do not find significant evidence of deviations from Gaussianity (a possible hint of complex dynamics in the cluster) according to several parameters (kurtosis, skewness, and tail index). Instead, there is marginal evidence of asymmetry according to the W-Test (% c.l.) and the asymmetry index (% c.l.; see Bird & Beers 1993 for details).
We also ran the 1D-Kaye Mixture Model test (1D-KMM; Ashman et al. 1994; see also for recent applications Girardi et al. 2008 and Balestra et al. 2016) to search for bimodal partitions of the velocity distribution fitting the data better than a single Gaussian. In the homoscedastic case (i.e. assuming equal velocity dispersions), the most likely solution (at the 95% c.l.) identifies two peaks at 87124 km sand 89428 km swith km s-1populated by 29 and 91 galaxies, respectively. According to the 2D Kolmogorov-Smirnov test, it is not possible to separate the two peaks in the spatial domain. Instead, in the physically more realistic (heteroscedastic, i.e. assuming different velocity dispersions) case, the 1D-KMM test does not provide any significant solution.
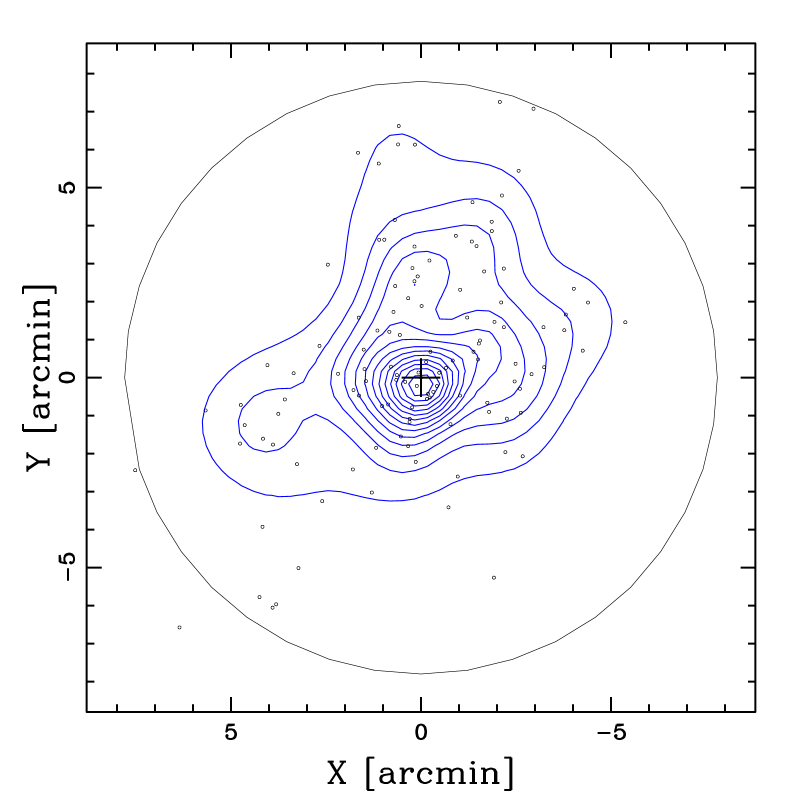
About the analysis of the 2D spatial distribution of the spectroscopic member galaxies, we employed the 2D adaptive-kernel method of Pisani et al. (1996, hereafter 2D-DEDICA). The results are shown in Fig. 5. This test detects CL1821 as a very prominent galaxy peak with two low-density secondary clumps: the densest one is located 2 arcmin N of the cluster centre (density only 35% the main peak) and the second one lies 4 arcmin ESE of the cluster centre (see also Table 2). However, the existence of these two low-density subclumps appears very questionable, also taking into account that our spectroscopic data do not cover the entire cluster field and are affected by magnitude incompleteness due to unavoidable constraints in the design of the MOS masks.
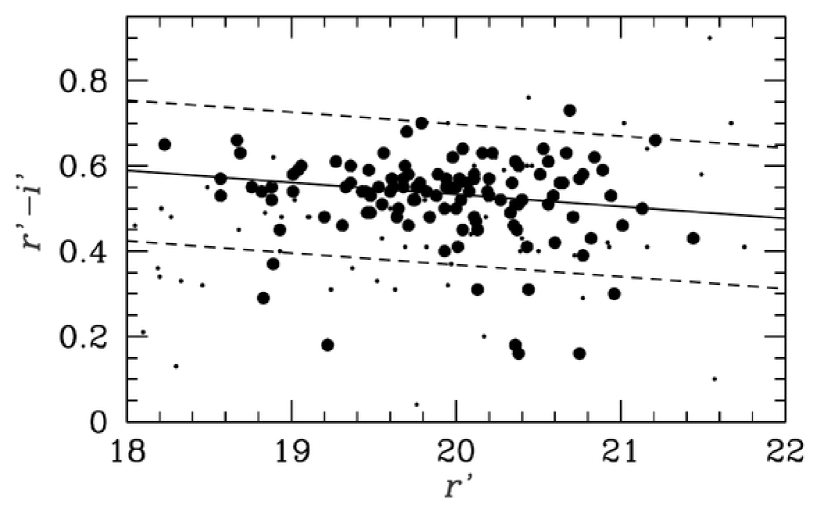
We can overcome our incompleteness problems by using the SDSS photometry of the cluster field at our disposal. In particular, we consider all the galaxies within 3 Mpc from the cluster centre and select likely members on the basis of the ( versus ) colour-magnitude relation (hereafter CMR), which allows to identify the locus of the dominant cluster population (i.e. early-type galaxies, Dressler 1980). We determine the CMR by applying the 2-clipping fitting procedure to the cluster members and obtain –=1.093-0.028 (see Fig. 6). Then, within the photometric catalogue we consider as likely “red” cluster members the galaxies with colour index within 0.16 mag of the CMR (i.e. the 1-error associated to the fitted intercept).
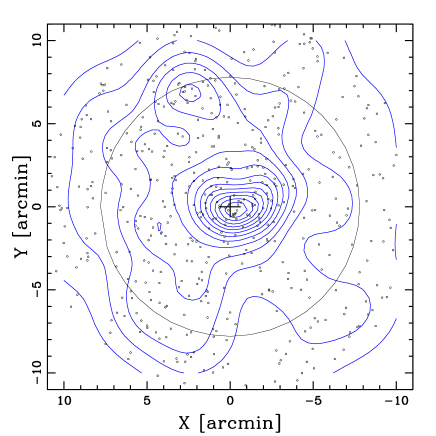
Figure 7 shows the contour map for the 508 likely cluster members having according to 2D-DEDICA. There is no trace now of the two subclumps found with the previous analysis, thus suggesting that they are artefacts due to the incompleteness of the spectroscopic sample. Instead, there is evidence of a more distant subgroup lying 2 Mpc () NNE of the cluster centre (see Table 3).
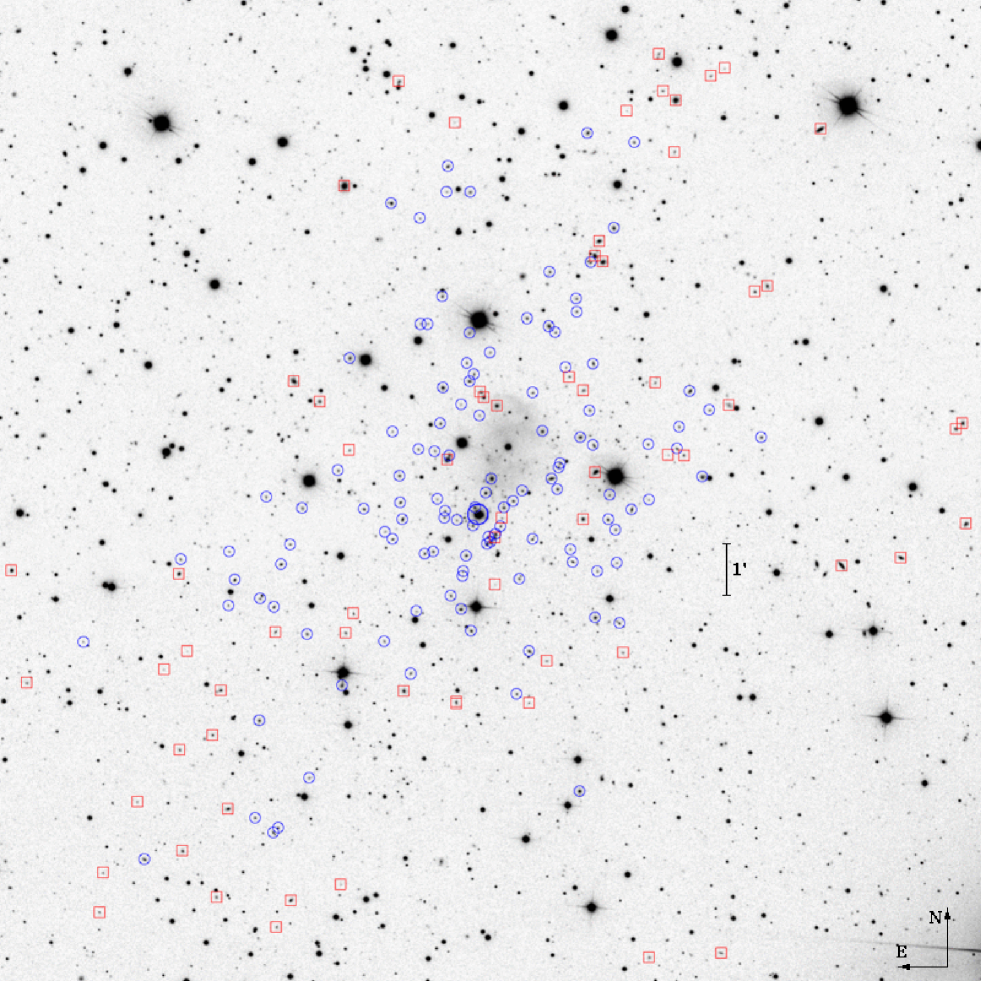
The existence of this external structure is also confirmed by the Voronoi Tessellation and Percolation (VTP) technique (e.g. Ramella et al. 2001; Barrena et al. 2005), a non-parametric test which is sensitive to galaxy structures regardless of their shapes. Considering again the 508 likely members with , we ran VTP over this set four times adopting four detection thresholds. The results are shown in Fig. 8, where galaxies identified as belonging to structures at 90, 95, 98, and 99% c.ls. are drawn as open squares, crosses, triangles, and solid circles, respectively. Once again VTP detects the main body of CL1821 without hints of substructures and the new external group at NNE, even though the last one is at the lowest c.l.

As for the 3D analysis, we employed different tools to search for a correlation between velocity and position information, which would be a clear sign of real substructures in the cluster.
First, we find no evidence of a significant velocity gradient (see e.g. den Hartog & Katgert 1996 and Girardi et al. 1996 for the details of the method) in the sample of the 120 spectroscopic cluster members.
Then, over the same sample we apply the classical -test (Dressler & Schectman 1988, hereafter DS test), which is considered as the most sensitive 3D test (e.g. Pinkney et al. 1996). For each spectroscopic member galaxy, the DS test computes the deviation defined as , where , and the subscript “loc” denotes the local quantities computed over the set containing the galaxy and its neighbours. The parameter is then defined as the sum of the of the individual galaxies and provides the cumulative deviation of the local kinematical parameters (mean velocity and velocity dispersion) from the global cluster parameters. The significance of , i.e. of substructure, is finally checked by running Monte Carlo simulations.
No significant substructure is found in CL1821 with the DS test and its modified versions, which consider separately the local mean velocity (parameter ) and velocity dispersion (parameter ) as kinematical indicators (see Girardi et al. 2010).
Finally, we resorted to the hierarchical tree (Htree) algorithm developed by Serna and Gerbal (1996; see also Girardi et al. 2011 and Durret et al. 2015 for recent applications). We apply it to the catalogue of 120 member galaxies with known radial velocities and -band magnitudes. The method executes a hierarchical clustering analysis and extracts galaxy subgroups by computing the relative binding energies of member galaxies. It has proved to be effective to detect substructures both in nearby clusters (e.g. Coma – Adami et al. 2005) and in medium-redshift clusters (e.g. Abell 1995 – Boschin et al. 2012a). It works with a constant value for the mass-to-light ratio of galaxies. Here we adopt a value of =150 (a value comparable to that of clusters, see Serna & Gerbal 1996), but the gross results are quite robust against the choice of the value of . We also assume a magnitude for the host galaxy (the BCG) of the central quasar H1821+643 (from measurements performed by Hutchings and Neff 1991 and Floyd et al. 2004) and choose as the minimum number of galaxies in substructures (e.g. Durret et al. 2015). The Htree method does not find significant substructure in CL1821.
4 DISCUSSION AND CONCLUSIONS
The high values of the velocity dispersion km sand X-ray temperature keV (excluding the central cool core; Russell et al. 2010) of CL1821 are typical of hot, massive clusters (e.g. Girardi & Mezzetti 2001). Moreover, our estimate of and are consistent each other with the assumption of energy density equipartition between ICM and galaxies. In fact, we obtain , to be compared with 555 is the mean molecular weight and the proton mass.. This differs from what is commonly found in merging clusters hosting GRHs, where values of significantly greater than unity are often found (e.g. Abell 2744 – Boschin et al. 2006; Abell 2254 – Girardi et al. 2011; Abell 1758N – Boschin et al. 2012b; Abell 1351 – Barrena et al. 2014).
However, the most convincing evidence that CL1821 is not interested in a major merger comes from the absence of significant substructures according to the analysis of our optical data.
In particular, the analysis of the 2D galaxy distribution performed with the 2D-DEDICA test detects CL1821 as a very prominent and well- isolated galaxy peak. The only significant subclump is the one located at a projected distance of 2 Mpc NNE of the cluster centre and detected on the sample of “likely” members both with 2D-DEDICA (see Fig. 7 and Table 3) and with the VTP method (Fig. 8). Unfortunately, we have very few redshifts in the region of the subgroup, and its full characterization is not possible. However, its projected galaxy density makes of it a minor system at from the cluster centre, which does not seem able to perturb significantly the potential well of CL1821.
These findings in the spatial domain agree, as expected, with the lack of major substructures observed in Chandra X-ray data (B14; Russell et al. 2010). However, our main goal was to explore the existence of ongoing mergers along the LOS. The 1D velocity distribution of member galaxies would provide a decisive contribution in this sense. Our results do not show strong evidence of departure from Gaussianity and asymmetry, which would be important signs of a dynamically perturbed cluster. The 1D-KMM test proposes a marginally significant partition of the velocity distribution in two peaks, but only in the physically (homoscedastic) less realistic case. In the heteroscedastic case, on the contrary, 1D-KMM does not find any significant solution for a bimodal (or more complex) partition of the velocity distribution.
Finally, combining the velocity and position information of member galaxies we do not find evidence of a significant velocity gradient. This suggests that eventual substructures would be mainly LOS aligned, but the results of the DS test and the Htree method agree with the negative findings of the 1D and 2D analysis.
In conclusion, our new optical data provide a picture of CL1821 consistent with being a massive dynamically relaxed cluster dominated by a BCG located in the centre of the cluster both in the velocity (see Fig. 3) and in the spatial domains. According to our results, the presence of a cool core in CL1821 is not surprising, even though a cool core is not necessarily disrupted if a cluster is affected by a merger with enough angular momentum (see e.g. simulations by Poole et al. 2008; Hahn et al. 2017).
Nevertheless, the absence of major substructures within 1.5-2 Mpc from the cluster centre is in conflict with the existence of the GRH discovered in CL1821.
Indeed, a major merger is not always needed to produce diffuse radio emission in a cluster. In fact, minor mergers are also predicted to form haloes with ultrasteep radio spectrum and low-radio power with respect to major mergers (e.g., Cassano et al. 2006; Brunetti et al. 2008), but leaving the cluster core intact. This could be the case of PSZ1G139.61+24 mentioned in Sect. 1 (Savini et al. 2018), a cool-core cluster with an associated mini-halo and a low-size (0.5 Mpc) and underluminous radio halo with a spectral index666We define the radio spectrum as . . However, the GRH hosted by CL1821 and the halo found in PSZ1G139.61+24 can be hardly compared with each other, especially considering that the GRH of CL1821 resembles more a “classical” radio halo, with a flatter spectrum () and a size of Mpc (see B14).
Instead, PSZ1G139.61+24 shares some similarities with Abell 2142, another cluster which is not a major merger but presents a two-component diffuse radio emission (Venturi et al. 2017). Its central brightest component has a spectral index similar to those of typical radio haloes and Venturi et al. (2017) propose that it could be powered by the gas sloshing in the centre of the cluster (similar to the scenario suggested for the formation of radio mini-haloes in cool-core clusters; see e.g., Mazzotta & Giacintucci 2008; ZuHone et al. 2013) with a central AGN activity which would provide seed electrons then reaccelerated in the ICM. If such a mechanism could play any role in explaining also the GRH of CL1821 is questionable. In fact, in terms of overall size and spectral steepness the GRH of CL1821 could partially resemble the diffuse emission in Abell 2142. Moreover, the central BCG (and perhaps also the second brightest member ID 85; see Sect. 2.2) could act as the AGNs located in the centre of Abell 2142. However, the differences between the two clusters are evident: CL1821 is a cool-core cluster and, according to our analysis, does not show obvious signs of recent mergers, while Abell 2142 is not a cool-core cluster and exhibits multiple cold fronts which are signs of past minor merger activity.
In conclusion, the existence of the GRH hosted by CL1821 remains an open problem, which brings into question our current understanding of cool-core clusters and diffuse radio emission in clusters.
Acknowledgments
We thank the anonymous referee for his/her useful comments and suggestions.
MG acknowledges the support from the grant MIUR PRIN 2015 “Cosmology and Fundamental Physics: illuminating the Dark Universe with Euclid”.
This publication is based on observations made on the island of La Palma with the Italian Telescopio Nazionale Galileo (TNG), which is operated by the Fundación Galileo Galilei – INAF (Istituto Nazionale di Astrofisica) and is located in the Spanish Observatorio of the Roque de Los Muchachos of the Instituto de Astrofísica de Canarias.
This research has made use of the galaxy catalogue of the Sloan Digital Sky Survey (SDSS). The SDSS web site is http://www.sdss.org/, where the list of the funding organizations and collaborating institutions can be found.
References
- Adami et al. (2005) Adami C., Biviano A., Durret F, Mazure A., 2005, A&A, 443, 17
- Aravena et al. (2011) Aravena M., Wagg J., Papadopoulos P. P., Feain I. J., 2011, ApJ, 737, 64
- Ashman et al. (1994) Ashman K. M., Bird C. M., Zepf S. E., 1994, AJ, 108, 2348
- Balestra et al. (2016) Balestra I., Mercurio A., Sartoris B., et al., 2016, ApJS, 224, 33
- Barrena et al. (2014) Barrena, R., Girardi M., Boschin W., De Grandi S., Rossetti M., 2014, MNRAS, 442, 2216
- Barrena et al. (2005) Barrena R., Ramella M., Boschin W., et al., 2005, A&A, 444, 685
- Beers et al. (1990) Beers T. C., Flynn K., Gebhardt K., 1990, AJ, 100, 32
- Bird & Beers (1993) Bird C. M., Beers, T. C., 1993, AJ, 105, 1596
- Blundell & Rawlings (2001) Blundell K. M., Rawlings S., 2001, ApJ, 562, L5
- Bonafede et al. (2014) Bonafede, A., Intema, H. T., Brüggen, M., et al., 2014, MNRAS, 444, L44 (B14)
- Boschin et al. (2013) Boschin W., Girardi M., Barrena R., 2013, MNRAS, 434, 772
- Boschin et al. (2004) Boschin W., Girardi M., Barrena R., et al., 2004, A&A, 416, 839
- Boschin et al. (2012a) Boschin W., Girardi M., Barrena R., et al., 2012a, A&A, 547, A44
- Boschin et al. (2012b) Boschin W., Girardi M., Barrena R., Nonino M., 2012b, A&A, 540, A43
- Boschin et al. (2006) Boschin W., Girardi M., Spolaor M., Barrena R., et al., 2006, A&A, 449, 461
- Brunetti & Jones (2015) Brunetti G., Jones T. W., 2015, Magnetic Fields in Diffuse Media, Astrophysics and Space Science Library, Vol. 407, Springer-Verlag Berlin Heidelberg, p. 557
- Brunetti et al. (2008) Brunetti G., Giacintucci S., Cassano R., et al., 2008, Nature, 455, 944
- Cassano et al. (2006) Cassano R., Brunetti G., Setti G., 2006, MNRAS, 369, 1577
- den Hartog & Katgert (1996) den Hartog R., Katgert P., 1996, MNRAS, 279, 349
- Dressler (1980) Dressler A., 1980, ApJ, 236, 351
- Dressler & Schectman (1988) Dressler A., Shectman S. A., 1988, AJ, 95, 985
- Durret et al. (2015) Durret F., Wakamatsu K., Nagayama T., Adami C., Biviano A., 2015, A&A, 583, A124
- Fadda et al. (1996) Fadda D., Girardi M., Giuricin G., Mardirossian F., Mezzetti M., 1996, ApJ, 473, 670
- Feretti et al. (2012) Feretti L., Giovannini G., Govoni F., Murgia M., 2012, A&ARv, 20, 54
- Floyd et al. (2004) Floyd D. J. E., Kukula M. J., Dunlop J. S., et al., 2004, MNRAS, 355, 196
- Girardi et al. (2011) Girardi M., Bardelli S., Barrena R., et al., 2011, A&A, 536, A89
- Girardi et al. (2008) Girardi M., Barrena R., Boschin W., Ellingson E., 2008, A&A, 491, 379
- Girardi et al. (2010) Girardi M., Boschin W., Barrena R., 2010, A&A, 517, A65
- Girardi et al. (1996) Girardi M., Fadda D., Giuricin G., et al., 1996, ApJ, 457, 61
- Girardi & Mezzetti (2001) Girardi M., Mezzetti M., 2001, ApJ, 548, 79
- Hahn et al. (2017) Hahn O., Martizzi D., Wu H.-Y., et al., 2017, MNRAS, 470, 166
- Hutchings & Neff (1991) Hutchings J. B., Neff S. G., 1991, AJ, 101, 2001
- Kale & Parekh (2016) Kale R., Parekh V., 2016, MNRAS, 459, 2940
- Lacy et al. (1992) Lacy M., Rawlings S., Hill G. J., 1992, MNRAS, 258, 828
- Mazzotta & Giacintucci (2008) Mazzotta P., Giacintucci S., 2008, ApJ, 675, L9
- Munari et al. (2013) Munari E., Biviano A., Borgani S., Murante G., Fabjan D., 2013, MNRAS, 430, 2638
- Parekh et al. (2015) Parekh V., van der Heyden K., Ferrari C., Angus G., Holwerda B., 2015, A&A, 575, A127
- Pinkney et al. (1996) Pinkney J., Roettiger K., Burns J. O., Bird C. M., 1996, ApJS, 104, 1
- Pisani (1993) Pisani A., 1993, MNRAS, 265, 706
- Pisani (1996) Pisani A., 1996, MNRAS, 278, 697
- Poole et al. (2008) Poole G. B., Babul A., McCarthy I. G., Sanderson A. J. R., Fardal M. A., 2008, MNRAS, 391, 1163
- Ramella et al. (2001) Ramella M., Boschin W., Fadda D., Nonino M., 2001, A&A, 368, 776
- Reynolds et al. (2014) Reynolds C. S., Lohfink A. M., Babul A., et al., 2014, ApJ, 792, L41
- Roettiger et al. (1997) Roettiger K., Loken C., Burns J. O., 1997, ApJS, 109, 307
- Russell et al. (2010) Russell H. R., Fabian A. C., Sanders J. S., et al., 2010, MNRAS, 402, 1561
- Savini (2018) Savini F., Bonafede A., Brüggen M., et al., 2018, MNRAS, 478, 2234
- Schneider (1992) Schneider D. P., Bahcall J. N., Gunn J. E., Dressler A., 1992, AJ, 103, 1047
- Serna & Gerbal (1996) Serna A., Gerbal D., 1996, A&A, 309, 65
- Sommer et al. (2017) Sommer M. W., Basu K., Intema H., et al., 2017, MNRAS, 466, 966
- Tonry & Davis (1979) Tonry J., Davis M., 1979, ApJ, 84, 1511
- Venturi (2017) Venturi T., Rossetti M., Brunetti G., et al., 2017, A&A, 603, A125
- Walker et al. (2014) Walker S. A., Fabian A. C., Russell H. R., Sanders J. S., 2014, MNRAS, 442, 2809
- Wold et al. (2002) Wold M., Lacy M., Dahle H., Lilje P. B., Ridgway S. E., 2002, MNRAS, 335, 1017
- ZuHone et al. (2013) ZuHone J., Markevitch M., Brunetti G., et al., 2013, ApJ, 762, 78