Physical conditions for the -process I. radioactive energy sources of kilonovae
Abstract
Radioactive energies from unstable nuclei made in the ejecta of neutron star mergers play principal roles in powering kilonovae. In previous studies power-law-type heating rates (e.g., ) have frequently been used, which may be inadequate if the ejecta are dominated by nuclei other than the region. We consider, therefore, two reference abundance distributions that match the -process residuals to the solar abundances for (light trans-iron plus -process elements) and (-process elements). Nucleosynthetic abundances are obtained by using free-expansion models with three parameters: expansion velocity, entropy, and electron fraction. Radioactive energies are calculated as an ensemble of weighted free-expansion models that reproduce the reference abundance patterns. The results are compared with the bolometric luminosity ( a few days since merger) of the kilonova associated with GW170817. We find that the former case (fitted for ) with an ejecta mass reproduces the light curve remarkably well including its steepening at days, in which the mass of -process elements is . Two -decay chains are identified: 66NiCuZn and 72ZnGaGe with similar halflives of parent isotopes ( days), which leads to an exponential-like evolution of heating rates during 1–15 days. The light curve at late times ( days) is consistent with additional contributions from the spontaneous fission of 254Cf and a few Fm isotopes. If this is the case, the event GW170817 is best explained by the production of both light trans-iron and -process elements that originate from dynamical ejecta and subsequent disk outflows from the neutron star merger.
1 Introduction
The discovery of a binary neutron star (NS) merger as the source of gravitational wave signals confirmed by advanced LIGO/Virgo (on August 17, 2017; GW170817, Abbott et al., 2017), followed by the detection of an electromagnetic counterpart across the entire wavelength range, has opened a window of the “multi-messenger astronomy” (see, e.g., Metzger, 2017). Among the latter, the observations of electromagnetic emission in optical and near-infrared ranges (kilonova, Li & Paczyński, 1998; Metzger et al., 2010) provided us with numerous clues to understanding the origin of heavy elements such as gold and uranium made by the rapid neutron-capture process (-process, see Thielemann et al., 2017, for a recent review).
The history of the -process study goes back to the seminal works by Burbidge et al. (1957) and Cameron (1957). Burbidge et al. (1957) supposed a sort of stellar explosions including core-collapse supernovae and Type Ia supernovae be the astrophysical site of the -process. Prior to these works, in Burbidge et al. (1956) a concept of the -process already has been presented by associating the light curves of Type Ia supernovae decaying in an exponential manner with the spontaneous fission of a transuranic species 254Cf (with a halflife of 60.5 days). It was before the identification of the decay chain 56NiCoFe (Colgate, 1969; Arnett, 1979) that actually powers Type Ia supernovae.
Since then, a main focus of the study of -process sites has been placed on core-collapse supernovae including prompt explosions (Schramm, 1973; Sato, 1974; Hillebrandt et al., 1976; Sumiyoshi et al., 2001; Wanajo et al., 2003) and more recently neutrino-driven explosions (Meyer et al., 1992; Woosley et al., 1994; Witti et al., 1994; Qian & Woosley, 1996; Cardall & Fuller, 1997; Otsuki et al., 2000; Wanajo et al., 2001; Thompson, 2001). However, recent studies exclude the former explosion mechanism (e.g., Kitaura et al., 2006; Janka et al., 2012) and suggest the latter be sources of only light trans-iron elements (e.g., Wanajo et al., 2011, 2013). Currently, only a magneto-rotationally induced explosion mechanism remains a viable possibility among the scenarios of core-collapse supernovae (Winteler et al., 2012; Nishimura et al., 2015, 2017; Mösta et al., 2017; Halevi & Mösta, 2018).
An alternative scenario, the decomposition of neutron-rich material from merging binary neutron stars (NSs, or a NS and a black hole) also was proposed as the sources of -process elements (Lattimer & Schramm, 1974; Symbalisty & Schramm, 1982; Eichler et al., 1989; Meyer, 1989). Early studies of the dynamical ejecta (resulting from tidal torque and shock heating) of NS mergers pointed the robust production of heavy -process nuclei () by a fission recycling in extremely neutron-rich environments (Freiburghaus et al., 1999; Goriely et al., 2011; Korobkin et al., 2012; Bauswein et al., 2013). More recent studies indicate, however, the production of all the -process species () in the ejecta with a wide range of neutron-richness owing to weak interactions (electron/positron and neutrino captures on free nucleons, Wanajo et al., 2014; Sekiguchi et al., 2015, 2016; Goriely et al., 2015; Radice et al., 2016; Papenfort et al., 2018). The post-merger outflows from the accretion disk orbiting around a remnant (a massive NS or a black hole) also were suggested as a site of the -process (Ruffert & Janka, 1999; Metzger et al., 2008; Surman et al., 2008; Wanajo & Janka, 2012). Recent studies indicate various possibilities such that the disk outflows are modestly (e.g., Just et al., 2015; Fujibayashi et al., 2018) or very (e.g., Wu et al., 2016; Siegel & Metzger, 2017; Fernández et al., 2018) neutron-rich.
Latest studies of Galactic chemical evolution imply that -process-enhanced halo stars reflect the nucleosynthetic yields from single NS merger events (Ishimaru et al., 2015; Beniamini et al., 2016; Safarzadeh & Scannapieco, 2017; Ojima et al., 2018). Spectroscopic analyses of Galactic halo stars also have been providing us with several important clues. The remarkable agreement of the abundance distributions of -process-enhanced halo stars with those of the solar -process component indicates a robust and single origin of -process elements (e.g., CS 22092-052, Sneden et al. 2003; CS 31082-001, Siqueira Mello et al. 2013). The stars observed in a recently discovered ultra-faint dwarf galaxy, Reticulum II, also exhibit solar-like -process abundance patterns (Ji et al., 2016; Ji & Frebel, 2018). However, such a remarkable agreement appears not to extend to the low- () and high- () ends; abundance variations of a factor of several can be seen in lighter elements (e.g., Sr, Y, and Zr, Sneden et al., 2008) as well as in actinides (e.g., Th, Holmbeck, 2018) with respect to those in between (e.g., Eu). More seriously, there are few measurable lines of light trans-iron elements () that compose the low-mass side of the -process residuals to the solar system abundances (e.g., Goriely, 1999). Currently, only Ga and Ge have been measured from the space for only a few halo stars (Sneden et al., 2008).
The identification of a kilonova (AT 2017gfo or SSS17a) associated with GW170817 has revealed the production of elements beyond iron in the NS merger (e.g., Arcavi et al., 2017; Chornock et al., 2017; Cowperthwaite et al., 2017; Kasen et al., 2017; Kasliwal et al., 2017; Nicholl et al., 2017; Pian et al., 2017; Smartt et al., 2017; Tanaka et al., 2017; Tanvir et al., 2017). While the early “blue” emission indicates a lanthanide-free () component in the ejecta (Metzger & Fernández, 2014; Kasen et al., 2015; Tanaka et al., 2018), the late-time ( a few days) emission in red-optical and near-infrared wavelengths confirms the presence of freshly synthesized lanthanides that have high opacities (Barnes & Kasen, 2013; Kasen et al., 2013; Tanaka & Hotokezaka, 2013). However, the inferred mass fraction of lanthanides and heavier in the ejecta is only – (e.g., Arcavi et al., 2017; Chornock et al., 2017; Nicholl et al., 2017; Waxman et al., 2017). It is questionable, therefore, if the merger made heavy -process elements such as gold and uranium. Moreover, such photometric analyses alone cannot discriminate between lanthanides and heavier elements.
Another problem is the large amount of ejecta from the merger; the inferred masses of the blue and red components are, respectively, – with the outflow velocity of ( is the speed of light) and with (e.g., Cowperthwaite et al., 2017; Nicholl et al., 2017). The total mass – is too large to be fulfilled by the dynamical ejecta of (Hotokezaka et al., 2013; Bauswein et al., 2013; Sekiguchi et al., 2016; Radice et al., 2016). The disk outflows may eject more material of – but with smaller velocity (, Dessart et al., 2009; Metzger & Fernández, 2014; Just et al., 2015; Siegel & Metzger, 2017; Shibata et al., 2017; Fujibayashi et al., 2018). Note that most of the above estimates for the kilonova ejecta were based on the power-law-type heating rates (e.g., erg g-1 s-1, where is time in days, Metzger et al., 2010; Wanajo et al., 2014) originating from the decaying radioactivities with .
In this paper we revisit the issue of the radioactive heating rates in NS merger ejecta, which is supposed to be the first of the series of papers that explore the physical conditions for the -process by using a multi-component free-expansion model described in § 2. Nucleosynthetic abundances are obtained by using free-expansion models that cover a wide range of parameters (expansion velocity, entropy, and electron fraction). The heating rates are then calculated as an ensemble of free-expansion models with their weighted abundances, which fit the -process residuals to the solar system abundances (Goriely, 1999) for two cases: a) and b) (§ 3). Obviously, the choice of reference abundance distributions are not unique; these two cases are taken for simplicity, in which the nuclei of and 130, respectively, play dominant roles for radioactive heating. The resultant heating rates are presented in § 4 with discussion on the contributions from -decay, -decay, and fission. In § 5, the heating rates for the two cases by adopting the thermalization efficiencies in Barnes et al. (2016) are compared with the kilonova light curve of the NS merger GW170817. Summary and conclusions follow in § 6.
2 Multi-component free-expansion model
First, we define a free expansion (FE) model to be used throughout this study. Provided that a spherically symmetric, homogeneous gaseous matter adiabatically expands with time , the temporal evolution of matter density is given by
| (1) |
where g cm-3 and km are taken as the density and radius at (a similar approach can be seen in Freiburghaus et al., 1999; Farouqi et al., 2010). Although the FE model (hereafter FE) itself is site-independent, these boundaries are chosen according to the result of the hydrodynamical simulation of a NS merger in Wanajo et al. (2014). The radial expansion velocity in Eq. (1) is assumed to be constant, which is one of free parameters in a FE described below.
An ensemble of FEs constitutes a multi-component FE (mFE) model such that the nucleosynthetic abundances satisfy
| (2) |
where is the abundance of the th isotope in the mFE, the abundance of the th isotope in the th FE, and a weight for the th FE (see a similar approach in Bouquelle et al., 1996; Goriely & Arnould, 1996). A set of ’s will be determined in § 3.
Each FE involves three free parameters, namely, a constant expansion velocity , an initial entropy (in units of Boltzmann constant per nucleon, ), and an initial electron fraction (proton-to-nucleon ratio) . In this study the ranges of these parameters are taken to be (0.05–0.30, 10–35, 0.01–0.50) with the intervals of (0.05, 5, 0.01). These cover the ranges in the bulk of dynamical ejecta (e.g., Wanajo et al., 2014) and disk outflows (e.g., Fujibayashi et al., 2018). In Eq. (2), therefore, the total number of FEs is .
Nucleosynthetic abundances for each FE are obtained by using a nuclear reaction network code, rNET, described in Wanajo et al. (2001, 2014). rNET consists of 6300 isotopes of –110 with experimental rates when available (e.g., JINA REACLIB V2.0111https://groups.nscl.msu.edu/jina/reaclib/db/index.php., Cyburt et al. 2010; Nuclear Wallet Cards222http://www.nndc.bnl.gov/wallet/) and theoretical estimates otherwise (e.g., TALYS, Goriely et al. 2008 for neutron, proton, and captures and GT2, Tachibana et al. 1990 for -decays with the HFB-21 mass prediction, Goriely et al. 2010). Neutrino captures are not included in this study. Theoretical (spontaneous, neutron-induced, and -delayed) fission properties adopted are those predicted from the HFB-14 mass model (Goriely et al., 2007). A single Gaussian-type distribution of fission fragments is assumed with a prompt emission of four neutrons per event. For the energy released per fission, an empirical law of average total kinetic energies
| (3) |
is taken from Viola et al. (1985). For , in which measured energies are appreciably greater than those in Eq. (3) ( in the present case), MeV is adopted (see, e.g., Figure 20 in Heßberger, 2017).
The nucleosynthesis calculation for each FE starts when the temperature decreases to 10 GK. The initial composition is determined to be and for free neutrons and free protons, respectively, which immediately attains nuclear statistical equilibrium (NSE) in such high temperature. The temperature in each timestep is computed from the density in Eq. (1), the entropy, and the isotopic composition by using a tabulated equation of state (Timmes & Swesty, 2000). The entropy generation from -decay, -decay, and fission at each timestep is taken into account.
3 Determination of abundance distributions
| Model | Reference aaRange of the atomic mass number of the residuals adopted for the recurrence method in Eq. (4). | bbMass fraction of -process elements (). | ccMass fraction of lanthanides and heavier (). | ddMass fraction of 66Zn (the daughter of 66Ni). | eeMass fraction of 72Ge (the daughter of 72Zn). | Th/EuffProduction ratio in number. | |
|---|---|---|---|---|---|---|---|
| mFE-a | 69–205 | 0.15 | 0.035 | 0.035 | 0.0073 | 0.84 | |
| mFE-b | 88–205 | 0.72 | 0.21 | 0.0044 | 0.0014 | 0.83 |
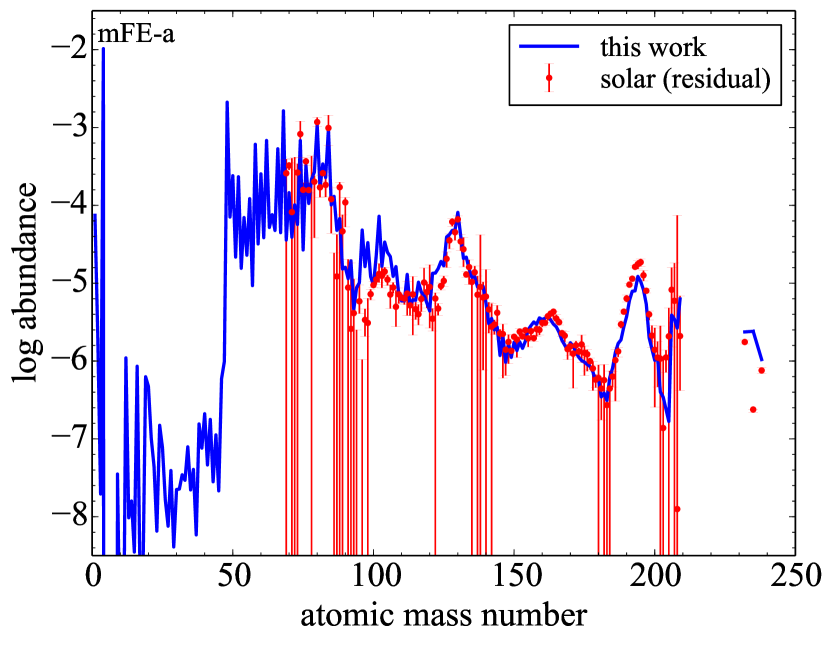
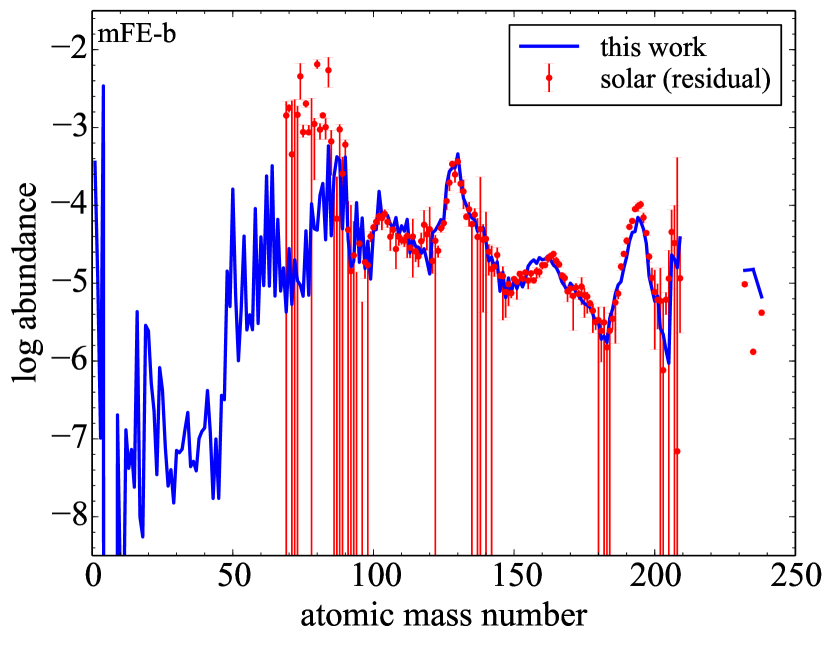
To obtain the weights ’s in Eq. (2), a reference abundance distribution should be chosen. For this purpose, we employ the -process residuals to the solar system abundances (by subtracting the -process component) as a function of (–238, red circles with error bars in Figure 1, Goriely, 1999). This may be justified because of the robustness of the abundance distributions in -process-enhanced stars, which match the solar -process pattern at least in the range . Note that the “-process residuals” with are merely those made by nucleosynthesis other than the -process. In fact, it is known that such nuclei can be produced in NSE under low and modestly low conditions (Hartmann et al., 1985; Meyer et al., 1998; Wanajo et al., 2018). To clarify this point, we refer to the components of and as “light trans-iron elements” and “-process elements”, respectively, and an ensemble of both as “residuals”.
For the reference abundance distribution, mFE is constructed by using a recurrence method described in Bouquelle et al. (1996),
| (4) |
with the initial weights of , where is the th abundance of the reference and runs over all reference nuclei with the total number . The abundances are normalized such as , , and , where indicates the th trial. The iteration is terminated when is satisfied.
In light of little information for the abundances of light trans-iron elements in -process-enhanced stars, we consider two mFEs, refer to as mFE-a and mFE-b hereafter, with the minimum a) (as in Goriely, 1999) and b) , respectively (Table 1, second column). The former represents the residual abundances of both light trans-iron and -process elements and the latter -process elements only. For both cases, those of are not included for the fitting procedure, which do not represent the yields at a nucleosynthetic event (but at the formation of the solar system). The determined nuclear abundances of mFE-a and mFE-b are displayed in Figure 1 (upper left and upper right, respectively) with those of the residuals that are shifted to match at . For both cases, mFEs reasonably reproduce the residual distribution over the adopted range. Note the co-production of abundances that are out of range ( and for mFE-a and mFE-b, respectively, and for both).
While the abundance patterns are similar to each other for , mFE-a results in 5 times smaller -process products. In fact, the mass fraction of -process elements () in mFE-a is only (3rd column in Table 1) because of the dominance of light trans-iron elements. As a result, the mass fraction of lanthanides and heavier () is (4th column in Table 1), which is comparable to the upper bound of estimates for GW170817 in the literature (, Chornock et al., 2017). In contrast, mFE-b gives large mass fractions of -process elements () and of lanthanides and heavier (); the latter is appreciably greater than the literture values.
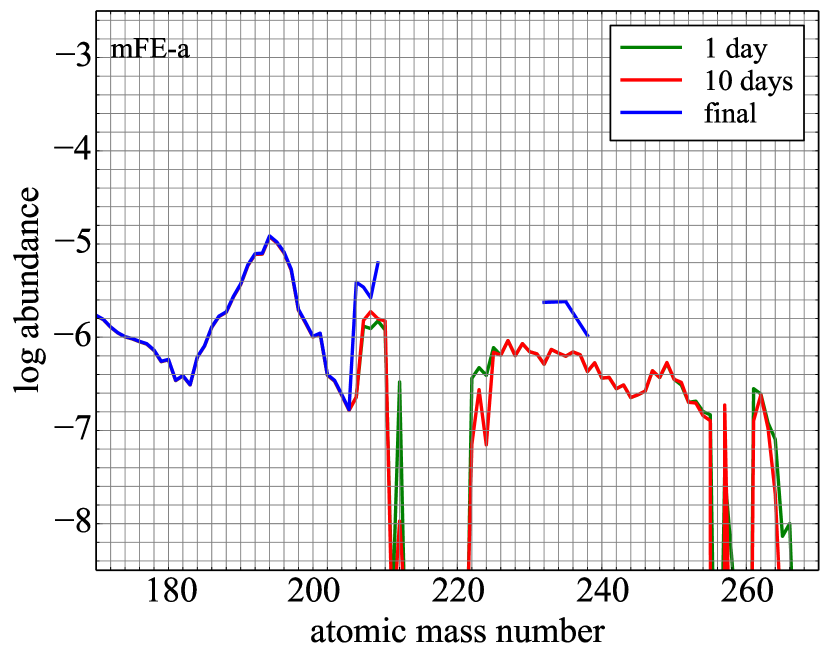
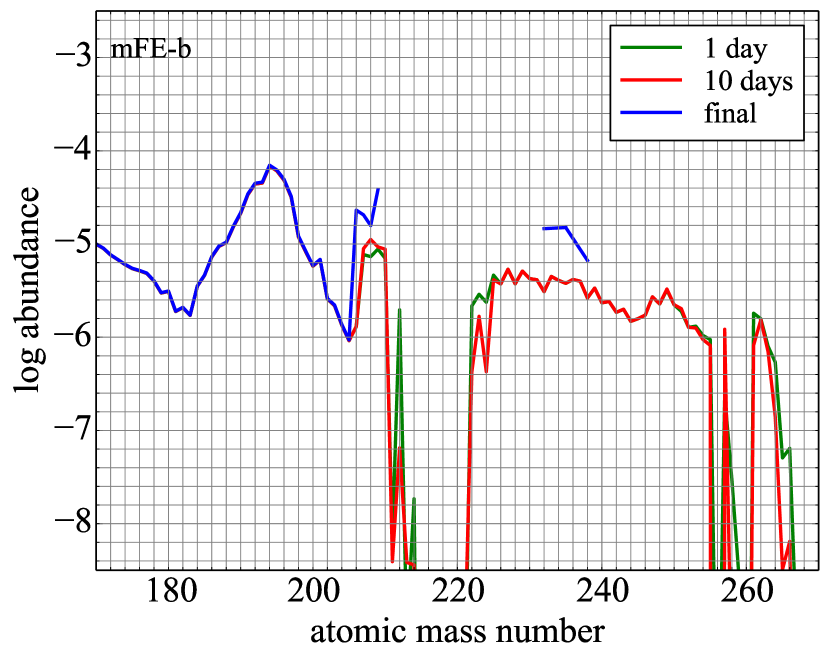
The bottom panels of Figure 1 display the trans-lead abundances at 1 and 10 days for mFE-a (left) and mFE-b (right). The abundance patterns are similar to each other and thus the final Th/Eu ratios are almost the same (7th column in Table 1). The abundances with already have decayed away by spontaneous fission of parent nuclei in the neutron-rich region. Transuranic nuclei up to remain including 254Cf and some Fm isotopes that contribute to the heating rates by spontaneous fission. Noted that these fissile nuclei are absent in Barnes et al. (2016, in their Figure 1). The reason of discrepancy is likely due to the different fission barriers that determine the lifetimes by spontaneous fission (see large variations of theoretical fission barriers in Figure 2 and resulting fissile regions in Figure 8 of Goriely, 2015).
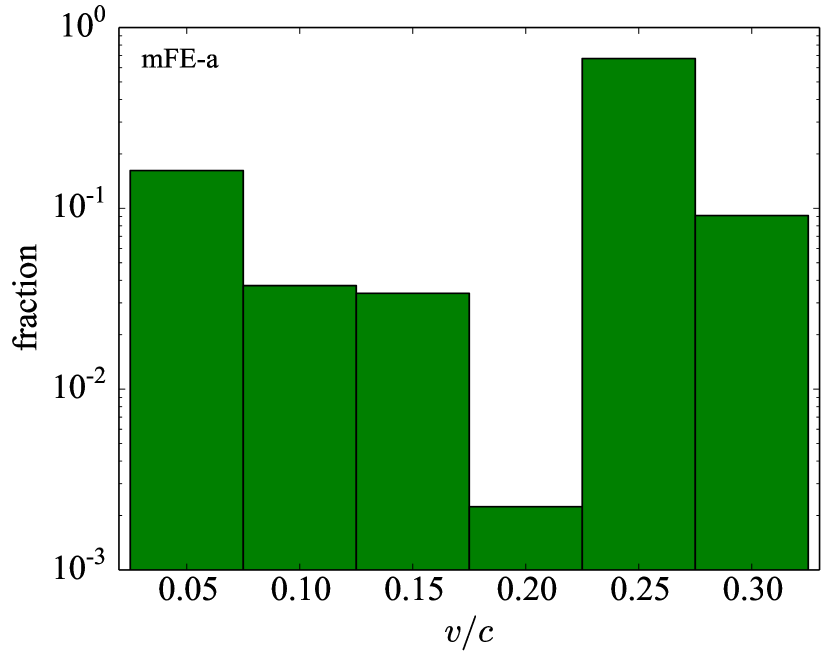
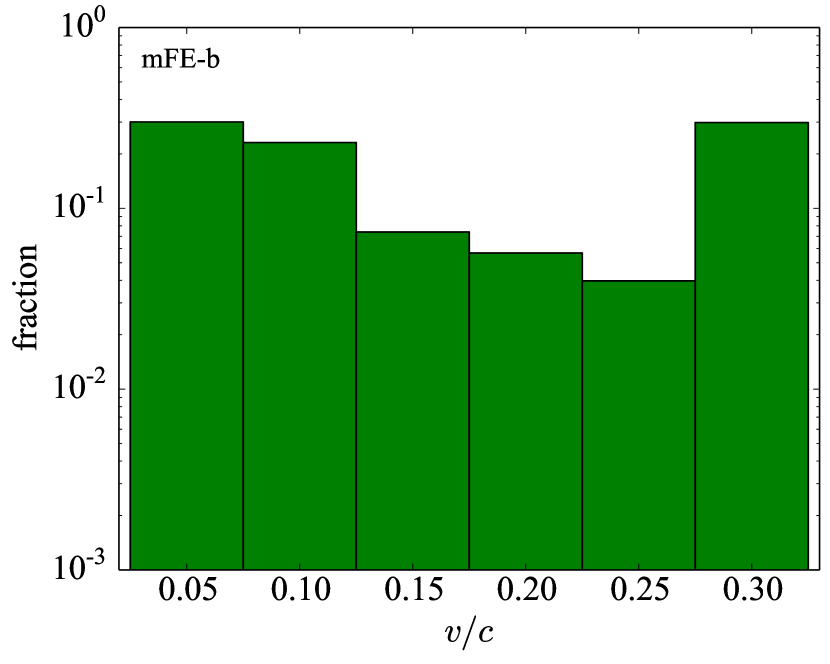
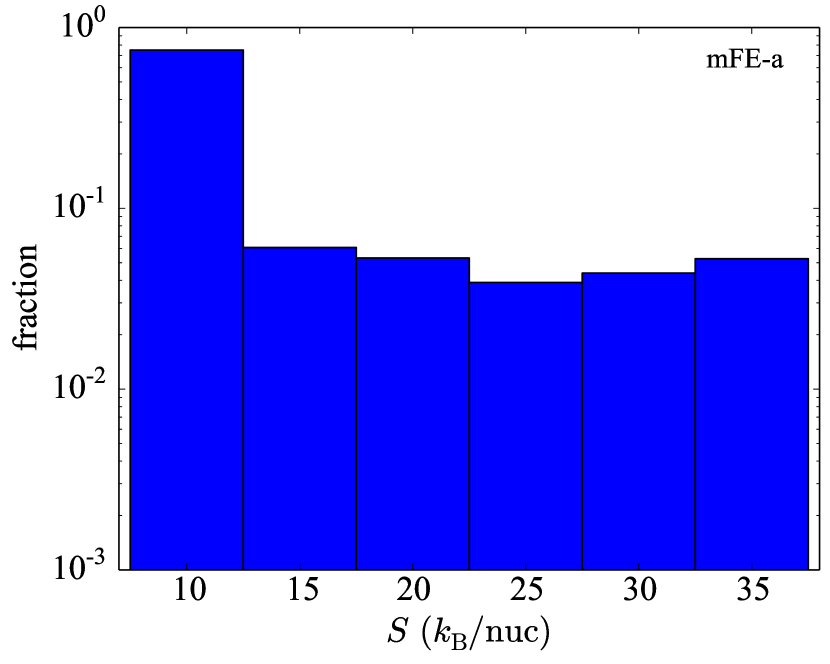
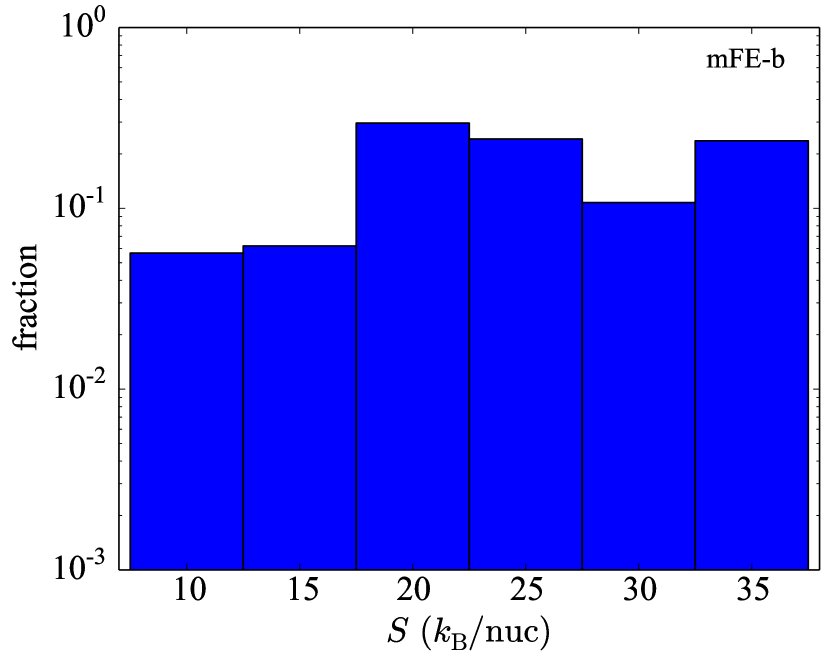
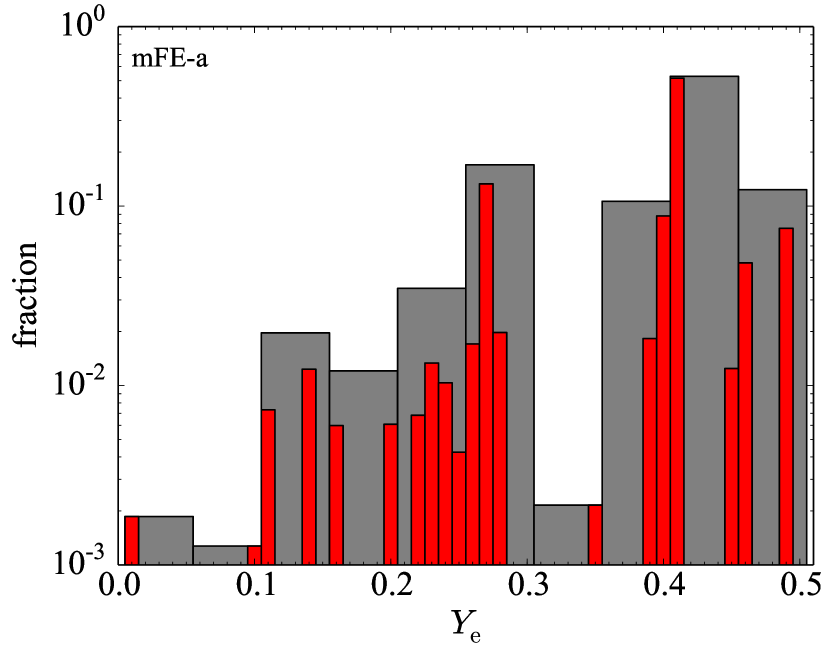
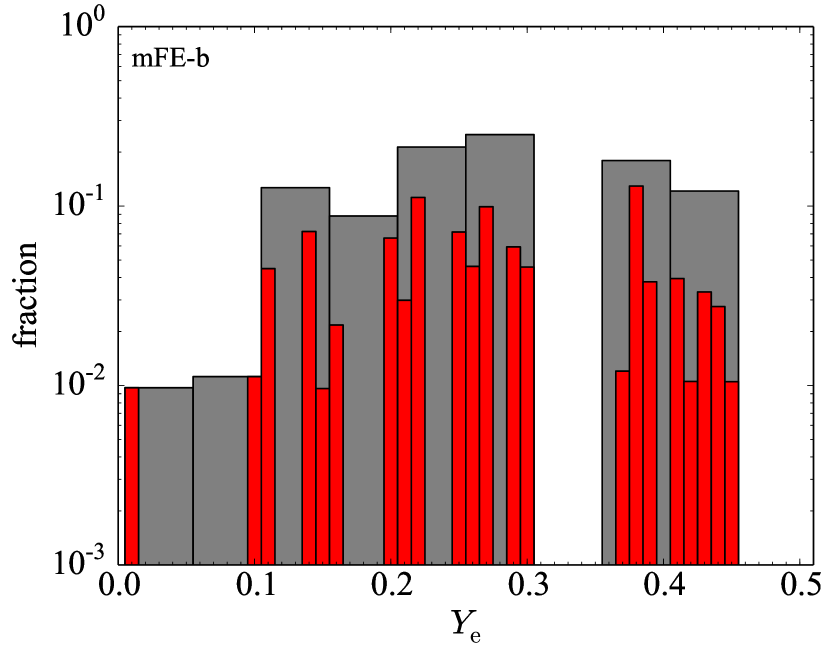
Figure 2 shows the fractions of (top), (middle), and (bottom) over the parameter ranges for mFE-a (left) and mFE-b (right). For , such discrete distributions may be unphysical and due to numerical reasons (in which a small number of FEs are preferentially taken in the recurrence relation). For the purposes of subsequent discussion, the fractions grouped with an interval of are also shown by gray histograms. Note that the recurrence method does not guarantee the physical weights of ’s be unique when the solution degenerates in the -space. It should also be noted that the uncertainties in nuclear ingredients are not considered in this study. Therefore, the distributions of these quantities shown in Figure 2 should not be regarded as the unique solution. Keeping these caveats in mind, we find distinct features between mFE-a and mFE-b; the former is represented by and the latter with wide ranges of .
This explains the reason why the abundance distribution of mFE-a extends down to (48Ca). In a condition such as , a single NSE cluster contains two maxima at and –84: the former be associated with the magic numbers and the latter or (Hartmann et al., 1985; Meyer et al., 1998; Wanajo et al., 2018). Therefore, the production of nuclei with –68 (out of the reference range) is inevitable when the reference abundances contain (the first peak of the residuals). It is noteworthy that the ratio of 48Ca/Eu (= 751) is comparable (60%) to that in the solar system (= 1240, Lodders, 2003). Given mFE-a be representative, this implies that NS mergers can be potential sources of 48Ca, whose astrophysical origin is currently unknown (Hartmann et al., 1985; Meyer et al., 1996; Woosley, 1997; Wanajo et al., 2013, 2018).
4 Heating rates
An ensemble of FEs with their weights gives the temporal evolution of the nuclear heating rates for each mFE,
| (5) |
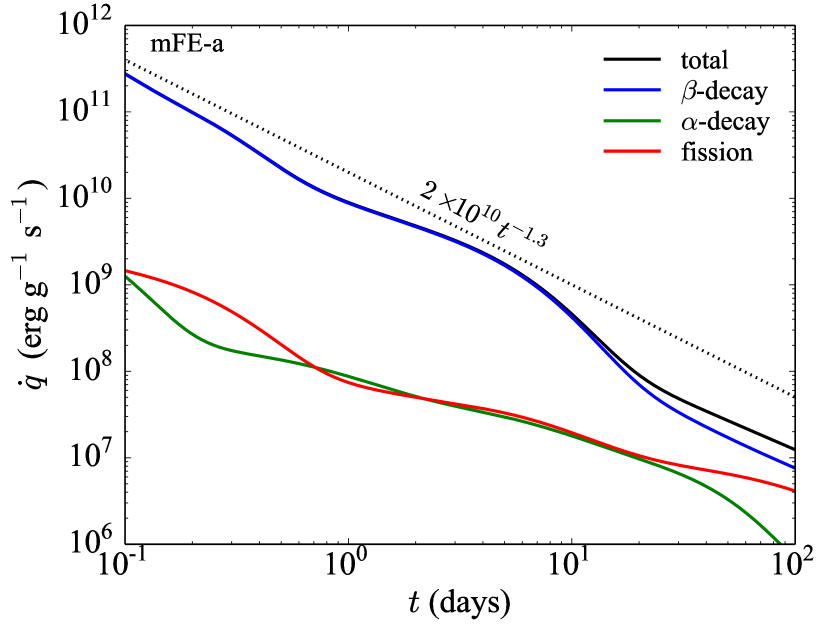
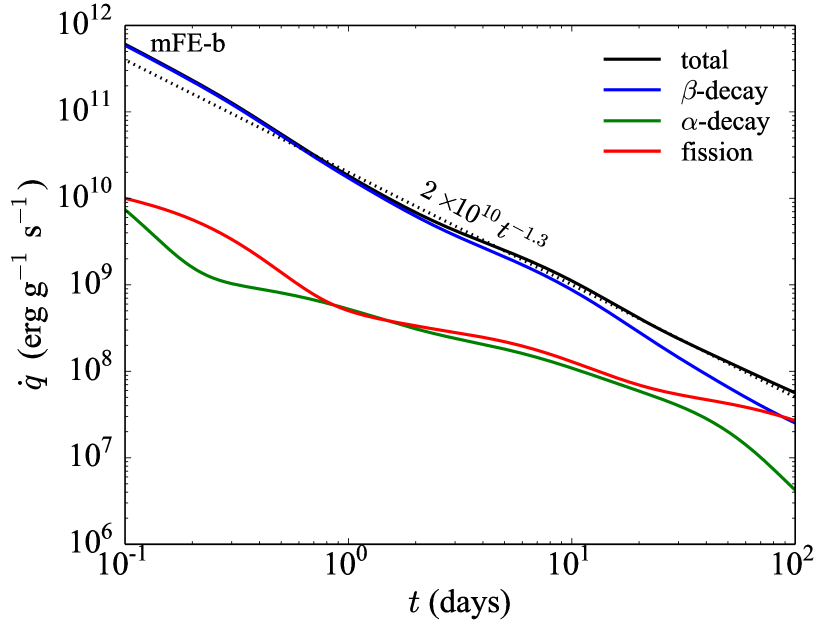
where is the heating rate of the th FE as a function of time. The resulting heating rates are shown in Figure 3 for mFE-a (left) and mFE-b (right) with those from all channels (black), -decay (blue), -decay (green), and fission (red) as functions of time333Numerical data for the upper panels of Figure 3 are available. See also
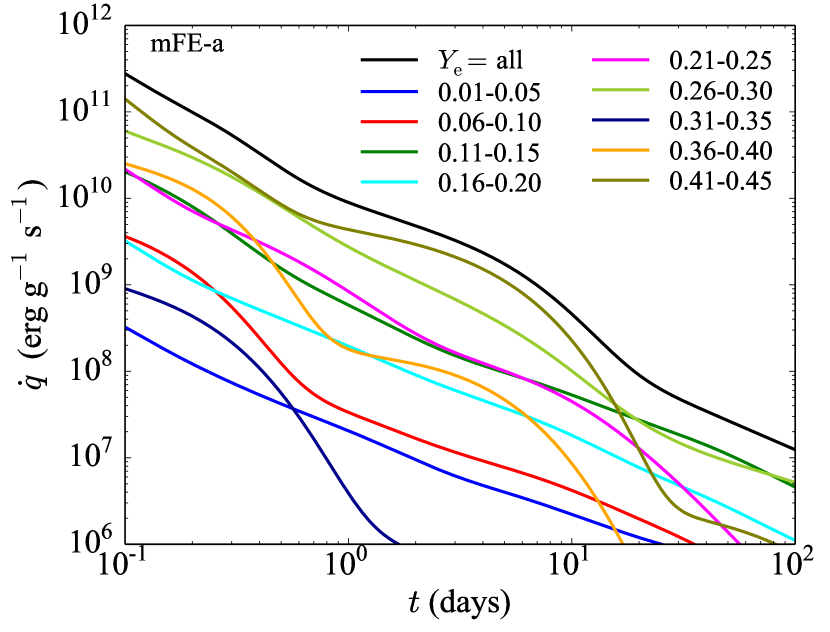
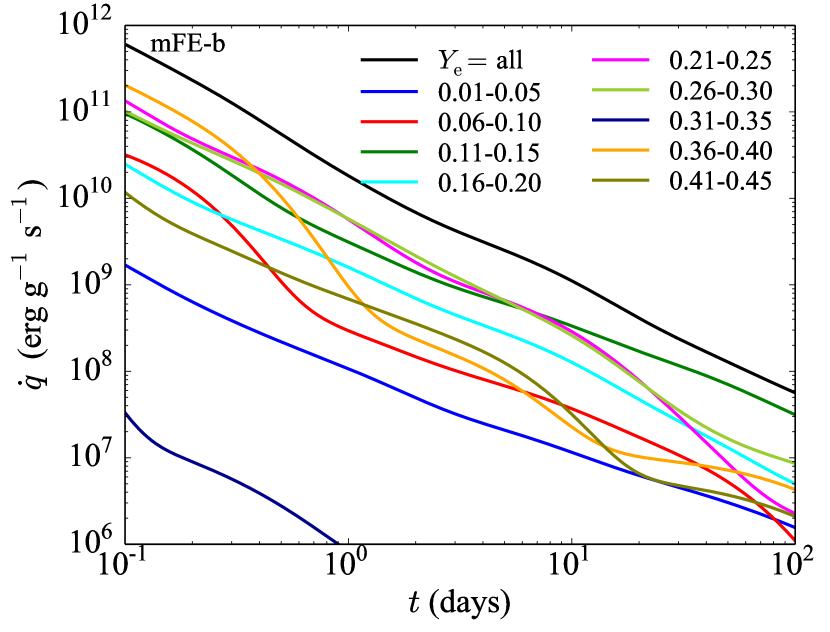
https://sites.google.com/view/shinyawanajo/. For both mFEs, the contribution from -decay dominate over the others; fission and -decay become important at late times (Hotokezaka et al., 2016; Barnes et al., 2016). While the total heating rate in mFE-b well scales as erg g-1 s-1 (e.g., Metzger et al., 2010; Wanajo et al., 2014), the same does not hold in mFE-a. The behaviors of -decay and fission contributions are similar between mFE-a and mFE-b but with appreciably greater values for the latter (because of the greater amount of -process elements). In mFE-a (Figure 3, bottom left) the FEs of –0.45 dominate over those of the other ranges, while in mFE-b (right) the groups of 0.06–0.35 have similar contributions. This is due to the dominance of FEs with in mFE-a (Figure 2).
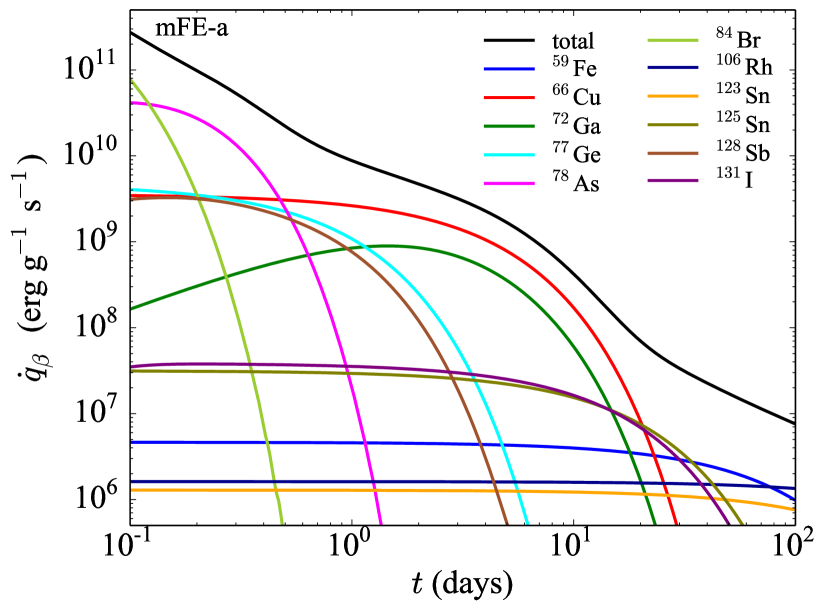
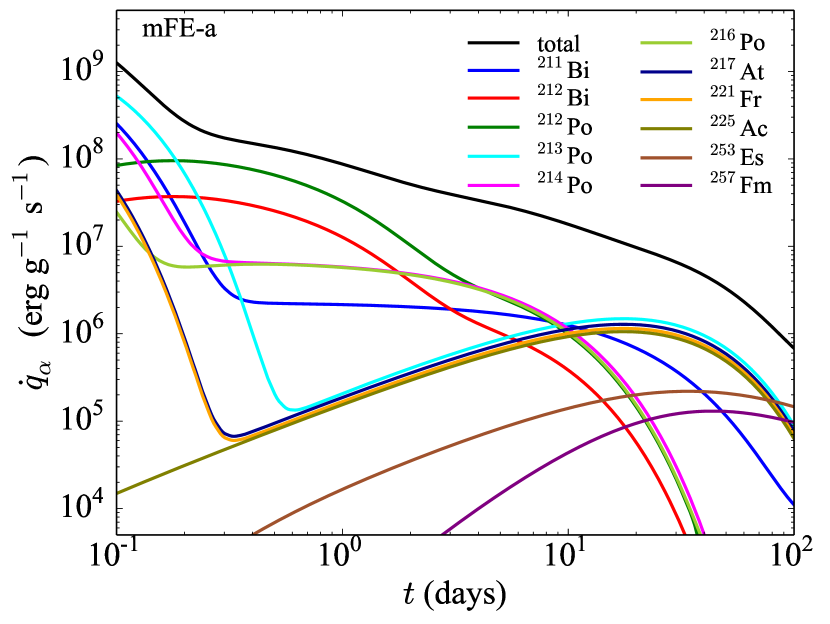
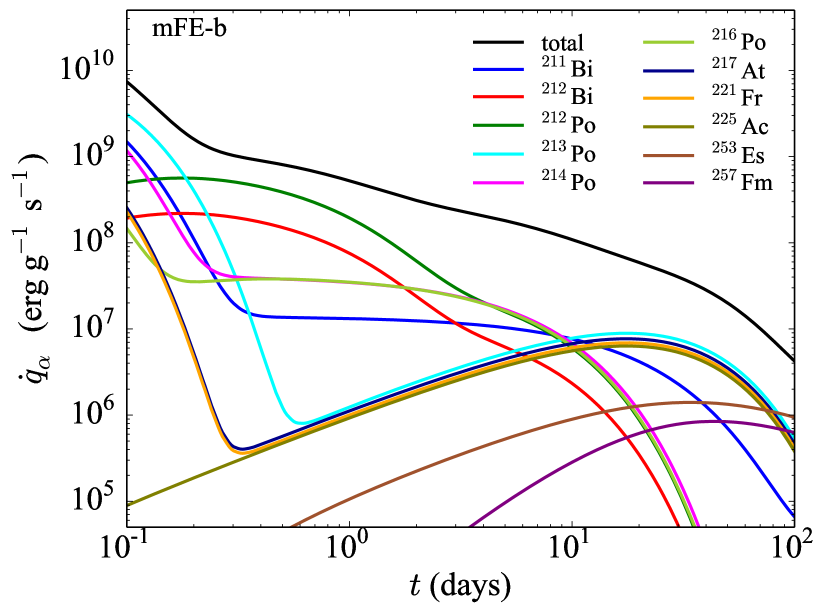
The reason of deviation from a power law in mFE-a is attributed to the two -decay chains that principally contribute to heating (halflife),
| (6) | |||||
| (7) |
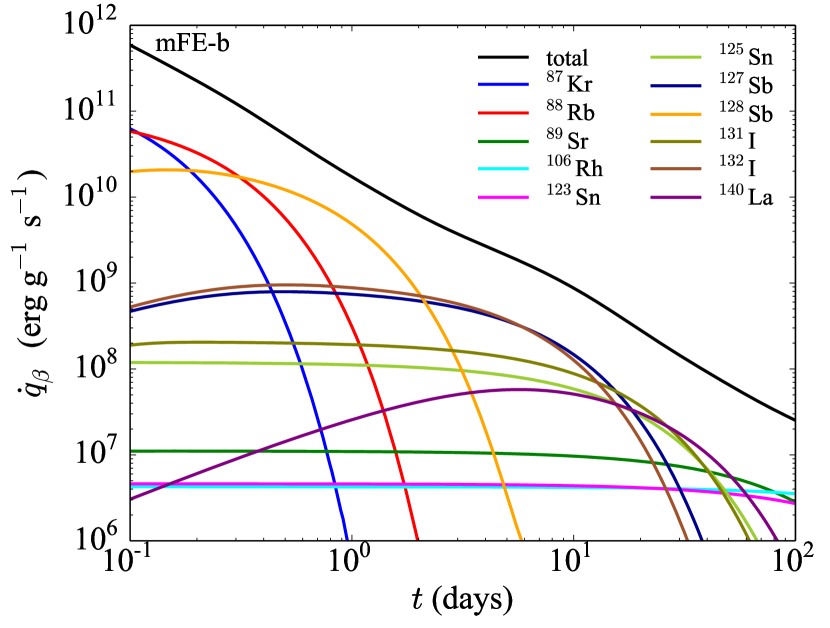
as can be seen in Figure 4 (top left). The parent isotopes 66Ni and 72Zn are made in NSE. The decay chain from 66Ni exhibits a factor of a few greater contribution than that from 72Zn. is out of the range from the residuals but co-produced with 72Zn in the same condition as described in § 3. The dominance of only two isobars and 72 with similar halflives of the parent nuclides 66Ni and 72Zn leads to an exponential-like (rather than power-law-like) behavior of the heating rate during –15 days. Note that, in mFE-a, the isotopes of play only subdominant roles on the -decay heating. In mFE-b (Figure 4, top right) those of have dominant contributions, exhibiting a power-law-like decay as found in previous studies (e.g., Metzger et al., 2010; Wanajo et al., 2014).
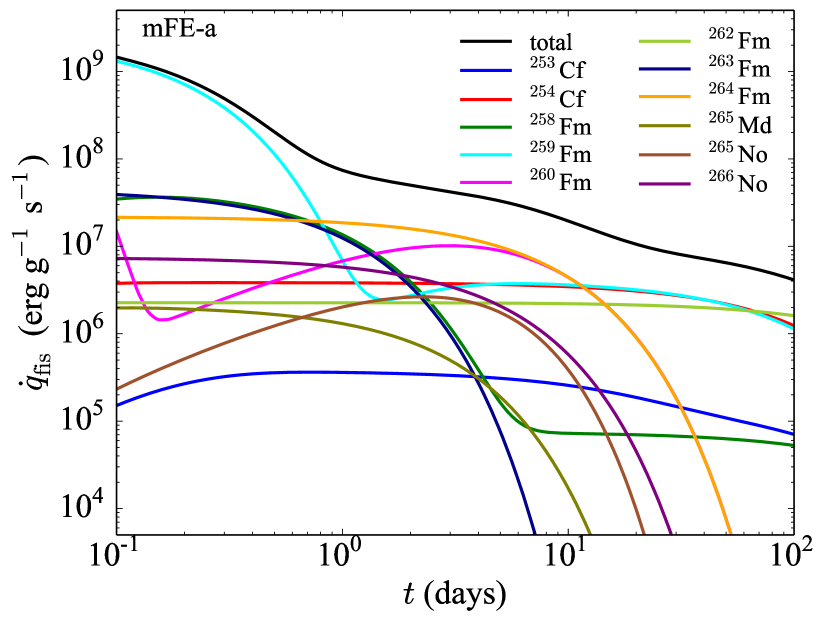
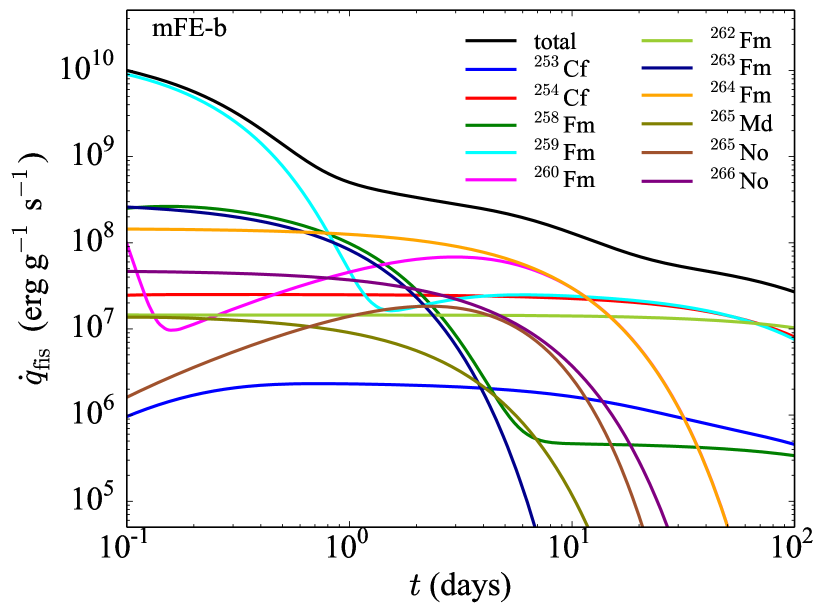
Dominant contributing isotopes for -decay and fission are also shown in Figure 4 (middle and bottom). As anticipated, little difference can be seen between mFE-a (left) and mFE-b (right) except for consistently greater values in the latter. For fission, 254Cf and a few Fm isotopes mainly contribute to the heating rate (Wanajo et al., 2014; Zhu et al., 2018). Note that the measured halflives of 258,259,260Fm for spontaneous fission are only 370 s, 1.5 s, and 4 ms, respectively, but sizably contribute to heating because of predicted longer -decay lifetimes of the parent isotopes adopted in this study. As the contributions of these isotopes are all subject to very uncertain -decay and spontaneous fission lifetimes of their parent nuclides, the outcomes should be taken at a qualitative level.
5 Implication to kilonova light curves
| Model | total | Eu | |||
|---|---|---|---|---|---|
| mFE-a | 0.06 | 0.088 | 0.0021 | ||
| mFE-b | 0.04 | 0.029 | 0.083 |
| Star | nowaaMeasured value. | 10 Gyr agobbCorrected value (10 Gyr ago). | 13.5 Gyr agoccCorrected value (13.5 Gyr ago). | |
|---|---|---|---|---|
| J09544277+5246414 | 0.76 | 1.2 | 1.5 | |
| DES J033523-540407 | 0.14 | 0.24 | 0.28 |
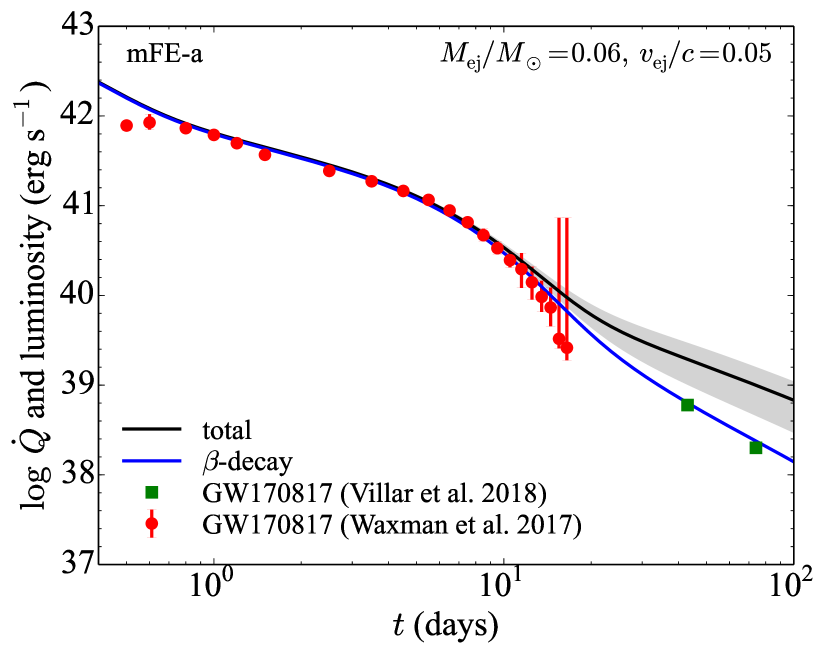
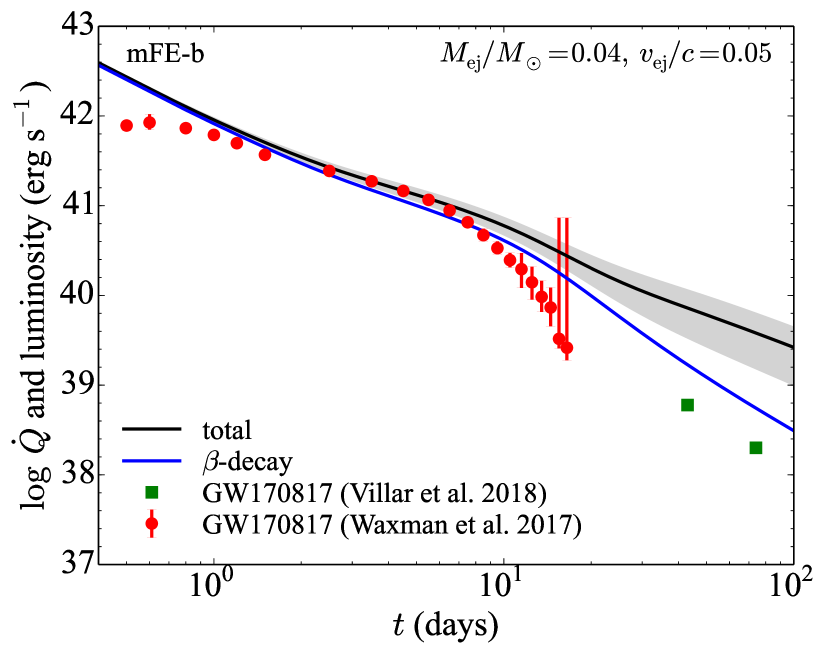
Provided that the light curve after a few days since merger is exclusively due to radioactive energies, we compare the heating rates obtained in § 4 with the bolometric luminosity of the kilonova (AT 2017gfo or SSS17a) associated with the NS merger GW170817. The heating rate in the ejecta (in erg s-1) is calculated as
| (8) |
where the thermalization efficiency for given ejecta mass and velocity is obtained from the analytic formula in Barnes et al. (2016, Eqs. 16, 21, and 25). Note that is taken as an independent free parameter from in FEs, because mFE models do not necessarily give unique solutions of the velocity distributions as described in § 3. The adopted energy partitions of -decay are 0.4 to neutrinos (that do not contribute to heating), 0.4 to electrons, and 0.2 to -rays according to Hotokezaka et al. (2016, Figure 1).
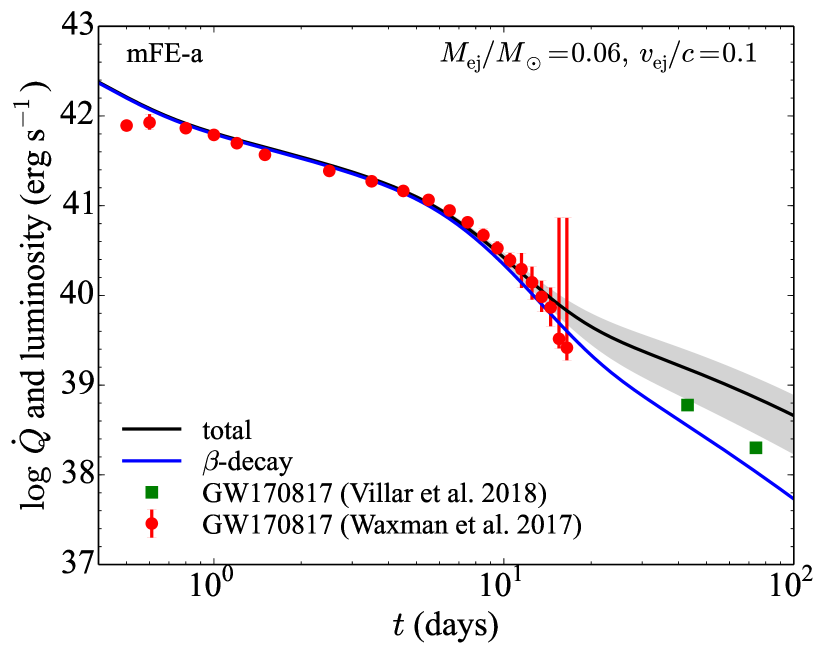
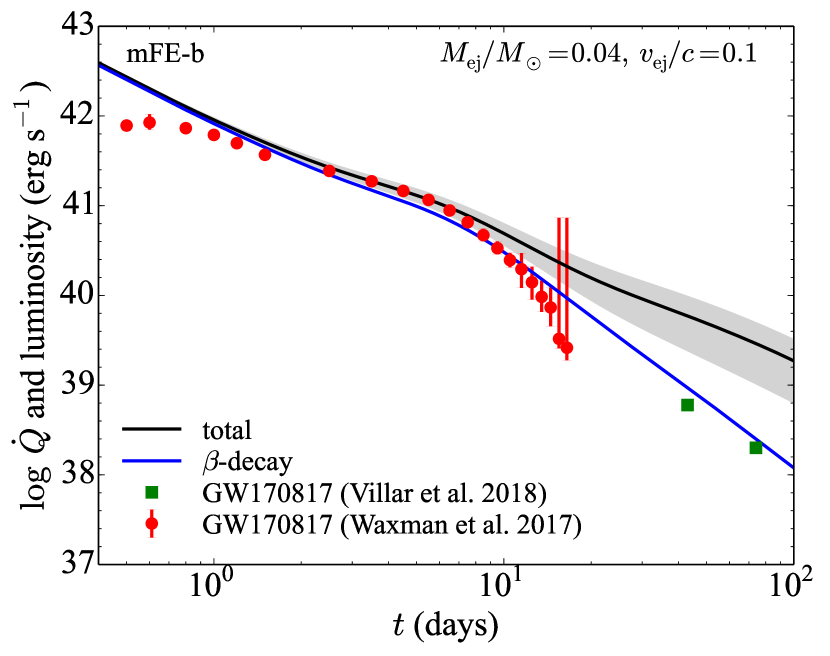
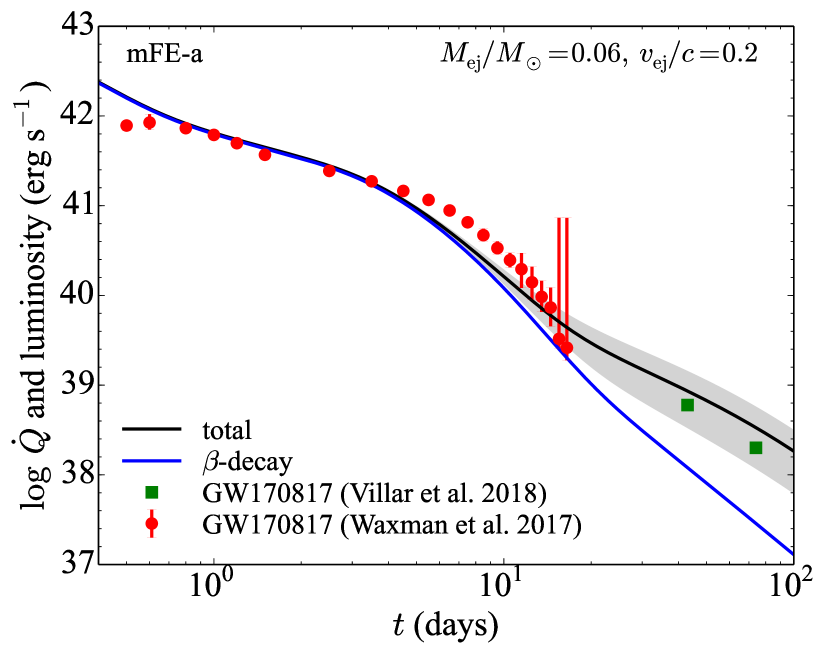
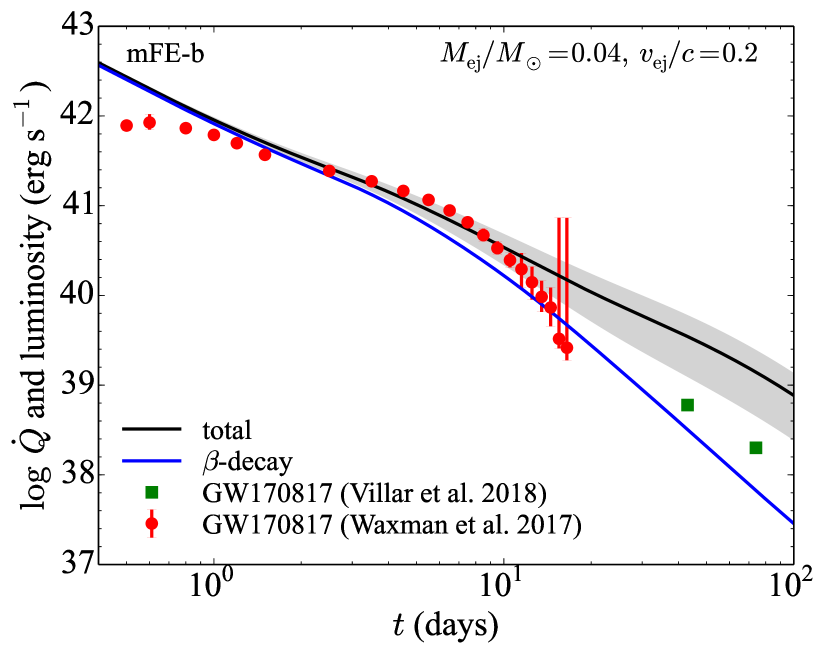
for each mFE is compared with the observed bolometric luminosity of the kilonova associated with GW170817 (Waxman et al., 2017; Villar et al., 2018). For mFE-a and mFE-b, the ejecta masses are taken to be and 0.04, respectively (Table 2, second column), such that approximately matches the light curve at a few days since merger. A greater for the former is needed to compensate the smaller heating rate per mass (Figure 3, top). Three different ejecta velocities (top), 0.10 (middle), and 0.20 (bottom) are considered, which affect the thermalization efficiency . The calculated total heating rate and its -decay component are displayed by black and blue lines, respectively. The latter can be regarded as the lower bound of the heating rate when considering uncertainties in the fission contribution described in § 3.
On top of the uncertainties originating from nuclear ingredients, an intrinsic variation of actinide productivity is known from the measurements of Th/Eu ratios in -process-enhanced stars, which can be taken as the range of Th/Eu production ratio. Among those, a recently found Galactic halo star, J09544277+5246414 (Holmbeck, 2018), exhibits the highest ratio of Th/Eu = 0.76 (Table 3, second column). Given the age of the oldest Galactic halo star be 13.5 Gyr, the upper limit of the production ratio becomes Th/Eu = 1.5 (Table 3, 4th column) with the halflife of 232Th (14.05 Gyr). The lowest measured Th/Eu (= 0.14) has been reported for one of -process-enhanced stars, DES J033523-540407 (Ji & Frebel, 2018), in a ultra-faint dwarf galaxy Reticulum II. Assuming the age of the youngest star in Reticulum II be 10 Gyr, the lower limit becomes 0.28. Our result indicates the Th/Eu production ratio (Table 1, 7th column) in between the inferred range above (Th/Eu = 0.28–1.5). Given the amount of trans-lead nuclei be proportional to Th/Eu, the range of the heating rate with rescaled contributions from fission and -decay is indicated by the grey area in Figure 5.
Obviously, the light curve of GW170817 is best explained by mFE-a, in particular with (middle left), for both a steepening at days (Waxman et al., 2017) and the late-time estimates (43 and 74 days, Villar et al., 2018). The former is indicative of the two -decay chains from 66Ni and 72Zn in Eqs. (6)-(7) with similar halflives ( days). Note that a slower ejecta velocity (, top left) keeps a high thermalization efficiency (Barnes et al., 2016) and thus becomes slightly less steeper, which is however still consistent within the error bars. For , becomes too steep to be consistent with the light curve. At late times for , the data points are marginally consistent with the lower limit of the heating rate (in grey) and slightly greater than that from -decay (i.e., the lower bound). Note that the ejecta might be in a nebular phase at these late times, in which the thermalization factor could be overestimated.
It appears a reasonable interpretation, therefore, that the products from the NS merger GW170817 consist of mainly light trans-iron elements () with a small fraction of -process elements (). This also explains an inferred small content of lanthanides and heavier in the ejecta (). Assuming that mFE-a with represents the merger GW170817, the ejecta mass of the -process elements is (Table 2, 3rd column), which is fully consistent with that from the dynamical ejecta of a NS merger (e.g., Shibata et al., 2017). The rest of that consists of light trans-iron elements can also be explained by the post-merger disk outflows in Fujibayashi et al. (2018). In their model of , the ejecta mass and mean velocity are, respectively, and (in their Figure 8), which coincide with those of our best case in mFE-a (Figure 5, middle left). In their relevant model the distributions of and exhibit relatively narrow peaks at and –0.4, respectively (their Figure 14), which are (marginally for the latter) in agreement with those in mFE-a (Figure 2). An updated analysis of Metzger & Fernández (2014) in Lippuner et al. (2017) also shows similar trends. The mass of Eu estimated for GW170817 is (Table 2, 5th column) that also is in agreement with the values adopted in recent works of Galactic chemical evolution (Figure 1 in Côté et al., 2017).
For mFE-b (Figure 5, right), none of cases accounts for the steepening at days. Effects of velocity in are too small to steepen the light curve. The late-time heating rates also are largely over-predicted except for the fast velocity case (). We cannot exclude a possibility that the ejecta quickly became transparent at days and a reduction of thermalization resulted in the steepening and smaller luminosities at late times. Otherwise, the bolometric luminosities at late times might be largely overestimated. However, a tension between observations and theoretical results stands; the -process products as massive as cannot be explained neither by dynamical ejecta or disk outflows. In addition, the inferred mass fraction of lanthanides and heavier () disagree with that in mFE-b (; Table 1, 4th column).
6 Summary and conclusions
Multi-component free-expansion model (mFE) was constructed to investigate various aspects of physical conditions relevant for the -process. This paper was supposed to be the first of a series of papers with an emphasis on radioactive heating rates that power a kilonova, an electromagnetic counterpart of the gravitational signals from a NS merger. Each free expansion model (FE) consists of a three-parameter suite: expansion velocity –0.30), entropy –35 in units of ), and electron fraction –0.50). A mFE was defined as an ensemble of FEs that fitted a given reference abundance distribution. The -process residuals (by subtracting the -process component) to the solar system abundances (Goriely, 1999) was employed as the reference, in light of the robust (solar--process like) abundance patterns in -process-enhanced stars (at least in the range , e.g., Sneden et al., 2008).
Two models were considered: a) mFE-a with a reference of the full range of the residuals () with both light trans-iron and -process elements and b) mFE-b with -process elements only (). For mFE-b, the fitting of FEs to the reference resulted in wide ranges of and as found in numerical simulations of dynamical ejecta (Wanajo et al. 2014; Sekiguchi et al. 2015, 2016; see also a similar trend in the magneto-hydrodynamic simulations of accretion disks by Siegel & Metzger 2017; Fernández et al. 2018). In contrast, mFE-a composed of narrow ranges of and that were in good agreement with a recent simulation of disk outflows (Fujibayashi et al. 2018; see also Lippuner et al. 2017). As such physical conditions led to NSE, the nucleosynhthetic yields extended down to 48Ca, a nuclide whose astrophysical origin was unknown (Hartmann et al., 1985; Meyer et al., 1996; Woosley, 1997; Wanajo, 2013).
While the obtained heating rate for mFE-b exhibited a power-law-type temporal evolution owing to -decay (of ) as found in previous works ( erg g-1 s-1, e.g., Metzger et al., 2010; Wanajo et al., 2014), that for mFE-a indicated rather an exponential-type evolution during –15 days. Two -decay chains relevant for the heating were identified: 66NiCuZn and 72ZnGaGe with both having similar halflives ( days) of the parent isotopes made in NSE. Contributions from fission and -decay became non-negligible at late times ( days) as pointed out by Hotokezaka et al. (2016); Barnes et al. (2016); Zhu et al. (2018).
Obtained heating rates with given ejecta mass and ejecta velocity (both affect the thermalization efficiency, Barnes et al., 2016) were compared with the bolometric light curve of the kilonova (AT 2017gfo or SSS17a) associated with GW170817. It was found that the light trans-iron dominant model mFE-a with and reproduced the bolometric light curve remarkably well. A steepening of the light curve at days (Waxman et al., 2017) was indicative of the dominance of light trans-iron nuclei including 66Ni and 72Zn, rather than -process products. Late-time estimates at several 10 days (Villar et al., 2018) could also be explained with the -decay heating and probably those from fission and -decay. The pure -process model (mFE-b with ) did not account for the light curve at late times because of its robust power-law like decay of the heating rate. Note that our models account for the gross nature of the kilonova light curve but its early blue component that may originate from a high-latitude dynamical ejecta (e.g., Shibata et al., 2017) or the wind ejecta from a strongly magnetized hypermassive NS (Metzger, 2018).
In conclusion, the ejecta from the NS merger GW170817 was dominated () by light trans-iron elements () with a fraction () of -process elements (). Along with the adopted velocity (), our conclusion is consistent with an interpretation that the -process elements come from the dynamical ejecta of a NS merger and light trans-iron elements from the subsequent disk outflows (e.g., Shibata et al., 2017). Magneto-hydrodynamic mass ejection from an accretion disk may also be a viable mechanism for this event (Siegel & Metzger, 2017; Fernández et al., 2018). Although the inferred and are similar to the literature values, it is emphasized that the principal radioactive energy sources are light trans-iron elements, not -process elements as suggested in previous works.
A word of caution is needed; this study itself cannot answer satisfactorily to a question: “how much -process elements were made?”. This is due to the fact that the choice of a reference abundance distribution was arbitrary and our conclusion strongly relied upon the abundances of only two radioactive isotopes 66Ni and 72Zn. The inferred mass of -process elements (; Table 2) merely reflects our choice of the reference abundance distribution, i.e., the -process residuals to the solar system abundances. Comparison of our model (mFE-a) with the observed bolometric luminosity only ensures the production of light trans-iron isotopes 66Ni and 72Zn with the amounts presented in Table 1 (5th and 6th columns)444The light curve cannot disentangle the contributions of two decay chains from 66Ni and 72Zn because of their similar lifetimes. Measurements of -ray lines (97.8 keV and 145 keV/2.77 MeV, respectively) from a future nearby event may enable us to directly determine their abundances (see, e.g., Hotokezaka et al., 2016). but the abundance distribution in Figure 1 (top-left)555For instance, an addition of ejecta with -0.35 (that were almost absent in our cases; Figure 2, bottom) would overproduce the nuclei of (Figure 1, top) that had, however, little effect on radioactive heating (Figure 3, bottom). Similarly, additional ejecta with might have little effect on heating (except for the decay chain from 56Ni at late times).. Different from a previous thought, -decay contribution from is unimportant in this case (Figure 4, top left). Our result (mFE-a) is consistent with additional contributions from fission and -decay (Figure 5, middle left) but only at a qualitative level when considering uncertainties in nuclear ingredients.
Currently, therefore, only the inferred gives a hint to the amount of -process elements. Our result in mFE-a, , is a few times greater than the upper bound of the literature values (–, e.g., Arcavi et al., 2017; Chornock et al., 2017; Nicholl et al., 2017; Waxman et al., 2017). If we took it literally, the -process mass of in mFE-a would be regarded as the upper limit. The true value may be a few times smaller, which is still consistent with the theoretical range of dynamical ejecta masses in a recent work (–0.016, Shibata et al., 2017). However, no information can be obtained from the inferred alone on the prodution of heavy -process elements such as gold and uranium. Only a viable strategy appears to search a signature of spontaneous fission (from 254Cf and possibly a few Fm isotopes), which can affect late-time luminosities (Wanajo et al., 2014; Hotokezaka et al., 2016; Zhu et al., 2018). As described in § 4, many uncertainties are involved in estimating the fission contribution. Nevertheless, a variation of late-time light curves among future NS merger events will be indicative of actinide production (Figure 5, grey area), which is expected from spectroscopic studies of Galactic halo stars.
In this paper comparison was made only with the NS merger GW170817, the first and currently unique detection of such an event. It should be noted that the same heating rates of our model (mFE-a) may not necessarily be applicable to future NS merger events. The reason is that the abundance distribution of light trans-elements may not be robust, which is very sensitive to and (Meyer et al., 1998; Wanajo et al., 2018). Small shifts of these quantities in post-merger disk outflows would substantially modify the abundance pattern. As can be seen in Figure 3 (bottom), the behaviors of heating rates are very different among different groups for . The amounts of ejecta mass from disk outflows can also be dependent of, e.g., the masses and their ratio of merging NSs (e.g., Shibata et al., 2017). Even so, it is encouraging that we have means of discriminating between light trans-iron and -process dominant mergers through the light curves of kilonovae in the future.
References
- Abbott et al. (2017) Abbott, B. P., Abbott, R., Abbott, T. D., et al. 2017, Phys. Rev. Lett., 119, 161101
- Arcavi et al. (2017) Arcavi, I., Hosseinzadeh, G., Howell, D. A., et al. 2017, Nature, 551, 64
- Arnett (1979) Arnett, W. D. 1979, ApJ, 230, L37
- Barnes & Kasen (2013) Barnes, J., & Kasen, D. 2013, ApJ, 775, 18
- Barnes et al. (2016) Barnes, J., Kasen, D., Wu, M.-R., & Martínez-Pinedo, G. 2016, ApJ, 829, 110
- Bauswein et al. (2013) Bauswein, A., Goriely, S., & Janka, H.-T. 2013, ApJ, 773, 78
- Beniamini et al. (2016) Beniamini, P., Hotokezaka, K., & Piran, T. 2016, ApJ, 829, L13
- Bouquelle et al. (1996) Bouquelle, V., Cerf, N., Arnould, M., Tachibana, T., & Goriely S. 1996, A&A, 305, 1005
- Burbidge et al. (1956) Burbidge, G. R., Hoyle, F., Burbidge, E. M., Christy, R. F., & Fowler, W. A. 1956, Phys. Rev., 103, 1145
- Burbidge et al. (1957) Burbidge, E. M., Burbidge, G. R., Fowler, W. A., & Hoyle, F. 1957, Rev. Mod. Phys., 29, 547
- Cameron (1957) Cameron, A. G. W. 1957, Chalk River Report, CRL-41
- Cardall & Fuller (1997) Cardall, C. Y., & Fuller, G. M. 1997, ApJ, 486, L111
- Chornock et al. (2017) Chornock, R., Berger, E., Kasen, D., et al. 2017, ApJ, 848, L19
- Colgate (1969) Colgate, S. & McKee, C. 1969, ApJ, 157, 623
- Côté et al. (2017) Côté, B., Belczynski, K., Fryer, C., et al. 2017, ApJ, 836, 230
- Cowperthwaite et al. (2017) Cowperthwaite, P. S., Berger, E., Villar, V. A., et al. 2017, ApJ, 848, L17
- Cyburt et al. (2010) Cyburt, R. H., et al. 2010, ApJS, 189, 240
- Dessart et al. (2009) Dessart, L., Ott, C., Burrows, A., Rosswog, S., & Livne, E. 2009, ApJ, 690, 1681
- Eichler et al. (1989) Eichler, D., Livio, M., Piran, T., & Schramm, D. N. 1989, Natur, 340, 126
- Farouqi et al. (2010) Farouqi, K., Kratz, K.-L., Pfeiffer, B., et al. 2010, ApJ, 712, 1359
- Fernández et al. (2018) Fernández, R., Tchekhovskoy, A., Quataert, E., Foucart, F., & Kasen, D. 2018, MNRAS, submitted
- Freiburghaus et al. (1999) Freiburghaus, C., Rosswog, S., & Thielemann, F.-K. 1999, ApJ, 525, L121
- Fujibayashi et al. (2018) Fujibayashi, S., Kiuchi, K., Nishimura, N., Sekiguchi, Y., & Shibata, M. 2018, ApJ, 860, 64
- Goriely & Arnould (1996) Goriely, S. & Arnould, M. 1996, A&A, 312, 327
- Goriely (1999) Goriely, S. 1999, A&A, 342, 881
- Goriely et al. (2007) Goriely, S., Samyn, M., & Pearson, J. M. 2007, Phys. Rev. C, 75, 064312
- Goriely et al. (2008) Goriely, S., Hilaire, S., & Koning, A. J. 2008, A&A, 487, 767
- Goriely et al. (2010) Goriely, S., Chamel, N., & Pearson, J. M. 2010, Phys. Rev. C, 82, 035804
- Goriely et al. (2011) Goriely, S., Bauswein, A., & Janka, H.-T. 2011, ApJ, 738, L32
- Goriely et al. (2015) Goriely, S., Bauswein, A., Just, O., Pllumbi, E., & Janka, H.-T. 2015, MNRAS, 452, 3894
- Goriely (2015) Goriely, S. 2015, Eur. Phys. J. A, 51, 22
- Halevi & Mösta (2018) Halevi, G. & Mösta, P. 2018, MNRAS, 477, 2366
- Hartmann et al. (1985) Hartmann, D., Woosley, S. E., & El Eid, M. F. 1985, ApJ, 297, 837
- Heßberger (2017) Heßberger, F. P. 2017, Eur. Phys. J. A, 53, 75
- Hillebrandt et al. (1976) Hillebrandt, W., Takahashi, K., & Kodama, T. 1976, A&A, 52, 63
- Holmbeck (2018) Holmbeck, E. M., Beers, T. C., Roederer, I. U., et al. 2018, ApJ, 859, L24
- Hotokezaka et al. (2013) Hotokezaka, K., Kiuchi, K., Kyutoku, K., et al. 2013, Phys. Rev. D, 87, 024001
- Hotokezaka et al. (2016) Hotokezaka, K., Wanajo, S., Tanaka, M., et al. 2016, MNRAS, 459, 35
- Hotokezaka et al. (2017) Hotokezaka, K., Sari, R., & Piran, T. 2017, MNRAS, 468, 91
- Ishimaru et al. (2015) Ishimaru, Y., Wanajo, S., & Prantzos, N. 2015, ApJ, 804, L35
- Janka et al. (2012) Janka, H.-T., Hanke, F., Hüdepohl, L., et al. 2012, PTEP, 2012, 01A309
- Ji et al. (2016) Ji, A., Frebel, A., Chiti, A., & Simon, J. D. 2016a, Nature, 531, 610
- Ji & Frebel (2018) Ji, A. P. & Frebel, A.2018, ApJ, 856, 138
- Just et al. (2015) Just, O., Bauswein, A., Pulpillo, R. A., Goriely, S., & Janka, H.-T., 2015, MNRAS, 448, 541
- Kasen et al. (2013) Kasen, D., Badnell, N. R., & Barnes, J. 2013, ApJ, 774, 25
- Kasen et al. (2015) Kasen, D., Fernández, R., & Metzger, B. D. 2015, MNRAS, 450, 1777
- Kasen et al. (2017) Kasen, D., Metzger, B., Barnes, J., Quataert, E., & Ramirez-Ruiz, E. 2017, Nature, 551, 80
- Kasliwal et al. (2017) Kasliwal, M. M., Nakar, E., Singer, L. P., et al. 2017, Sci., 358, 1559
- Kitaura et al. (2006) Kitaura, F. S., Janka, H.-Th., & Hillebrandt, W. 2006, A&A, 450, 345
- Korobkin et al. (2012) Korobkin, O., Rosswog, S., Arcones, A., & Winteler, C. 2012, MNRAS, 426, 1940
- Lattimer & Schramm (1974) Lattimer, J. M., & Schramm, D. N. 1974, ApJ, 192, L145
- Li & Paczyński (1998) Li, L.-X., & Paczyński, B. 1998, ApJ, 507, L59
- Lippuner & Roberts (2015) Lippuner, J., & Roberts, L. F. 2015, ApJ, 815, 82
- Lippuner et al. (2017) Lippuner, J., Fernández, R., Roberts, L. F., et al. 2017, MNRAS, 472, 904
- Lodders (2003) Lodders, K. 2003, ApJ, 591, 1220
- Metzger et al. (2008) Metzger, B. D., Piro, A. L., & Quataert, E. 2008, MNRAS, 390, 781
- Metzger et al. (2010) Metzger, B. D., Martínez-Pinedo, G., Darbha, S., et al. 2010, MNRAS, 406, 2650
- Metzger & Fernández (2014) Metzger, B. D., & Fernández, R. 2014, MNRAS, 441, 3444
- Metzger (2017) Metzger, B. D. 2017, arXiv:1710.05931
- Metzger (2018) Metzger, B. D., Thompson, T. A., & Quataert, E. 2018, ApJ, 856, 101
- Meyer (1989) Meyer, B. S. 1989, ApJ, 343, 254
- Meyer et al. (1992) Meyer, B. S., Mathews, G. J., Howard, W. M., Woosley, S. E., & Hoffman, R. D. 1992, ApJ, 399, 656
- Meyer et al. (1996) Meyer, B. S., Krishnan, T. D., & Clayton, D. D. 1996, ApJ, 462, 825
- Meyer et al. (1998) Meyer, B. S., Krishnan, T. D., & Clayton, D. D. 1998, ApJ, 498, 808
- Mösta et al. (2017) Mösta, P., Roberts, L. F., Halevi, G., et al. 2017, ApJ, submitted; arXiv:1712.09370
- Nicholl et al. (2017) Nicholl, M., Berger, E., Kasen, D., et al. 2017, ApJ, 848, L18
- Nishimura et al. (2015) Nishimura, N., Takiwaki, T., & Thielemann, F.-K. 2015, ApJ, 810, 109
- Nishimura et al. (2017) Nishimura N., Sawai H., Takiwaki T., Yamada S., & Thielemann F.-K., 2017, ApJ, 836, L21
- Ojima et al. (2018) Ojima, T., Ishimaru, Y., Wanajo, S., Prantzos, N., & François, P. 2018, ApJ, submitted
- Otsuki et al. (2000) Otsuki, K., Tagoshi, H., Kajino, T., & Wanajo, S. 2000, ApJ, 533, 424
- Papenfort et al. (2018) Papenfort, L. J., Gold, R., & Rezzolla, L. 2018; arXiv1807.03795
- Perego et al. (2015) Perego, A., Hempel, M., Frölich, C., et al. 2015, ApJ, 806, 275
- Pian et al. (2017) Pian, E., D’Avanzo, P., Benetti, S., et al. 2017, Nature, 551, 67
- Qian & Woosley (1996) Qian, Y.-Z. & Woosley, S. E. 1996, ApJ, 471, 331
- Rampp & Janka (2002) Rampp, M. & Janka, H.-Th., 2002, A&A, 396, 361
- Radice et al. (2016) Radice, D., Galeazzi, F., Lippuner, J., et al. 2016, MNRAS, 460, 3255
- Ruffert & Janka (1999) Ruffert, M. & Janka, H.-T. 1999, A&A, 344, 573
- Safarzadeh & Scannapieco (2017) Safarzadeh, M., & Scannapieco, E. 2017, MNRAS, 471, 2088
- Sato (1974) Sato, K. 1974, Prog. Theor. Phys., 51, 726
- Schramm (1973) Schramm, D. N. 1973, ApJ, 185, 293 434, 102
- Sekiguchi et al. (2015) Sekiguchi, Y., Kiuchi, K., Kyutoku, K., & Shibata, M. 2015, Phys. Rev. D, 91, 064059
- Sekiguchi et al. (2016) Sekiguchi, Y., Kiuchi, K., Kyutoku, K., Shibata, M., & Taniguchi, K. 2016, Phys. Rev. D, 93, 124046
- Siegel & Metzger (2017) Siegel, D. & Metzger, B. D. 2017, Phys. Rev. Lett., 119, 1102
- Shibata et al. (2017) Shibata, M., Fujibayashi, S., Hotokezaka, K., et al. 2017, Phys. Rev. D, 96, 123012
- Siqueira Mello et al. (2013) Siqueira Mello, C., Jr., Spite, M., Barbuy, B., et al. 2013, A&A, 550, A122
- Smartt et al. (2017) Smartt, S. J., Chen, T.-W., Jerkstrand, A., et al. 2017, Nature, 551, 75
- Sneden et al. (2003) Sneden, C., Cowan, J. J., Lawler, J. E., et al. 2003, ApJ, 591, 936
- Sneden et al. (2008) Sneden, C., Cowan, J. J., & Gallino, R. 2008, ARA&A, 46, 241
- Symbalisty & Schramm (1982) Symbalisty, E., & Schramm, D. N. 1982, ApL, 22, 143
- Sumiyoshi et al. (2001) Sumiyoshi, K., Terasawa, M., Mathews, G. J., et al. 2001, ApJ, 562, 880
- Surman et al. (2008) Surman, R., McLaughlin, G. C., Ruffert, M., Janka, H.-Th., & Hix, W. R. 2008, ApJ, 679, L117
- Tachibana et al. (1990) Tachibana, T., Yamada, M.,& Yoshida, Y. 1990, PThPh, 84, 641
- Tanaka & Hotokezaka (2013) Tanaka, M., & Hotokezaka, K. 2013, ApJ, 775, 113
- Tanaka et al. (2017) Tanaka, M., et al. 2017, Publ. Astron. Soc. Jap., arXiv:1710.05850
- Tanaka et al. (2018) Tanaka, M., Kato, D., Gaigalas, G., et al. 2018, ApJ, 852, 109
- Tanvir et al. (2017) Tanvir, N. R., Levan, A. J., González-Fernández, C., et al. 2017, ApJ, 848, L27
- Timmes & Swesty (2000) Timmes, F. X., & Swesty, F. D. 2000, ApJS, 126, 501
- Thielemann et al. (2017) Thielemann, F.-K., Eichler, M., Panov, I. V., & Wehmeyer, B. 2017, ARNPS, 67, 253
- Thompson (2001) Thompson, T. A., Burrows, A., & Meyer, B. S. 2001, ApJ, 562, 887
- Villar et al. (2018) Villar, V. A., Cowperthwaite, P. S., Berger, E., et al. 2018, ApJ, 862, L11
- Viola et al. (1985) Viola, V. E., Kwiatkowski, K. & Walker, M. 1985, Phys. Rev. C, 31, 1550
- Wanajo et al. (2001) Wanajo, S., Kajino, T., Mathews, G. J., & Otsuki, K. 2001, ApJ, 554, 578
- Wanajo et al. (2003) Wanajo, S., Tamamura, M., Itoh, N., et al. 2003, ApJ, 593, 968
- Wanajo et al. (2011) Wanajo, S., Janka, H.-T., & Müller, B. 2011, ApJ, 726, L15
- Wanajo & Janka (2012) Wanajo, S., & Janka, H.-T. 2012, ApJ, 746, 180
- Wanajo et al. (2013) Wanajo, S., Janka, H.-T., & Müller, B. 2013, ApJL, 767, L26
- Wanajo (2013) Wanajo, S. 2013, ApJL, 770, L22
- Wanajo et al. (2014) Wanajo, S., Sekiguchi, Y., Nishimura, N., et al. 2014, ApJ, 789, L39
- Wanajo et al. (2018) Wanajo, S., Müller, B., Janka, H.-T., & Heger, A. 2018, ApJ, 852, 40
- Waxman et al. (2017) Waxman, E., Ofek, E., Kushnir, D., & Gal-Yam, A. 2017, arXiv:1711.09638
- Winteler et al. (2012) Winteler, C., et al. 2012, ApJ, 750, L22
- Witti et al. (1994) Witti, J., Janka, H.-Th., & Takahashi, K. 1994, A&A, 286, 841
- Woosley & Hoffman (1992) Woosley, S. E. & Hoffman, R. D. 1992, ApJ, 395, 202
- Woosley et al. (1994) Woosley, S. E., Wilson, J. R., Mathews, G. J., Hoffman, R. D., & Meyer, B. S. 1994, ApJ, 433, 229
- Woosley (1997) Woosley, S. E. 1997, ApJ, 476, 801
- Wu et al. (2016) Wu, M.-R., Fernández, R., Martínez-Pinedo, G., & Metzger, B. D. 2016, MNRAS, 463, 2323
- Zhu et al. (2018) Zhu, Y., Wollaeger, R. T., Vassh, N., et al. 2018, arXiv:1806.09724