2018/04/19\Accepted2018/08/09
Radio continuum: general — Methods: observational — Surveys — supernovae: general — Pulsars: general — Stars: general
Optical follow-up observation of Fast Radio Burst 151230
Abstract
The origin of fast radio bursts (FRBs), bright millisecond radio transients, is still somewhat of a mystery. Several theoretical models expect that the FRB accompanies an optical afterglow (e.g., [Totani (2013), Kashiyama et al. (2013)]). In order to investigate the origin of FRBs, we perform -band follow-up observations of FRB 151230 (estimated ) with Subaru/Hyper Suprime-Cam at , , and days after discovery. The follow-up observation reaches a completeness magnitude of mag for point sources, which is the deepest optical follow-up of FRBs to date. We find counterpart candidates with variabilities during the observation. We investigate their properties with multicolor and multi-wavelength observations and archival catalogs. Two candidates are excluded by the non-detection of FRB 151230 in the other radio feed horns that operated simultaneously to the detection, as well as the inconsistency between the photometric redshift and that derived from the dispersion measure of FRB 151230. Eight further candidates are consistent with optical variability seen in AGNs. Two more candidates are well fitted with transient templates (Type IIn supernovae), and the final candidate is poorly fitted with all of our transient templates and is located off-center of an extended source. It can only be reproduced with rapid transients with a faint peak and rapid decline and the probability of chance coincidence is . We also find that none of our candidates are consistent with Type Ia supernovae, which rules out the association of Type Ia supernovae to FRB 151230 at and limits the dispersion measure of the host galaxy to pc cm-3 in a Type Ia supernova scenario.
1 Introduction
Fast radio bursts (FRBs) are bright millisecond radio transients that were first discovered in a search of archival data of the Parkes Radio Telescope (Lorimer et al., 2007). Subsequent searches discovered further FRBs with the Parkes Radio Telescope (e.g., Champion et al. (2016)), the Green Bank Telescope (Masui et al., 2015), the Arecibo Telescope (Spitler et al., 2014), the Molonglo Observatory Synthesis Telescope (Caleb et al., 2017), and the Australian SKA Pathfinder (Bannister et al., 2017); information on all FRBs is listed in the FRB Catalogue (Petroff et al., 2016).111 http://frbcat.org/ The defining characteristic of FRBs is a dispersion measure (DM) in excess of what can be explained by the Milky Way. If this excess is attributed to free electrons in the intergalactic medium (IGM), FRBs could thus conceivably be used to probe the so-called “missing” baryon and magnetic fields and turbulence in the IGM (e.g., Ravi et al. (2016)). The observed rate of FRBs is at least as high as sky-1 day-1 (Bhandari et al., 2018).
However, the origin of FRBs is still unknown. There are many theoretical proposals; for example, mergers of double neutron star binaries (Totani, 2013), mergers of double white dwarf binaries (Kashiyama et al., 2013)222They assume that the emitting region is a portion of the merged white dwarf to reproduce the short duration of FRBs., the collapse of rotating supermassive neutron stars to black holes (Falcke & Rezzolla, 2014; Zhang, 2014), exotic Galactic compact objects (Keane et al., 2012; Bannister & Madsen, 2014), interactions between the supernova shock and magnetosphere of a neutron star (Egorov & Postnov, 2009), compact objects in young supernovae (Connor et al., 2016; Piro, 2016), supergiant pulses from extragalactic neutron stars (Cordes & Wasserman, 2016), and giant flares from magnetars (Thornton et al., 2013; Pen & Connor, 2015).
Observationally, most FRBs are non-recurrent, with the exception of FRB 121102 (Spitler et al., 2014, 2016). Thanks to its repeatability, radio interferometric observations of its bursts have achieved a subarcsecond localization and identify a faint and persistent optical counterpart (Chatterjee et al., 2017). Follow-up observations reveal that the host galaxy is an irregular and low-metallicity dwarf galaxy at and does not show optical signatures of AGN activity (Marcote et al., 2017; Tendulkar et al., 2017) and that the source of FRB 121102 is spatially coincident with a star-forming region (Bassa et al., 2017; Kokubo et al., 2017). These observations are consistent with the proposal of newly born neutron stars as the origin of FRBs. Unlike FRB 121102 no repeat emission has yet been discovered in the other FRBs despite considerable effort (Lorimer et al., 2007; Ravi et al., 2015; Petroff et al., 2015a).
Owing to the large single-dish telescopes used to discover FRBs, localization is typically arcmin, and there are a large number () of galaxies in the localized region. In order to clarify the origin of FRBs, the first step is a precise localization with telescopes which have better spatial resolution. In scenarios involving coincident optical emission this can be achieved by using wide-field optical telescopes to monitor FRB fields. The SUrvey for Pulsars and Extragalactic Radio Bursts (SUPERB) operates a realtime data analysis pipeline issuing realtime alerts (Keane et al., 2018; Bhandari et al., 2018). This enables searches for contemporaneous variability in the radio, or other wavelengths, or indeed in other windows of observation such as neutrinos or gravitational waves. Previously Keane et al. (2016) reported a variable radio source in the field of FRB 150418, which was thought to be a fading counterpart associated with the FRB, but continued longer-term monitoring revealed a persistent radio source with short timescale variability (Williams & Berger, 2016; Johnston et al., 2017). The variability and the location are consistent with an active galactic nuclei at the galaxy’s center (Akiyama & Johnson, 2016; Bassa et al., 2016) but it is unclear if this is truly associated with the FRB event, or more generally how FRBs and AGN could be associated (see e.g., Vieyro et al. (2017)).
After a realtime alert from the SUPERB collaboration, we performed optical imaging observations of FRB 151230 detected in beam 04 of the Parkes multi-beam receiver (Manchester et al., 2001). This FRB has a DM of pc cm-3 corresponding to an estimated redshift of assuming it lies along an average line of sight through the Universe (Bhandari et al., 2018). An optical afterglow is expected by some theoretical models, e.g., the merger of double neutron star binaries and double white dwarf binaries. We use Subaru/Hyper Suprime-Cam (HSC, Miyazaki et al. (2012, 2018)) that is a unique wide-field camera on an 8m-class telescope with a field of view of 1.77 deg2 and a pixel size of arcsec. The HSC has the highest survey power per unit time of any optical telescope and its field of view is 40 times larger than the typical localization of FRBs. Thus it is the most powerful instrument for the follow-up observations of FRB fields in the optical.
This paper consists of the following sections. In Section 2, the observations and data analyses are described. In Section 3, we present multicolor light curves of candidates possibly associated with FRB 151230, and discuss their nature. In Section 4, we describe constraints on the association between FRB 151230 and Type Ia supernova (SN Ia) from the observations. In Section 5, a discussion and our conclusions are presented. In this paper, we adopt the AB magnitude system unless otherwise noted and the fiducial cosmology with , , and .
2 Observations and data reduction
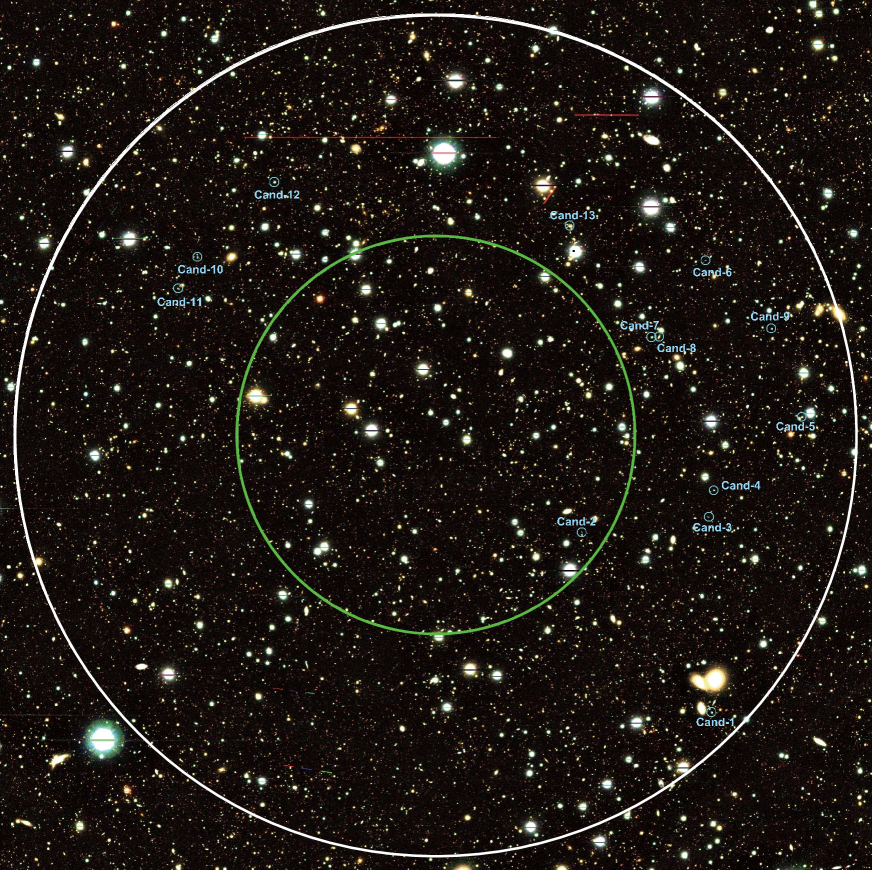
FRB 151230 was discovered at 2015-12-30 16:15:46 (UT) at GHz at , (J2000.0) with an uncertainty of arcmin diameter which corresponds to the full width at half maximum (FWHM) of the receiver beam pattern (Figure 1). In this paper, in order to not miss candidates outside the FWHM radius, we take a radius of 15 arcmin to judge whether a candidate is located in the localization area of FRB 151230. The FRB’s true position is very unlikely to be beyond this radius unless the source count slope is unrealistically steep (Macquart & Ekers, 2018). Hereafter, we call this circle the localization area of FRB 151230. The mean Galactic color excess within a circle of arcmin radius in this direction is mag (Schlafly & Finkbeiner, 2011),333http://irsa.ipac.caltech.edu/applications/DUST/ although there is a small scatter in this value of mag across the localization. The extinction in the host galaxies is not corrected. We performed HSC -, -, and -band follow-up imaging observations with min exposures on Jan 7, 10, and 13, 2016 (UT, Days 8, 11, and 14 after FRB 151230). Each exposure consists of multiple 3.5- or 4-min shots with dithering. The FWHMs of the point spread function (PSF) range from to arcsec. The observation details are summarized in Table Optical follow-up observation of Fast Radio Burst 151230.
The data is reduced using HSC pipeline version 4.0.5 (Bosch et al., 2017), which is based on the LSST pipeline (Ivezic et al., 2008; Axelrod et al., 2010; Jurić et al., 2015). It provides packages for bias subtraction, flat fielding, astrometry, flux calibration, mosaicing, warping, stacking, image subtraction, source detection, and source measurement. The astrometric and photometric calibration is made relative to the Pan-STARRS1 (PS1, Chambers et al. (2016)) with a 4.0 arcsec (24-pixel) aperture diameter. The images after CCD processing are warped to the predefined skymap with a pixel size of arcsec and the calibrated images are then stacked with a direct weighted average.
We estimate the limiting magnitudes of the stacked images in the localization area of FRB 151230 on Days , , and using between and apertures with a diameter of twice the FWHM size of PSF (Table Optical follow-up observation of Fast Radio Burst 151230). Here, we distribute randomly and independently the apertures on the sky area without any detection of sources and subtract the local sky flux from the aperture flux. The limiting magnitudes in the localization area of FRB 151230 range from mag to mag (Table Optical follow-up observation of Fast Radio Burst 151230). The deepest observation on Day 10 detects sources in the localization area of FRB 151230.
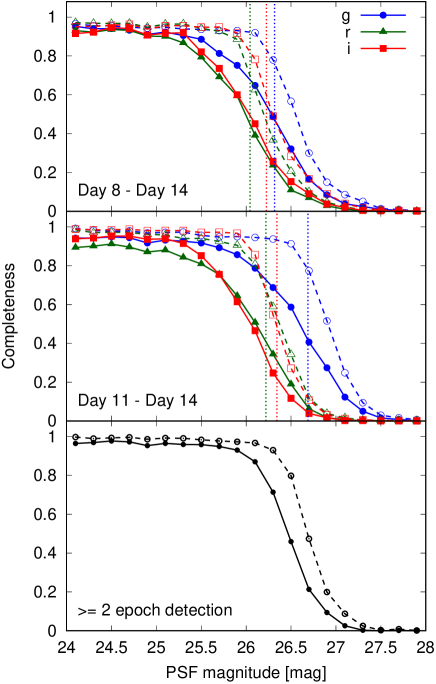
In order to select variable objects, we perform image subtraction between the stacked images. The images taken on Day 14 are set as the reference images and are subtracted from the science images taken on Days 8 and 11 because a time-variable object would typically have a larger differential flux over a longer time interval. The images with narrower PSF between reference and science images are convolved with kernels to make their PSFs equivalent (Alard & Lupton, 1998). The limiting magnitudes of the difference images in the localization area of FRB 151230 are estimated with randomly and independently distributed apertures with a diameter of twice the FWHM size of the PSF. As the image subtraction between images with similar depths result in a shallower depth than the original images, the limiting magnitudes of the difference images range from mag to mag. We also evaluate detection completeness by random injection and detection of artificial point sources with various magnitudes (Figure 2). The limiting magnitudes are comparable to the PSF magnitude at completeness. The limiting magnitudes and the completeness magnitudes in the difference images are summarized in Table Optical follow-up observation of Fast Radio Burst 151230.
Point sources in the difference images are detected and measured with the HSC pipeline. Since there are many false positives due to noise, we adopt the following criteria to identify bona fide sources; (1) significance higher than , (2) where and are the lengths of the major and minor axes of a shape of a source, respectively, (3) FWHM of a source is between 0.7 to 1.3 times that of the PSF, (4) the residual of PSF subtraction from a source is . These criteria are similar to those adopted in searches for optical counterparts of gravitational wave signals (Utsumi et al., 2018; Tominaga et al., 2018). After this screening, 118 and 1078 variable sources remain inside and outside the localization area of FRB 151230, respectively. We also estimate the detection completeness after the screening with injected artificial sources. The completeness magnitudes after the screening are - mag shallower than those before owing to low signal-to-noise ratios (S/N). We further imposed the sources be detected at least twice at the same location in the 6 difference images. The completeness magnitude after this additional screening is mag for point sources, which is the deepest among all the optical follow-up observations of FRBs which cover the entire localization area (Petroff et al., 2015b; Keane et al., 2016; Bhandari et al., 2018).
The PSF shape in the stacked images sometimes fails the image subtraction at the center of galaxies leaving an unphysical residual. Thus, we also perform an alternative procedure of image subtraction; the stacked reference image is subtracted from each exposure of the science images and the resultant difference images are stacked. If the source is located within a separation of arcsec ( pixel) from objects in the stacked images or objects in the PS1 catalog, we check whether the source is detected in the alternative procedure. Here, the positions of objects in the stacked images are measured with the HSC pipeline at the epoch when the source is faintest. We exclude the source if it is not detected in the alternative procedure. After this exclusion, 53 variable sources inside the localization area of FRB 151230 and 490 variable sources outside the localization area of FRB 151230 remain, respectively. However, false positives, e.g., failures of image subtraction around bright objects (e.g., Figure 1 in Morii et al. (2016)), still remain. Therefore, we visually inspect the variable sources to remove these, and select 13 sources inside the localization area of FRB 151230 as the final candidates. These are summarized in Table Optical follow-up observation of Fast Radio Burst 151230. Transients outside the localization area of FRB 151230 are described in Appendix A.
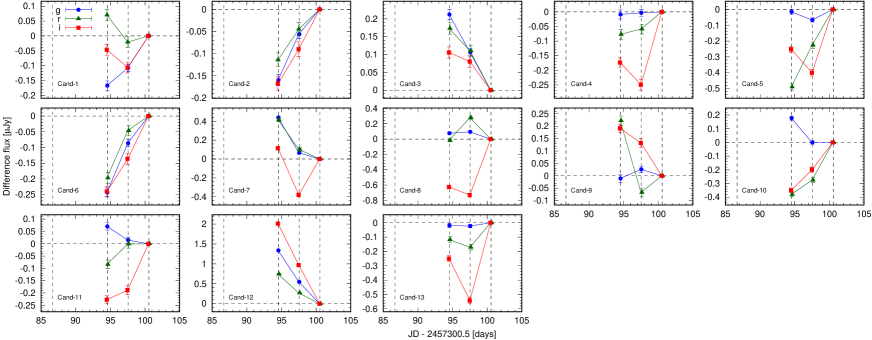
Difference light curves of candidates are derived with forced PSF photometry of the difference images with aperture correction at the location of candidates and dereddening for the Galactic extinction. Figure 3 shows their difference light curves. We also measure the PSF fluxes at the location of candidates in the stacked images with forced PSF photometry. The forced PSF flux in the stacked image is an upper limit of the flux of the candidate because it consists of the fluxes of both the candidate and its host galaxy.
3 Nature of candidates
After the source screening and the visual inspection, 13 final candidates remain. Their locations are shown in Figure 1.
3.1 Light curve fitting and locations within galaxies
In order to investigate the nature of the candidates with the limited available data over week, we primarily perform the difference light curve fitting described in Appendix B. For this, we adopt templates of SNe Ia (Hsiao et al. (2007)), core-collapse SNe (CCSNe; Type Ibc, IIP, IIL, and IIn SNe, Nugent et al. (2002)), and rapid transients (RTs, from the gold sample in Drout et al. (2014)).444We exclude PS1-12bb from the sample because it does not have the data points before the peak. We take into account a variation of the explosion date of templates since the occurrence time of FRB 151230 and an intrinsic variation of templates, e.g., peak absolute magnitude and extinction in the host galaxy. In order to judge the agreement of the template fitting, we employ value, the probability that a distribution with a degree of freedom exceeds a given value by chance.
In addition to the difference light curve fitting, if the flux of the host galaxy is likely to dominate the flux of the candidate, we adopt the photometric redshift of the host galaxy as a criterion to narrow down the possible templates and impose that the redshift derived from the difference light curve fitting be consistent with the photometric redshift. The photometric redshift is derived with the photometry of the host galaxy in the stacked images using a photometric redshift code with Bayesian priors on physical properties of galaxies (Tanaka, 2015). Further, a separation of each candidate from its host galaxy (if existing) is employed to exclude the possibility of active galactic nuclei (AGN) and Galactic stars. We conservatively adopt both the position measured with the HSC pipeline and the position of a pixel with a peak count in a pix pix square centered on the candidate as the possible position of the associated object in the stacked images at the epoch when each candidate is faintest.
In this subsection, we focus on candidates that can be distinguished from optical variability typical of AGNs. As any optical counterpart to FRB 151230 need not have a light curve of known form, we consider (1) candidates reproduced with transient templates with a loose criterion because our aim is only to narrow down possible templates, or (2) candidates located off-center of their host galaxy with a separation of arcsec. After applying the above steps, we pick up 4 candidates (Table Optical follow-up observation of Fast Radio Burst 151230). Nine of the 13 candidates are consistent with optical variability from AGN, and we discard them from further investigation and focus on these 4 candidates in this subsection. Of the remaining 4, 3 candidates are well fitted by the transient templates with .
3.1.1 Candidates consistent with transient templates
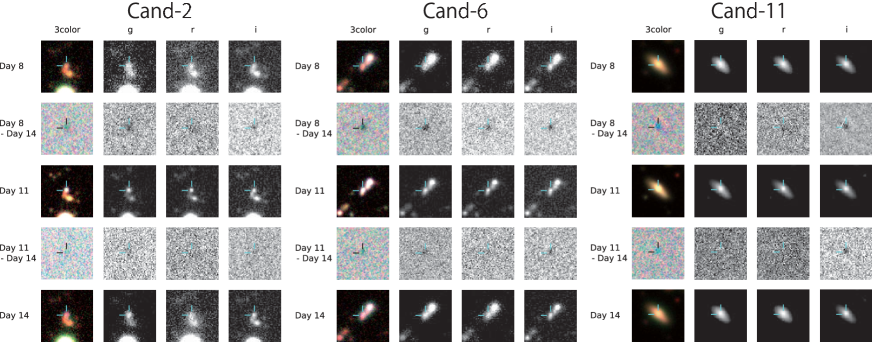
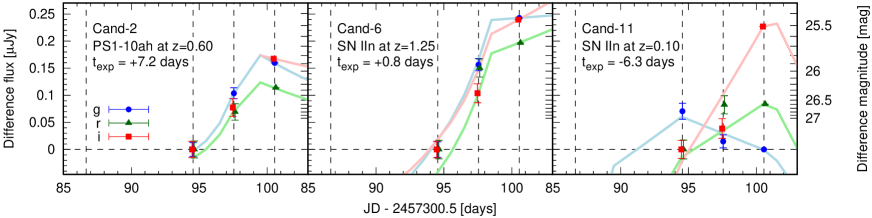
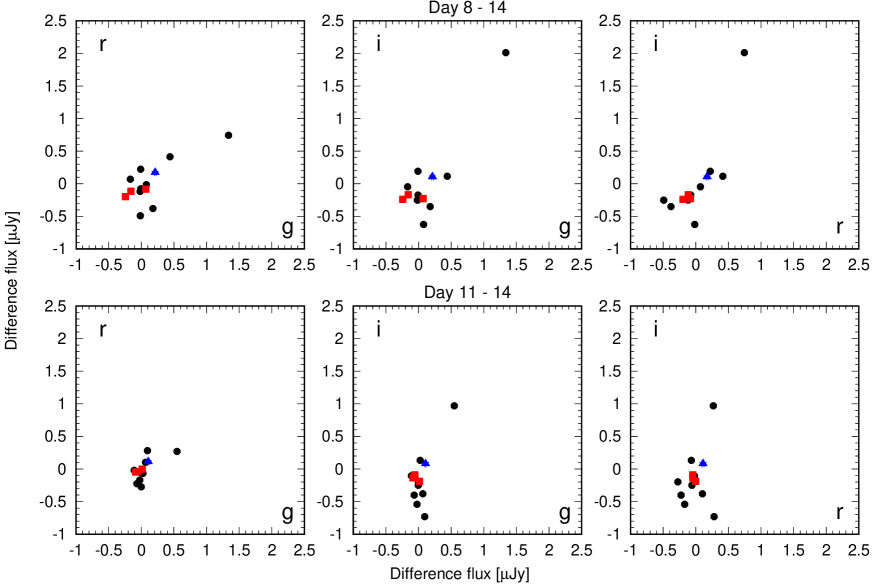
Three candidates, Cand-2, Cand-6, and Cand-11, are well fitted with the transient templates. These candidates are associated with extended objects, presumably galaxies (Figure 4). Their separations from the center of the localization area of FRB 151230 are arcmin for Cand-2, arcmin for Cand-6, and arcmin for Cand-11. As the fluxes in the stacked images are dominated by the fluxes of their host galaxies (Table Optical follow-up observation of Fast Radio Burst 151230), we derive the photometric redshifts of the host galaxies adopting the fluxes on Day 8, on which the contributions of the 3 candidates to the total fluxes are relatively small. The photometric redshifts of the host galaxies of Cand-2, Cand-6, and Cand-11 are , , and , respectively. Here, we adopt the probability as the errors. The photometric redshift of the host galaxy of Cand-6 is inconsistent with the maximum redshift inferred from the DM of FRB 151230 and thus Cand-6 is unlikely to be an optical counterpart of FRB 151230. However, in the next paragraph, we also describe the templates consistent with Cand-6 for comparisons with a theoretical estimate and the total number of candidates outside the localization area.
The best-fit templates within the probability of the photometric redshift are an RT (PS1-10ah) at for Cand-2, an SN IIn at for Cand-6, and an SN IIn at for Cand-11 (Figure 5). We also derive probable templates and possible ranges of parameters allowing the template with the value of of the maximum value for each candidate. While Cand-6 and Cand-11 can be fitted only with the SN IIn template, Cand-2 can also be fitted with SN IIP and IIn templates in addition to the best-fit RT template (Table Optical follow-up observation of Fast Radio Burst 151230). As the difference of the values of Cand-2 between the RT and SN IIn templates is only a factor of , an SN IIn is a comparably good fit to an RT for the origin of Cand-2. The location of the candidate can be used to constrain the possibility of an AGN origin. While Cand-2 is located off-center of the galaxy, Cand-11 is located at the center of the host galaxy and thus optical variability of an AGN cannot be excluded. The most probable templates for Cand-2 include those with day. If Cand-2 exploded at the same date as FRB 151230, the achromatic and rapid rising of Cand-2 is only consistent with SNe IIn, while the RT templates agree with the multicolor light curves of Cand-2 only for days.
3.1.2 A candidate inconsistent with transient templates
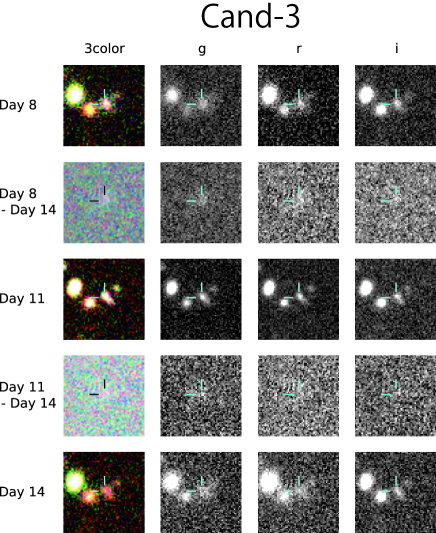
The multicolor light curves of an off-center candidate, Cand-3, cannot be reproduced with any of our transient templates. Cand-3 is located arcsec away from the center of its host galaxy, and arcmin from the center of the localization area of FRB 151230 (Figure 6). Its off-center nature indicates that Cand-3 is likely not due to optical variability of an AGN. As the contribution of Cand-3 to the total flux in the stacked image is not negligible, we can not evaluate the photometric redshift of the host galaxy.
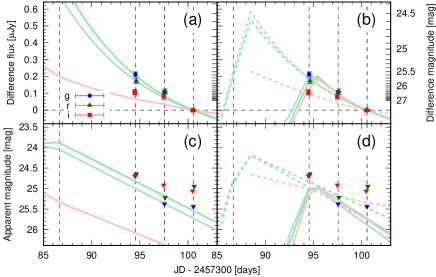
The best-fit template is an RT template (PS1-11qr) being mag fainter than PS1-11qr and having (Table Optical follow-up observation of Fast Radio Burst 151230). The low value stems mainly from the poor agreement in the -band difference light curve (Figure 7a). The most probable template other than PS1-11qr is also an RT template (PS1-12brf) being mag fainter than PS1-12brf with . On the other hand, comparisons with SN Ia and CCSN templates result in a value of .
The forced PSF magnitudes of Cand-3 in the stacked images indicate a -band decline rate of mag day-1 in the observer frame. The rate is consistent with the rest-frame decline of the most rapidly-declining RTs in Drout et al. (2014). Although this could be consistent with kilonova emission from binary neutron stars coalescence (Utsumi et al., 2017), the blue color of Cand-3 on Day 8 is inconsistent with that regardless of the occurrence date because a kilonova with lanthanoid production is red in optical days after the coalescence and becomes redder with time (e.g., Pian et al. (2017)). These results demonstrate that the multicolor light curves of Cand-3 can be reproduced only by the RT templates. We also note that, if we set the criterion to be , there are no candidates fitted with the RT templates other than Cand-2 and Cand-3, and Cand-4 is fitted with an SN IIL template with .
The reason why Cand-3 is not reproduced with the transient templates is the small fluxes in the stacked images, which are faint especially on Day 11 and 14. This could be resolved if Cand-3 has fainter peak magnitude and/or more rapid decline than the RTs observed so far. Since the distribution of the peak magnitude and decline rate of RTs is still not well-known, we test the difference light curve fitting stretching a timescale parameter of the RT templates. Here, we reduce the stretch factor from to in steps of . Doing this, agreement between Cand-3 and RT templates with can be realized in the range with the best agreement achieved with . The best-fit templates with and are shown in Figures 7(b) and 7(d), and the probable templates with and are summarized in Table Optical follow-up observation of Fast Radio Burst 151230. For , the best-fit template is the PS1-10ah template at , which is mag fainter than PS1-10ah, and has . The possible ranges of and are days and , respectively. For , the best-fit template is the PS1-10bjp template at , mag fainter than PS1-10bjp, and with . The possible ranges of and are days and , respectively. The same explosion date as FRB 151230 is included in both of the possible templates with and .
3.2 Multiwavelengh observations and host galaxies
In addition to the multicolor light curves of candidates and the candidate locations in the host galaxies, the multi-wavelength observations and the properties of the host galaxies are useful to constrain the nature of candidates.
Assuming that FRB 151230 is located at the locations of candidates, we estimate the intrinsic radio S/N of FRB 151230 and summarize it in Table Optical follow-up observation of Fast Radio Burst 151230. Taking into account these locations and the putative intrinsic brightness, FRB 151230 at the location of Cand-5 can be detected with beam 01 of the receiver at Parkes with an S/N of . On the other hand, FRB 151230 at the location of the other candidates cannot be detected with the other beams. The non-detection of FRB 151230 in the other beams excludes Cand-5 as an optical counterpart to FRB 151230. Here, we assume a Gaussian profile for each feed horn of the multi-beam receiver at Parkes (Manchester et al., 2001).
Bhandari et al. (2018) reported several radio sources detected in the follow-up observations with the Australia Telescope Compact Array (ATCA, Wilson et al. (2011)), the Karl G. Jansky Very Large Array (VLA), and the Giant Metrewave Radio Telescope (GMRT, Ananthakrishnan (1995)). None of these is located within two times the FWHM of the synthesis beams from the sources detected by VLA and GMRT. On the other hand, Cand-1 and Cand-10 (likely AGN) are located at a distance of about twice the FWHM of the synthesis beam at GHz from the sources detected only with ATCA although any association cannot be conclusive because there are other optical sources in the wide elongated synthesis beam of ATCA. Our other candidates are not associated with any radio sources. The radio flux densities at GHz and GHz are mJy and mJy for Cand-1 and mJy and mJy for Cand-10. The spectral slopes are and for Cand-1 and Cand-10, respectively. These slopes are consistent with of AGN (Planck Collaboration et al., 2016). Additionally, the optical light curves of Cand-1 and Cand-10 are inconsistent with the transient templates. Therefore, if Cand-1 and Cand-10 are associated with the radio sources reported by Bhandari et al. (2018), they are likely to be optical variabilities of AGN. The persistent optical counterparts of the radio sources are described in Appendix C.
We further compare the candidate locations with the Wide-field Infrared Survey Explorer (WISE) catalog (Mainzer et al., 2011), and find that only the host galaxy of Cand-2 could host a AGN based on the color of mag (Vega, Stern et al. (2012)). However, there are multiple galaxies within a resolution element of WISE (Figure 4) and Cand-2 is located off-center of the host galaxy. Thus, Cand-2 is not necessarily the optical variability of an AGN. Furthermore, we check the ROSAT catalog (Boller et al., 2016), the 3XMM-DR7 catalog (Rosen et al., 2016), and the NRAO VLA Sky Survey (NVSS, GHz) catalog (Condon et al., 1998) but there are no associated sources with our 13 variable candidates in these catalogs.
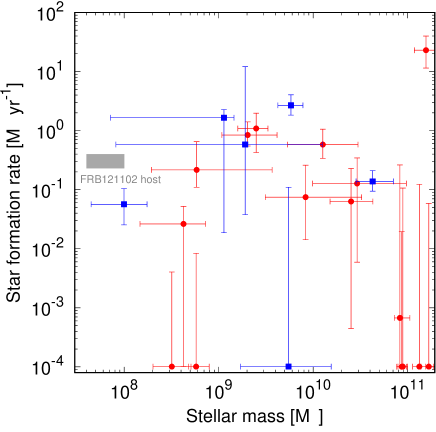
Along with the photometric redshifts of the host galaxies, their stellar masses and star formation rates (SFRs) are also derived for the candidates other than Cand-3. The photometric redshifts of the host galaxies of the candidates other than Cand-3 and Cand-6 are consistent with the maximum redshift inferred from the DM of FRB 151230. While the stellar masses of the host galaxies of the candidates other than Cand-2 and Cand-3 are , the stellar mass of the host galaxy of Cand-2 is comparable with the stellar mass of the host galaxy of FRB 121102 (Bassa et al., 2017; Kokubo et al., 2017; Tendulkar et al., 2017). On the other hand, the SFR of the host galaxy of Cand-2 is yr-1 an order of magnitude lower than that of the host galaxy of FRB 121102. The host galaxy of Cand-2 is classified as a star-forming galaxy and it is consistent with the conclusion that Cand-2 is CCSN or RT. The host galaxies of the candidates other than Cand-3 and Cand-5 have the SFR of yr-1 as a median value and are consistent with hosting CCSNe.
4 Testing Type Ia Supernovae as the origin of FRB 151230
The comparisons of the 13 candidates with SN Ia templates give . Thus, we conclude that all of candidates are inconsistent with SN Ia templates. In this section, we illustrate how the non-detection constrains the association of FRB 151230 with an SN Ia. We adopt the light curve of SNe Ia exploded at Day 0, i.e., , with and .
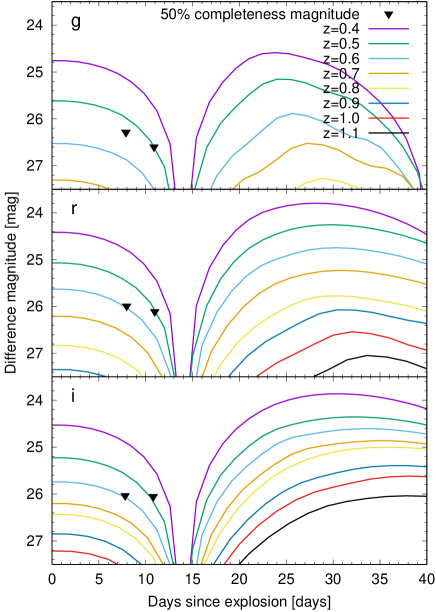
Figure 8 shows the difference magnitude with respect to the flux at Day 14. The PSF magnitudes with detection completeness of are also shown. The difference magnitude of SN Ia is brighter for longer time intervals. The completeness magnitude is comparable with the difference magnitude of SN Ia at between Days 8 and 14. Therefore, our analysis can exclude the association of SNe Ia with at with FRB 151230. On the other hand, the DM of FRB 151230 puts an upper limit on its redshift of assuming an average line of sight in the Universe (Bhandari et al., 2018). Our results leave room for SNe Ia association with FRB 151230 at . In this range, this constraint then corresponds to an upper limit of the DM of the host galaxy of FRB 151230. If an SN Ia is associated with FRB 151230, the DM of the host galaxy of FRB 151230 needs to be less than pc cm-3 (McQuinn, 2014).
5 Discussion & Conclusion
We performed optical follow-up observations of FRB 151230 using Subaru/HSC on Days 8, 10, and 14 after a realtime alert from the SUPERB collaboration (Bhandari et al., 2018). The survey field covers the localization area of FRB 151230, and the completeness magnitude is mag for point sources, which is the deepest among the optical follow-up observations of FRBs covering the entire localization area.
After various sifting and screening techniques are applied and subsequent visual inspection, we find candidates in the localization area of FRB 151230. The properties of candidates are summarized in Table Optical follow-up observation of Fast Radio Burst 151230. Among them, the association of Cand-5 with FRB 151230 is excluded by the non-detection in the radio of FRB 151230 in the other beams at Parkes. Another 8 candidates are inconsistent with the transient templates and are located at the center of extended objects, and thus could be optical variabilities of AGNs. In particular, Cand-1 and Cand-10 are located at a distance of about twice the FWHM from the radio sources detected with ATCA, and the spectral slopes of the radio sources are consistent with that of the AGN. Although the possibility that one of these 8 candidates and the optical variability of AGN are associated with FRB 151230 is not ruled out, it is also possible that all of them are unrelated to FRB 151230 and the association between them and FRB 151230 can not be investigated from our optical follow-up observations. The photometric redshifts of the host galaxies of these 8 candidates are consistent with the maximum redshift inferred from the DM of FRB 151230.
After considering the agreement of light curves fit with known transient templates, the location of candidates in host galaxies, and photometric redshifts, we focus on candidates. The final candidate, Cand-6, is associated with a galaxy with a photometric redshift higher than the maximum redshift estimated from the DM of FRB 151230. They are not prominent in -, -, and -band difference fluxes (Figure 9). Two candidates among the that we deemed to be most interesting are well fitted with transient templates with . Their most probable templates are RTs at , SN IIP at , and SNe IIn at for Cand-2, and SNe IIn at for Cand-11. Cand-11 is located at the center of an extended object and thus could be due to the optical variabilities of AGN. Cand-3 is not well fitted with the transient templates and located off-center of its host galaxy. However, by stretching the RT templates, the multicolor light curves of Cand-3 are reproduced with . This suggests that Cand-3 is an RT with a rather faint peak and rapid decline. Cand-2 and Cand-3 could have exploded at the same date as FRB 151230, although some theoretical models for FRBs do not necessarily require this. However, we can not conclude their association with FRB 151230.
According to a theoretical estimate with a mock catalog of SNe and observed SN rates (Niino et al., 2014), the number of candidates reproduced with SN templates, i.e., Cand-2, Cand-6, and Cand-11, is consistent with the total SN rate, including SNe Ia and CCSNe. Also, the number density of candidates reproduced with the transient templates inside the localization area of FRB 151230 is roughly consistent with that outside the localization area of FRB 151230 (Appendix A) and that of SNe detected in a previous study with a time interval of days (Morokuma et al., 2008).
No candidates are reproduced with the SN Ia template. Comparing the completeness magnitude with the difference light curve of SN Ia templates, our observation is sensitive enough to detect SNe Ia with at . According to the DM of FRB 151230, this leaves room for an SNe Ia association with FRB 151230 only at . In other words, if an SN Ia is associated with FRB 151230, the DM of the host galaxy of FRB 151230 needs to be less than pc cm-3.
Cand-2 and Cand-3 can be well fitted as RTs, of which the volumetric rate is of the CCSN rate (Drout et al., 2014). While Cand-2 might be an SN IIn according to the values, the multicolor light curves of Cand-3 can be reproduced only with RTs with a faint peak and rapid decline. The light curve of Cand-3 is well reproduced with the stretched RT templates with with . The most probable templates for Cand-3 include the RT templates with the same explosion date as FRB 151230. We compute the expected number of RTs which will be detected coincidentally in the localization area with -band differential flux Jy in a six-day interval using the method outlined in Niino et al. (2014). We utilize the best-fit template for Cand-3 after stretching, the resultant number of coincident RTs in the localization area is as small as , and the probability to have this event during the observation is thus according to the Poisson distribution. Outside the localization area of FRB 151230, the number of candidates best-fitted with the RT template is 1. These results suggest that the coincident detection of an RT irrelevant to FRB 151230 is relatively unlikely in the localization area. Thus, if Cand-3 is an RT, it may relate to FRB 151230. The volumetric rates of RTs and FRBs are consistent (Drout et al., 2014; Keane & Petroff, 2015; Bhandari et al., 2018).
There are two possible mechanisms in the literature for an RT and FRB to be associated; (1) the RT emission from an ultra-stripped Type Ic supernova from a close interacting binary system (Suwa et al., 2015; Tauris et al., 2015; Moriya et al., 2017; Yoshida et al., 2017) and the FRB emission from the interaction between supernova shock and magnetosphere of a neutron star (Egorov & Postnov, 2009), and (2) the RT emission from an accretion-induced collapse of the merger remnant of He and CO white dwarfs (Brooks et al., 2017) and the FRB emission from the collapse of a strongly magnetized supermassive rotating neutron star to a black hole immediately after the accretion-induced collapse (Falcke & Rezzolla, 2014; Zhang, 2014; Moriya, 2016). However, there is a major caveat that the RT ejecta can be optically thick at radio frequencies immediately after the explosion and can totally absorb the FRB emission (Connor et al., 2016; Piro, 2016; Kashiyama & Murase, 2017).
Our observation demonstrates that deep and wide observations detect several unassociated transients in the localization area of FRB. Thus, it is important to establish a method to exclude them. Theortical studies need to more precisely predict light curve evolution to identify the optical counterparts of FRBs.
The optical observations give a lower limit on the redshift. This is complementary with the upper limit on redshift of FRBs that can be estimated by the DM of FRBs. We encourage rapid reporting of FRBs, especially those with low DM values, to enable future wide-field optical work aiming at identifying any and all associated emission in this band.
This research has been supported in part by the research grant program of Toyota foundation (D11-R-0830), the natural science grant of the Mitsubishi Foundation, the research grant of the Yamada Science Foundation, World Premier International Research Center Initiative, MEXT, Japan, and by JSPS KAKENHI Grant Numbers JP15H02075, JP15H05440, JP15K05018, JP16H02158, JP17H06362, JP17H06363, JP17K14255, JP18K03692. EP receives funding from the European Research Council under the European Union Seventh Framework Programme (FP/2007-2013) / ERC Grant Agreement n. 617199. We thank the LSST Project for making their code available as free software at http://dm.lsstcorp.org. Funding for SDSS-III has been provided by the Alfred P. Sloan Foundation, the Participating Institutions, the National Science Foundation, and the U.S. Department of Energy Office of Science. The SDSS-III web site is http://www.sdss3.org/. SDSS-III is managed by the Astrophysical Research Consortium for the Participating Institutions of the SDSS-III Collaboration including the University of Arizona, the Brazilian Participation Group, Brookhaven National Laboratory, Carnegie Mellon University, University of Florida, the French Participation Group, the German Participation Group, Harvard University, the Instituto de Astrofisica de Canarias, the Michigan State/Notre Dame/JINA Participation Group, Johns Hopkins University, Lawrence Berkeley National Laboratory, Max Planck Institute for Astrophysics, Max Planck Institute for Extraterrestrial Physics, New Mexico State University, New York University, Ohio State University, Pennsylvania State University, University of Portsmouth, Princeton University, the Spanish Participation Group, University of Tokyo, University of Utah, Vanderbilt University, University of Virginia, University of Washington, and Yale University.
Appendix A Transients outside the localization area of FRB 151230
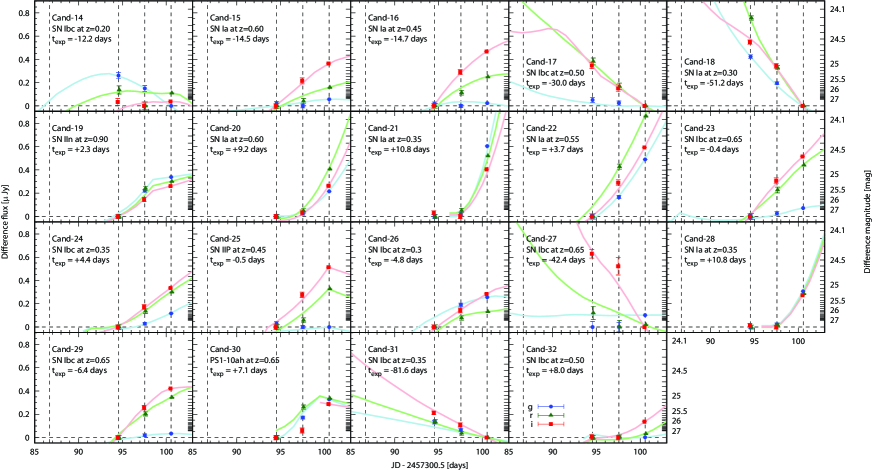
As the field of view of HSC is 9 times wider than a circle with a radius of arcmin, i.e., the localization area of FRB 151230 adopted in this paper, although the depth outside the localization area is mag shallower than that inside the localization area. Thus, we have a large sample of candidates being irrelevant to FRB 151230, which can be a control sample. We perform the visual inspection and the light curve fitting for the 490 candidates outside the localization area of FRB 151230. If the photometric redshift of the host galaxy is available, only the templates in the probability are allowed. As a result, 19 visually-selected candidates555The number of candidates reproduced with the transient templates is if we adopt the criterion of . are fitted well with the transient templates (Table Optical follow-up observation of Fast Radio Burst 151230 and Figure 10) with the values better than the best-fit template for Cand-3, i.e., . Taking into account the wide area and the shallow depth outside the localization area of FRB 151230, the number density of candidates reproduced with the transient templates is roughly consistent with that of candidates inside the localization area of FRB 151230. The best-fit templates are SNe Ia for 7 candidates, CCSNe for 11 candidates, and an RT for 1 candidate. Considering the small number statistics, the ratio of the numbers of the candidates consistent with RT templates to those with CCSN templates is consistent with the ratio of RTs to CCSNe (, Drout et al. (2014)).
Appendix B Light curve fitting
For the light curve fitting, we adopt templates of SNe Ia (Hsiao et al. (2007)), CCSNe (Nugent et al. (2002)), and RTs (Drout et al. (2014)). In order to take into account intrinsic variations, we allow variations of several parameters; stretch , color , and intrinsic variation for the SN Ia templates, and peak absolute -band magnitude and extinction in the host galaxy for the CCSN and RT templates. The peak absolute -band magnitude of the SN Ia templates is derived with equation (4) in Barbary et al. (2012). The host galaxy extinction for the CCSN and RT templates is characterized with the color excess with a range of to , and the extinction curve of the host galaxy is assumed to be the same as in our Galaxy (Pei, 1992). While we adopt the peak magnitudes of the observed RTs with assuming a variation of mag, the average and variation of other parameters are taken from Barbary et al. (2012) for SNe Ia and Dahlen et al. (2012) for CCSNe. The adopted templates and the range of variation are summarized in Table Optical follow-up observation of Fast Radio Burst 151230.
Template light curves are derived with interpolating or extrapolating the spectral energy distribution for various redshift from to for SNe IIn or from to for other transients with as done in Okumura et al. (2014); Niino et al. (2014). We force the template to have the information of the -, -, and -bands at least in an epoch and to have the information of at least 1 band in more than 1 epoch. The explosion date of templates since the occurrence time of FRB 151230 are varied with day at day in the observer frame. With the derived template light curves, we calculate fluxes on Days 8, 11, and 14 and difference fluxes between Days 8 and 14 and between Days 11 and 14.
We expedientially judge the agreement of light curves of candidates and templates with the use of the value of chi square statistics as a guide. The chi square is defined as
| (1) | |||||
where , , and are the observed flux, the template flux, and the observed standard deviation, respectively. The suffix i represents s for the stacked images and d for the difference images. The Heaviside function is defined to be for and otherwise. The number of observations that are used for the estimation of is
| (2) | |||||
A degree of freedom of the chi square statistics is the difference between the numbers of independent observations and independent parameters. However, an identification of the independent parameters requires great care and our aim is only to constrain possible templates. Thus we conservatively set the degree of freedom as because is obviously independent on the other parameters related to the properties of transients.
Appendix C Persistent optical counterparts of radio sources
The radio follow-up observations of FRB 151230 with VLA and GMRT detect 32 independent radio sources (Bhandari et al., 2018). Among them, 22 radio sources have extended optical counterparts within the FWHM of the synthesis beams in the images obtained on Day 10 which have the best seeing. Here, we adopt the position measured with GMRT if a source is detected with both of VLA and GMRT because GMRT has a higher spatial resolution than VLA. For these optical counterparts, the stellar masses and the SFR are derived using the photometric redshift code and summarized in Figure 11. Also, we compare the locations of radio sources having optical counterparts with the WISE catalog and identify the sources being likely to host a AGN. There are no radio source hosted in a galaxy identical with the host galaxy of FRB 121102 in terms of the stellar mass and SFR, and some of the radio sources could be emissions from AGNs according to the WISE color of the host galaxies. Further observations are required to conclude whether the radio sources are associated with FRB 151230 or not.
References
- Akiyama & Johnson (2016) Akiyama, K., & Johnson, M. D. 2016, ApJ, 824, L3
- Alard & Lupton (1998) Alard, C., & Lupton, R. H. 1998, ApJ, 503, 325
- Ananthakrishnan (1995) Ananthakrishnan, S. 1995, Journal of Astrophysics and Astronomy Supplement, 16, 427
- Axelrod et al. (2010) Axelrod, T., Kantor, J., Lupton, R. H., & Pierfederici, F. 2010, in Society of Photo-Optical Instrumentation Engineers (SPIE) Conference Series, Vol. 7740, Society of Photo-Optical Instrumentation Engineers (SPIE) Conference Series, 15
- Bannister & Madsen (2014) Bannister, K. W., & Madsen, G. J. 2014, MNRAS, 440, 353
- Bannister et al. (2017) Bannister, K. W., et al. 2017, ApJ, 841, L12
- Barbary et al. (2012) Barbary, K., et al. 2012, ApJ, 745, 31
- Bassa et al. (2016) Bassa, C. G., et al. 2016, MNRAS, 463, L36
- Bassa et al. (2017) —. 2017, ApJ, 843, L8
- Bhandari et al. (2018) Bhandari, S., et al. 2018, MNRAS, 475, 1427
- Boller et al. (2016) Boller, T., Freyberg, M. J., Trümper, J., Haberl, F., Voges, W., & Nandra, K. 2016, A&A, 588, A103
- Bosch et al. (2017) Bosch, J., et al. 2017, ArXiv e-prints, arXiv:1705.06766
- Brooks et al. (2017) Brooks, J., Schwab, J., Bildsten, L., Quataert, E., Paxton, B., Blinnikov, S., & Sorokina, E. 2017, ApJ, 850, 127
- Caleb et al. (2017) Caleb, M., et al. 2017, MNRAS, 468, 3746
- Chambers et al. (2016) Chambers, K. C., et al. 2016, ArXiv e-prints, arXiv:1612.05560
- Champion et al. (2016) Champion, D. J., et al. 2016, MNRAS, 460, L30
- Chatterjee et al. (2017) Chatterjee, S., et al. 2017, Nature, 541, 58
- Condon et al. (1998) Condon, J. J., Cotton, W. D., Greisen, E. W., Yin, Q. F., Perley, R. A., Taylor, G. B., & Broderick, J. J. 1998, AJ, 115, 1693
- Connor et al. (2016) Connor, L., Sievers, J., & Pen, U.-L. 2016, MNRAS, 458, L19
- Cordes & Wasserman (2016) Cordes, J. M., & Wasserman, I. 2016, MNRAS, 457, 232
- Dahlen et al. (2012) Dahlen, T., Strolger, L.-G., Riess, A. G., Mattila, S., Kankare, E., & Mobasher, B. 2012, ApJ, 757, 70
- Drout et al. (2014) Drout, M. R., et al. 2014, ApJ, 794, 23
- Egorov & Postnov (2009) Egorov, A. E., & Postnov, K. A. 2009, Astronomy Letters, 35, 241
- Falcke & Rezzolla (2014) Falcke, H., & Rezzolla, L. 2014, A&A, 562, A137
- Hsiao et al. (2007) Hsiao, E. Y., Conley, A., Howell, D. A., Sullivan, M., Pritchet, C. J., Carlberg, R. G., Nugent, P. E., & Phillips, M. M. 2007, ApJ, 663, 1187
- Ivezic et al. (2008) Ivezic, Z., Tyson, J. A., Allsman, R., Andrew, J., Angel, R., & for the LSST Collaboration. 2008, ArXiv e-prints, arXiv:0805.2366
- Johnston et al. (2017) Johnston, S., et al. 2017, MNRAS, 465, 2143
- Jurić et al. (2015) Jurić, M., et al. 2015, ArXiv e-prints, arXiv:1512.07914
- Kashiyama et al. (2013) Kashiyama, K., Ioka, K., & Mészáros, P. 2013, ApJ, 776, L39
- Kashiyama & Murase (2017) Kashiyama, K., & Murase, K. 2017, ApJ, 839, L3
- Keane & Petroff (2015) Keane, E. F., & Petroff, E. 2015, MNRAS, 447, 2852
- Keane et al. (2012) Keane, E. F., Stappers, B. W., Kramer, M., & Lyne, A. G. 2012, MNRAS, 425, L71
- Keane et al. (2016) Keane, E. F., et al. 2016, Nature, 530, 453
- Keane et al. (2018) —. 2018, MNRAS, 473, 116
- Kokubo et al. (2017) Kokubo, M., et al. 2017, ApJ, 844, 95
- Lorimer et al. (2007) Lorimer, D. R., Bailes, M., McLaughlin, M. A., Narkevic, D. J., & Crawford, F. 2007, Science, 318, 777
- Macquart & Ekers (2018) Macquart, J.-P., & Ekers, R. D. 2018, MNRAS, 474, 1900
- Mainzer et al. (2011) Mainzer, A., et al. 2011, ApJ, 731, 53
- Manchester et al. (2001) Manchester, R. N., et al. 2001, MNRAS, 328, 17
- Marcote et al. (2017) Marcote, B., et al. 2017, ApJ, 834, L8
- Masui et al. (2015) Masui, K., et al. 2015, Nature, 528, 523
- McQuinn (2014) McQuinn, M. 2014, ApJ, 780, L33
- Miyazaki et al. (2012) Miyazaki, S., et al. 2012, in Society of Photo-Optical Instrumentation Engineers (SPIE) Conference Series, Vol. 8446, Society of Photo-Optical Instrumentation Engineers (SPIE) Conference Series, 0
- Miyazaki et al. (2018) Miyazaki, S., et al. 2018, PASJ, 70, S1
- Morii et al. (2016) Morii, M., et al. 2016, PASJ, 68, 104
- Moriya (2016) Moriya, T. J. 2016, ApJ, 830, L38
- Moriya et al. (2017) Moriya, T. J., et al. 2017, MNRAS, 466, 2085
- Morokuma et al. (2008) Morokuma, T., et al. 2008, ApJ, 676, 163
- Niino et al. (2014) Niino, Y., Totani, T., & Okumura, J. E. 2014, PASJ, 66, L9
- Nugent et al. (2002) Nugent, P., Kim, A., & Perlmutter, S. 2002, PASP, 114, 803
- Okumura et al. (2014) Okumura, J. E., et al. 2014, PASJ, 66, 49
- Pei (1992) Pei, Y. C. 1992, ApJ, 395, 130
- Pen & Connor (2015) Pen, U.-L., & Connor, L. 2015, ApJ, 807, 179
- Petroff et al. (2015a) Petroff, E., et al. 2015a, MNRAS, 454, 457
- Petroff et al. (2015b) —. 2015b, MNRAS, 447, 246
- Petroff et al. (2016) —. 2016, PASA, 33, e045
- Pian et al. (2017) Pian, E., et al. 2017, Nature, 551, 67
- Piro (2016) Piro, A. L. 2016, ApJ, 824, L32
- Planck Collaboration et al. (2016) Planck Collaboration, et al. 2016, A&A, 596, A106
- Ravi et al. (2015) Ravi, V., Shannon, R. M., & Jameson, A. 2015, ApJ, 799, L5
- Ravi et al. (2016) Ravi, V., et al. 2016, Science, 354, 1249
- Rosen et al. (2016) Rosen, S. R., et al. 2016, A&A, 590, A1
- Schlafly & Finkbeiner (2011) Schlafly, E. F., & Finkbeiner, D. P. 2011, ApJ, 737, 103
- Spitler et al. (2014) Spitler, L. G., et al. 2014, ApJ, 790, 101
- Spitler et al. (2016) —. 2016, Nature, 531, 202
- Stern et al. (2012) Stern, D., et al. 2012, ApJ, 753, 30
- Suwa et al. (2015) Suwa, Y., Yoshida, T., Shibata, M., Umeda, H., & Takahashi, K. 2015, MNRAS, 454, 3073
- Tanaka (2015) Tanaka, M. 2015, ApJ, 801, 20
- Tauris et al. (2015) Tauris, T. M., Langer, N., & Podsiadlowski, P. 2015, MNRAS, 451, 2123
- Tendulkar et al. (2017) Tendulkar, S. P., et al. 2017, ApJ, 834, L7
- Thornton et al. (2013) Thornton, D., et al. 2013, Science, 341, 53
- Tominaga et al. (2018) Tominaga, N., et al. 2018, PASJ, arXiv:1710.05865
- Totani (2013) Totani, T. 2013, PASJ, 65, L12
- Utsumi et al. (2017) Utsumi, Y., et al. 2017, PASJ, 69, 101
- Utsumi et al. (2018) —. 2018, PASJ, 70, 1
- Vieyro et al. (2017) Vieyro, F. L., Romero, G. E., Bosch-Ramon, V., Marcote, B., & del Valle, M. V. 2017, A&A, 602, A64
- Williams & Berger (2016) Williams, P. K. G., & Berger, E. 2016, ApJ, 821, L22
- Wilson et al. (2011) Wilson, W. E., et al. 2011, MNRAS, 416, 832
- Yoshida et al. (2017) Yoshida, T., Suwa, Y., Umeda, H., Shibata, M., & Takahashi, K. 2017, MNRAS, 471, 4275
- Zhang (2014) Zhang, B. 2014, ApJ, 780, L21
Observations with Subaru/Hyper Suprime-Cam. UT Epoch Filter Exposure Seeinga Limiting time magnitudeb (s) (arcsec) (mag) 2016-01-07 Day 8 3150 1.44 26.4 2016-01-07 Day 8 4200 1.26 26.3 2016-01-07 Day 8 4200 0.91 26.5 2016-01-10 Day 11 3600 0.83 27.3 2016-01-10 Day 11 4080 0.68 27.3 2016-01-10 Day 11 3600 0.70 26.6 2016-01-13 Day 14 3600 1.31 26.5 2016-01-13 Day 14 3600 1.43 26.0 2016-01-13 Day 14 3600 0.81 26.4 aFull width at half maximum in the stacked images. b limiting magnitude with aperture diameter of twice of FWHM of seeing.
Information regarding difference images. Epoch Filter PSF Limiting sizea magnitudeb completeness completeness magnitudec magnituded (arcsec) (mag) (mag) (mag) Day 8 14 1.44 26.3 26.6 26.3 Day 8 14 1.44 26.0 26.2 26.0 Day 8 14 0.91 26.2 26.3 26.0 Day 11 14 1.31 26.7 26.9 26.6 Day 11 14 1.43 26.2 26.4 26.1 Day 11 14 0.81 26.3 26.3 26.1 aFull width at half maximum in the difference images. b limiting magnitude with aperture diameter of twice of FWHM of PSF. c PSF magnitude with the detection completeness of before the source screening. d PSF magnitude with the detection completeness of after the source screening.
ccccc
Candidate information.
Name
Separationa Separationb Radio S/Nc RA Dec
(arcmin) (arcsec)
Epoch
(Jy) (Jy) (Jy)
\endfirstheadName Separationa Separationb RA Dec
(arcmin) (arcsec)
Epoch
(Jy) (Jy) (Jy)
\endhead\endfootaSeparation from the center of the
localization area of FRB 151230.
bSeparation from the objects in the stacked images or
the objects in the PS1 catalog.
cIntrinsic radio S/N of FRB 151230 at the candidate location.
dUpper limits for the fluxes of the candidates.
\endlastfoot Cand-1
09:40:10.67 03:36:56.4
Day 8
Day 11
Day 14
Day 8 Day 14
Day 11 Day 14
Cand-2
09:40:29.18 03:30:32.2
Day 8
Day 11
Day 14
Day 8 Day 14
Day 11 Day 14
Cand-3
09:40:11.07 03:29:59.4
Day 8
Day 11
Day 14
Day 8 Day 14
Day 11 Day 14
Cand-4
09:40:10.39 03:29:02.1
Day 8
Day 11
Day 14
Day 8 Day 14
Day 11 Day 14
Cand-5
09:39:57.85 03:26:25.3
Day 8
Day 11
Day 14
Day 8 Day 14
Day 11 Day 14
Cand-6
09:40:11.61 03:20:51.9
Day 8
Day 11
Day 14
Day 8 Day 14
Day 11 Day 14
Cand-7
09:40:19.25 03:23:35.5
Day 8
Day 11
Day 14
Day 8 Day 14
Day 11 Day 14
Cand-8
09:40:18.22 03:23:35.1
Day 8
Day 11
Day 14
Day 8 Day 14
Day 11 Day 14
Cand-9
09:40:02.18 03:23:16.7
Day 8
Day 11
Day 14
Day 8 Day 14
Day 11 Day 14
Cand-10
09:41:23.97 03:20:44.9
Day 8
Day 11
Day 14
Day 8 Day 14
Day 11 Day 14
Cand-11
09:41:26.72 03:21:52.2
Day 8
Day 11
Day 14
Day 8 Day 14
Day 11 Day 14
Cand-12
09:41:12.99 03:18:04.8
Day 8
Day 11
Day 14
Day 8 Day 14
Day 11 Day 14
Cand-13
09:40:30.93 03:19:38.0
Day 8
Day 11
Day 14
Day 8 Day 14
Day 11 Day 14
ccccccc
Templates fitting the difference light curves of candidates.
Name (photometric redshift)
SN Type Numbera
Redshift
value
\endfirsthead Name (photometric redshift)
SN Type Number
Redshift
value
\endhead\endfootaThe number of templates fitting the
multicolor light curves of candidates.
bThe best-fit template.
\endlastfoot Cand-2 (photo-)
PS1-10ahb 30
PS1-10bjp 34
Nugent IIn 116
Nugent IIP 1
Cand-3
PS1-11qrb 9
PS1-12brf 1
Cand-6 (photo-)
Nugent IInb 29
Cand-11 (photo-)
Nugent IInb 8
ccccccc
Templates fitting the difference light curve of Cand-3 stretching the RT templates.
Stretch
SN Type Numbera
Redshift
value
\endfirsthead Stretch
SN Type Number
Redshift
value
\endhead\endfootaThe number of templates fitting the
multicolor light curves of candidates.
bThe best-fit template.
\endlastfoot
PS1-10ahb 45
PS1-12brf 4
PS1-10bjp 3
PS1-10bjpb 11
PS1-10ah 48
p1.2cmp1.3cmp1.1cmp1.5cmp1.cmp1.5cmp0.5cmp0.5cmp0.5cmp1.2cmp1.2cmp1.2cm
Properties of candidates
Name Likely origin Location within galaxies Probable transient templates
Photo- consistent with DM Consistent with non-detection in the
other beams ATCA source VLA source GMRT source AGN signature
in WISE color Low-mass host galaxy
Star-forming host galaxy
\endfirsthead\endhead\endfootaThe fluxes of host galaxy cannot be
derived due to the non-negligible contribution of the candidate to the
total flux.
bNo WISE source is found within the
spatial resolution element of WISE.
cThis excludes the candidate as an optical
counterpart to FRB 151230.
\endlastfootCand-1 AGN Center None Yes Yes Yes No No No No Yes
Cand-2 CCSN/RT Off-center RT and SNe IIP and IIn Yes Yes No No No
Yes, but there are multiple galaxies Yes Yes
Cand-3 RT Off-center None, but reproduced with RTs with a faint peak and rapid decline —a Yes No No No —b —a —a
Cand-4 AGN Center None Yes Yes No No No No No Yes
Cand-5 AGN Center None Yes Noc No No No No No No
Cand-6 CCSN/AGN Center SN IIn Noc Yes No No No —b No Yes
Cand-7 AGN Center None Yes Yes No No No No No Yes
Cand-8 AGN Center None Yes Yes No No No No No Yes
Cand-9 AGN Center None Yes Yes No No No —b No Yes
Cand-10 AGN Center None Yes Yes Yes No No No No Yes
Cand-11 CCSN/AGN Center SN IIn Yes Yes No No No —b No Yes
Cand-12 AGN Center None Yes Yes No No No No No Yes
Cand-13 AGN Center None Yes Yes No No No No No Yes
cccccccc
Templates fitting the light curves of transients outside
the localization area of FRB 151230.
Name (separationa, photometric redshift)
SN Type Numberb Redshift
c
value
Stretchd Colord
\endfirsthead Name (separationa, photometric redshift)
SN Type Numberb Redshift
c
value
Stretchd Colord
\endhead\endfootaSeparation from the center of the
localization area of FRB 151230.
bThe number of templates fitting the
multicolor light curves of candidates.
cColor excess of the host galaxy for the CCSN and RT templates.
dStretch and color parameters for the SN Ia templates.
eThe best-fit template.
\endlastfoot Cand-14 ( arcmin, photo-)
Nugent Ibc normale 16
Cand-15 ( arcmin, photo-)
Hsiao Iae 280
Nugent Ibc bright 102
Nugent Ibc normal 27
Nugent IIL normal 19
Cand-16 ( arcmin, photo-)
Hsiao Iae 18
Nugent IIP 12
Nugent IIL normal 17
Nugent Ibc normal 1
Cand-17 ( arcmin, photo-)
Nugent Ibc brighte 75
Hsiao Ia 14162
Nugent Ibc normal 160
Nugent IIL bright 186
Nugent IIP 45
Cand-18 ( arcmin, )
Hsiao Iae 65
Nugent IIL bright 1
Cand-19 ( arcmin, photo-)
Nugent IIne 5
Cand-20 ( arcmin, )
Hsiao Iae 63
Cand-21 ( arcmin, photo-)
Hsiao Iae 22
Cand-22 ( arcmin, photo-)
Hsiao Iae 274
Cand-23 ( arcmin, )
Nugent Ibc brighte 77
Hsiao Ia 123
Nugent IIL normal 11
Cand-24 ( arcmin, photo-)
Nugent Ibc normale 158
Hsiao Ia 862
Nugent IIP 24
Nugent IIL normal 97
Nugent Ibc bright 2
Cand-25 ( arcmin, photo-)
Nugent IIPe 16
Cand-26 ( arcmin, photo-)
Nugent Ibc normale 3
Cand-27 ( arcmin, photo-)
Nugent Ibc brighte 73
Cand-28 ( arcmin, photo-)
Hsiao Iae 72
PS1-10bjp 4
PS1-10ah 3
Cand-29 ( arcmin, photo-)
Nugent Ibc brighte 20
Hsiao Ia 307
Cand-30 ( arcmin, photo-)
PS1-10ahe 4
Cand-31 ( arcmin, photo-)
Nugent Ibc brighte 15
Nugent IIn 241
Cand-32 ( arcmin, photo-)
Nugent Ibc normale 58
Nugent Ibc bright 151
Nugent IIL normal 57
PS1-12brf 47
ccc
Parameters of templates.
Parameter Range Step
\endfirstheadParameter Range Step
\endhead\endfoot\endlastfoot Type Ia SN
Color
Stretch
Intrinsic variation
Redshift
Type IIP SN
Peak magnitude
Color excess
Redshift
Type IIL normal SN
Peak magnitude
Color excess
Redshift
Type IIL bright SN
Peak magnitude
Color excess
Redshift
Type IIn SN
Peak magnitude
Color excess
Redshift
Type Ibc normal SN
Peak magnitude
Color excess
Redshift
Type Ibc bright SN
Peak magnitude
Color excess
Redshift
Rapid transient (PS1-10ah)
Peak magnitude
Color excess
Redshift
Rapid transient (PS1-10bjp)
Peak magnitude
Color excess
Redshift
Rapid transient (PS1-11qr)
Peak magnitude
Color excess
Redshift
Rapid transient (PS1-12bv)
Peak magnitude
Color excess
Redshift
Rapid transient (PS1-12brf)
Peak magnitude
Color excess
Redshift