Stochastic Chemical Evolution of Galactic Subhalos and the Origin of -process Elements
Abstract
Mergers of compact binaries (of a neutron star and another neutron star or a black hole, NSMs) are suggested to be the promising astrophysical site of the -process. While the average coalescence timescale of NSMs appears to be , most of previous chemical evolution models indicate that the observed early appearance and large dispersion of in Galactic halo stars at favors shorter coalescence times of 1–10 Myr. We argue that this is not the case for the models assuming the formation of the Galactic halo from clustering of subhalos with different star formation histories as suggested by Ishimaru et al. We present a stochastic chemical evolution model of the subhalos, in which the site of the -process is assumed to be mainly NSMs with a coalescence timescale of . In view of the scarcity of NSMs, their occurrence in each subhalo is computed with a Monte Carlo method. Our results show that the less massive subhalos evolve at lower metallicities and generate highly -process-enhanced stars. An assembly of these subhalos leaves behind the large star-to-star scatters of in the Galactic halo as observed. However, the observed scatters of [Sr/Ba] at low metallicities indicate the presence of an additional site that partially contributes to the enrichment of light neutron-capture elements such as Sr. The high enhancements of at low metallicities found in our low-mass subhalo models also qualitatively reproduce the abundance signatures of the stars in the recently discovered ultra-faint dwarf galaxy Reticulum II. Therefore, our results suggest NSMs as the dominant sources of -process elements in the Galactic halo.
1 Introduction
Most of the elements with atomic numbers greater than –40 are produced through neutron-capture processes, and about half of such heavy elements originate from the rapid neutron-capture process (-process). However, the astrophysical site of the -process has not been specified, which remains a long-standing problem in nuclear astrophysics (see, e.g., Thielemann et al. 2017 for a recent review).
Stellar abundances of Galactic halo stars serve as the fossils of the early history of the Galaxy, providing us with important clues to the Galactic formation and early chemical evolution. Metal-poor stars, those with metallicities of 111, where and are the mass fractions of elements and . , are thought to be among the oldest objects in the Galaxy, which presumably have been formed in the first few hundred Myr of its life. Spectroscopic observations of metal-poor halo stars show a large star-to-star scatter of about 2.5 dex in the abundances of Eu (as representative of -process elements) with respect to Fe, (e.g., Honda et al. 2004; François et al. 2007; Suda et al. 2008; Sneden et al. 2008). In particular, several metal-poor stars such as CS 22892-052 (Sneden et al., 2003) and CS 310812-001 (Siqueira Mello et al., 2013) show extremely high ratios of –1.7. These unique abundance signatures indicate that Eu does not share common astrophysical conditions with or iron-group elements.
It is also well known that such -process-enhanced stars, which account for about 10% of all metal-poor stars, exhibit fairly robust abundance distributions that agree with the solar system -process pattern. On the one hand, the excellent agreement for the heavier side (; Sneden et al. 2008) indicates the presence of the single robust “main” -process222Hereafter, we indicate the main -process by the “-process”, which produces all of the -process elements with a solar -process-like pattern but with a smaller content of elements. site. On the other hand, the less remarkable agreement for the lighter side (; Siqueira Mello et al. 2014) as well as the bulk of (-process-deficient) stars showing higher [Sr/Ba] than the solar -process ratio (McWilliam, 1998; Johnson & Bolte, 2002) implies the presence of another “weak” -process that produces only light neutron-capture elements (Wanajo & Ishimaru, 2006). In fact, several metal-poor stars showing a descending trend of neutron-capture elements toward the heavier side have been identified (Honda et al., 2006, 2007; Aoki et al., 2017), which may reflect such a process.
The major candidates suggested as the -process site include core-collapse supernovae (CCSNe; e.g., Burbidge et al. 1957; Hillebrandt et al. 1984; Woosley et al. 1994) and binary mergers of a neutron star and another neutron star or a black hole (NSMs333In this paper, we generally indicate “neutron star–neutron star mergers” by “NSMs”, although similar conclusions may be obtained for neutron star–black hole mergers.; e.g., Lattimer & Schramm 1974; Symbalisty & Schramm 1982; Eichler et al. 1989; Meyer 1989; Freiburghaus et al. 1999; Goriely et al. 2011; Korobkin et al. 2012; Wanajo et al. 2014). Inhomogeneous chemical evolution models (Ishimaru & Wanajo, 1999; Argast et al., 2000; Tsujimoto et al., 2000; Ishimaru et al., 2004; Cescutti, 2008), which account for incomplete mixing of nucleosynthetic ejecta in the interstellar medium (ISM), have demonstrated that the observed dispersion of ratios (where indicates an -process element) in Galactic halo stars can be explained if CCSNe from a limited initial stellar mass range are the sources of -process elements. However, recent nucleosynthesis studies show difficulties in producing heavy -process elements in the physical conditions relevant to CCSNe (Wanajo et al., 2011, 2018; Wanajo, 2013; Bliss et al., 2018), which can be at best the sources of light neutron-capture elements made by a weak -process. Effects of a strong magnetic field also have been discussed (Thompson, 2003; Suzuki & Nagataki, 2005; Winteler et al., 2012; Nishimura et al., 2015), although their roles on the -process are under debate (Nishimura et al., 2017; Thompson & ud-Doula, 2017; Mösta et al., 2017).
By contrast, recent nucleosynthesis calculations based on the hydrodynamical simulations of NSMs reasonably reproduce the solar -process abundance curve (Wanajo et al. 2014; Goriely et al. 2015; Radice et al. 2016; Wu et al. 2016). The discovery of an electromagnetic emission (kilonova; Li & Paczyński, 1998; Metzger et al., 2010) associated with the gravitational-wave source GW170817 (Abbott et al., 2017) also supports NSMs as the site of the -process in the universe. In fact, the inferred amount of the -process material ejected from this event, about 0.03– (e.g., Pian et al., 2017), appears to be sufficient to account for the total mass of -process elements in the Galaxy, provided that GW170817 is representative of NSM events.
However, binary population synthesis models (e.g., Dominik et al. 2012) as well as observations of binary neutron stars (e.g., Beniamini & Piran, 2016) suggest an average NSM coalescence timescale , which appears too long to allow for the observed appearance of, e.g., Eu at metallicities as low as on the basis of one-zone chemical evolution models (Argast et al., 2004). Such models suggest to reproduce the observed early evolution of (Argast et al., 2004; De Donder & Vanbeveren, 2004; Matteucci et al., 2014; Tsujimoto & Shigeyama, 2014; Cescutti et al., 2015; Wehmeyer et al., 2015). Previous chemical evolution models based on the hierarchical structure formation of the Galactic halo also favor short NSM coalescence timescales (Komiya et al. 2014; van de Voort et al. 2015). In addition, it is argued that the inferred low event rate (; Dominik et al. 2012) of NSMs causes too large dispersions at higher metallicity to be compatible with observations (Qian, 2000; Argast et al., 2004).
Chemical evolution studies assuming multiple -process sites such as NSMs and magnetorotationally driven CCSNe attempt to explain the observed evolution of the metal-poor stars (Wehmeyer et al. 2015; Shibagaki et al. 2016). However, the uniqueness of the abundance patterns in -process-enhanced stars apparently disfavors multiple -process sites with different abundance distributions (e.g., Sneden et al., 2008) considered in these studies.
Prantzos (2006) suggested that the observed appearance of Eu at low metallicity as well as the large dispersion of [Eu/Fe] could be naturally explained if the Galactic halo was formed from merging subhalos with different star formation histories and if the production sites of Fe and -process elements evolved on different timescales. Ishimaru et al. (2015, hereafter IWP15) have first explored this idea using a semianalytical model of merging subhalos, each of them evolving on a different timescale—depending on its mass—in a homogeneous way (i.e., the gas is assumed to be well mixed within each subhalo). According to IWP15, NSMs start occurring at the metallicity [Fe/H] and contributing to the enrichment of Eu even with the coalescence timescale of 100 Myr if less massive subhalos evolve with lower star formation efficiency. Similar results can be found in recent semianalytic (Komiya & Shigeyama, 2016) and chemodynamical (Shen et al., 2015; Hirai et al., 2015, 2017) studies (see also Côté et al. 2017 for a comparison of several chemical evolution studies mentioned above with their own model).
IWP15 also show that various star formation efficiencies make a difference in the numbers of cumulative NSMs occurring in subhalos. In fact, the number of cumulative average NSMs for the lightest subhalo with a stellar mass of (similar to that of an ultra-faint dwarf galaxy, UFD) predicted in IWP15 is , implying that only one 1 of 10 small subhalos experiences an NSM event. They suggested that a single NSM occurring in the least massive systems would lead to a very high of the inter stellar medium. The recently discovered UFD, Reticulum II (Ret II; Ji et al., 2016a; Roederer et al., 2016; Ji et al., 2016b; Ji & Frebel, 2018), could be such an example as anticipated by IWP15, in which seven (out of nine) stars exhibited high ratios comparable to those in the most -process-enhanced Galactic halo stars.
In this paper, we extend the study of IWP15 to explain the presence of such -process-enhanced stars and the scatter of ratios in the Galactic halo as well as in Ret II. We also aim to examine the chemical evolution of Sr to test if our model is compatible with those of light neutron-capture elements. For this purpose, we construct a chemical evolution model, in which individual subhalos stochastically experience NSM events. In section 2, the concept and setup of our model are presented in detail. In section 3, we discuss the enrichment histories of Ba and Eu as representative of -process elements. We also compare our results with the observations of a light neutron-capture element Sr (section 4) as well as of the -process-enhanced stars in Ret II (section 5). Finally, we summarize and conclude our work in section 6.
2 Chemical Evolution Model
Based on the hierarchical structure formation scenario, our Galactic halo is formed from subhalos with various masses. Depending on their masses, the subhalos are expected to have different star formation histories, and the sum of the subhalos weighted by their mass function is assumed to become the Galactic halo. Within each subhalo, the occurrence of NSMs is treated stochastically (see Sec. 2.3).
2.1 Chemical Evolution of Different Mass Subhalos
The star formation rate of a subhalo , , is assumed to be proportional to its interstellar medium (ISM) mass, ,
| (1) |
where is a time-independent star formation efficiency. All subhalos are expected to suffer gas outflow because of their weak gravitational binding (as a result of, e.g., gas heating, ram pressure, and tidal stripping) in which the interstellar material is efficiently mixed (i.e., spatially homogeneous). The gas outflow rate , , is assumed to be proportional to the ,
| (2) |
where is a time-independent coefficient. We introduce a time-independent outflow efficiency, ; i.e., .
For the stellar initial mass function (IMF), we adopt Kroupa’s IMF (Kroupa, 2002) within the mass range of 0.05– and the slope of is taken for the range of 1– (see also Kubryk et al., 2015). Massive stars of 10– are the progenitors of CCSNe in this study.
Although it is nearly impossible to directly observe ancient subhalos nowadays, they might be very close in nature to the local dwarf spheroidal galaxies that we observe now. The observed mass-metallicity relation of those galaxies by Kirby et al. (2013) shows a clear correlation between the stellar masses and the mean metallicities of the local dwarf galaxies, regardless of their morphologies. Therefore, we assume that subhalos also have the same correlation. This mass-metallicity relation scales as within the mass range , where and are the mean metallicity and the stellar mass of a dwarf galaxy, respectively. Here, we assume that the mean metallicity is equal to the peak of a given metallicity distribution. This leads to (Prantzos 2008; IWP15). Thus, we adopt
| (3) |
where is the stellar mass of a subhalo and corresponds to the value for a subhalo with the mass , which is one of the most massive subhalos assumed in our model. The values and are chosen so that the subhalos with the final stellar mass have a metallicity reaching at the final time , which is realized with and ; i.e., . Since Galactic halo stars show no trace of type Ia supernovae, we do not include their contribution to Fe yields in our model.
For each value of , we consider two extreme cases in order to determine and (as in Table 1 in IWP15). For case 1, is assumed to be constant at while . On the other hand, for case 2, is assumed to be constant, , while . The is then obtained as a function of time and the stellar mass of a subhalo.
Element yields of CCSN are taken from Nomoto et al. (2013) with a linear interpolation between 10 and and those at in the range 40–. We do not consider the enrichment from the -process, because the s-component of the heavy elements stems mainly from the AGB phase of low-mass stars and is not expected to contribute to metal-poor stars. Since we focus mainly on metal-poor stars, we also treat (an -process-dominant element in the solar system) as an -process element, a concept that was first suggested by Truran (1981) ; see, however, Prantzos et al. (2018) for the case of rotating massive stars, which may have a non-negligible contribution to -element production even at low metallicities.
The ISM is assumed to be well mixed; thus, enrichment by CCSNe is calculated in a continuous way by a simple chemical evolution model with gas outflow. Enrichment of -process elements is computed in a stochastic way only when NSMs occur.
2.2 Subhalo Mass Distribution
Cosmological simulations based on the hierarchical structure formation scenario predict the dark matter function of subhalos, which is proportional to the inverse square of the subhalo dark mass (Diemand et al., 2007), i.e., proportional to the inverse square of the baryonic mass. Taking into account the effective yield from the mass-metallicity relation, which suggests outflow, the final stellar mass is smaller than the initial baryonic mass. As a result, the subhalo stellar mass function becomes / (Prantzos 2008; IWP15).
We consider the subhalos with stellar masses ranging from to . The lowest subhalo mass that we consider is comparable to the smallest local dwarf galaxies (Kirby et al., 2013)444Note that the observed lowest stellar mass of the local dwarf galaxies from Kirby et al. (2013) is of the order of (Segue 2); however, we set the lowest mass of subhalos be that of intermediate-mass ultra-faint dwarfs, , because the mass-metallicity relation scales well in the range (Figure 9 in Kirby et al., 2013).. The highest mass is set to half of the mass of the Galactic halo, (Bell et al., 2008). The subhalo stellar mass function is normalized as follows:
| (4) |
By definition, the total number of subhalos within the mass range between and is given by
| (5) |
The third column of Table 1 shows the numbers of subhalos between and (first and second columns, respectively) according to Equation (5). Note that is the same for both cases 1 and 2.
| (mean) | (min.) | (max.) | |||||
|---|---|---|---|---|---|---|---|
2.3 Enrichment by NSMs
The suggested typical coalescence timescale of NSM in the literature is (e.g., Belczynski et al. 2008; Dominik et al. 2012). Although these studies also predict short-lived mergers (), the fraction of such binaries is estimated to be less than several percent (Dominik et al., 2012). In our model, we adopt the bimodal NSM coalescence timescales from IWP15, where the proportions of long-lived (100 Myr) and short-lived (1 Myr) NSMs are set to and , respectively. The average frequency of NSM to CCSN is assumed to be according to the population synthesis model by Dominik et al. (2012).
The number of CCSN events occurring within a given time interval is
| (6) | |||||
where is the lifetime of the star with initial mass adopted from Schaller et al. (1992). The number of NSM events occurring within the time interval is then
| (7) |
where is the NSM coalescence timescale. Equations (6) and (7) account for the average numbers of CCSNe and NSMs, respectively, occurring in a subhalo with mass in the corresponding time interval.
In our model, we first calculate the average number of NSMs occurring in each time interval (taken to be a few percent of ) for a subhalo of . The total average number of NSMs occurring in a group of subhalos with masses between and is then obtained as in the corresponding time interval. Using a Monte Carlo method, we randomly choose the subhalos in which NSMs occurred. In Table 1 the resulting average, minimum, and maximum numbers of NSMs (for case 1) in the subhalos of masses between and after 2 Gyr are presented in the 4th, 5th, and 6th columns, respectively.
The yield of Eu ejected by a single NSM event is assumed to be so that the observed average [Eu/Fe] values are reproduced (Figures 4). This value is about a factor of 2 greater than that obtained by the nucleosynthesis calculation in Wanajo et al. (2014), , which is, however, dependent on the still uncertain total ejecta mass from an NSM (e.g., Shibata et al., 2017). Besides , we also calculate the chemical evolution of as well, its yield being , which matches the solar -process abundance ratio (Burris et al., 2000). The parameters concerning NSMs are summarized in Table 2555 Our parameter settings give the number of NSMs and iron mass per stellar mass, which are IMF-averaged over the entire mass range 0.05–, of and , respectively. These values are within the range of those from other recent chemical evolution models (Figure. 1 in Côté et al. (2017). The normalized number of NSMs per stellar mass according to Eq. (1) in Côté et al. (2017) is , which also falls within the range of other models (their Figure 5)..
| Type | Prop. | ||||
|---|---|---|---|---|---|
| () | |||||
| Short-lived | |||||
| Long-lived |
3 Chemical evolution of -process elements
3.1 Chemical Evolution of individual Subhalos
In Figure 1, we present the chemical evolutions of five selected subhalos with different stellar masses for case 1 (see Sec. 2.1). Their stellar masses are , , , , and corresponding to those from the thinnest to thickest curves in different colors.
Figure 1a shows the age-metallicity relations of the five subhalos. The yields are those produced by CCSNe. Since CCSNe occur constantly and sufficiently even for low-mass subhalos (see IWP15), in each subhalo increases monotonically with time. For case 1, the star formation efficiency is a function of the subhalo mass, in which heavier subhalos have higher values. Therefore, a heavier subhalo shows a higher increasing rate of metallicity. Regarding case 2 (not shown here), is constant regardless of the subhalo mass and hence the age-metallicity relations are the same for all subhalo models. These results are consistent with IWP15.

Figure 1b shows the cumulative number of NSMs computed stochastically, which occur in each subhalo. In the subhalos with masses above , the first NSM occurs at –. This is a consequence of the fact that these subhalos contain a large enough number of massive stars for triggering even rare (short-lived) NSMs. After , the cumulative quickly increases owing to the long-lived NSMs. For the heaviest subhalo, the cumulative increases smoothly unlike the others because the NSM occurrence rate is high. For the subhalos with masses below , the numbers of stars are too small to experience short-lived NSMs. The NSMs occurring at – are due to the long-lived NSMs. In any case, NSMs do not necessarily occur at because of the stochastic nature. The probabilistic effects appear more clearly in the subhalos with lower masses. The total number of that occur in these subhalos with masses of and are only 3 and 1, respectively.
Figure 1c shows the time evolutions of in the five subhalos. We compare our results for these subhalos with the average evolutions that are calculated from the one-zone models (the same as those in IWP15). When the first NSM occurs in each subhalo, becomes greater than the average value. stays constant when no NSM occurs. The enhancement is stronger for a lower-mass subhalo , because a lower mass of ISM leads to a greater ratio of to gas and hence a larger .
Figure 1d shows the time evolutions of , which are the combinations of those in Figures 1a and c. The amount of Ba is enhanced by NSMs. When no NSM occurs, the Ba abundance remains constant. However, CCSNe occur continuously, and the amount of Fe increases. As a result, shows a monotonic decline until the next NSM event.
3.2 vs. in Subhalos
Figure 2 shows the chemical evolutions of in subhalos for case 1. The subhalos are grouped according to the mass ranges (a) –, (b) –, (c) –, and (d) –. Each panel consists of several subhalos plotted together. A subhalo that experiences no NSM does not appear in the figure because there is no -process enrichment. Therefore, Figure 2a shows only 48 out of 741 subhalos; Figure 2b shows 79 out of 147 subhalos; and Figures 2cd show all subhalos with the corresponding masses. In Table 3, we summarize the numbers of -process-enriched subhalos that appear in the figures.
| Panel | Mass Range | |||
|---|---|---|---|---|
| () | Case 1 | Case 2 | ||
| (a) | – | |||
| (b) | – | |||
| (c) | – | |||
| (d) | – |
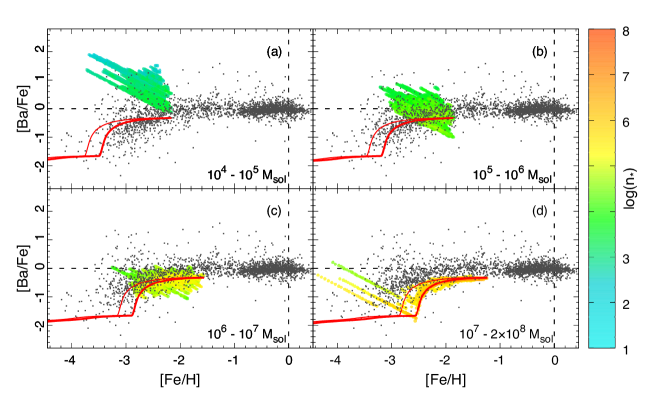
The thin and thick (red) curves in each panel of Figure 2 represent the average values of abundance ratios for the subhalos with the lowest and highest masses, respectively (the same as the models in IWP15). In the beginning, is produced only by the rare short-lived NSMs and hence remains almost constant regardless of . When the more numerous long-lived NSMs start contributing, begins to increase. The distributions of calculated stochastically deviate from these average evolutionary curves. As already mentioned, not all subhalos experience NSMs, in particular for the low-mass groups (Figures 2ab). For example, only 48 out of 741 subhalos with the masses – experience NSMs. Thus, most of the subhalos do not appear in the figure. On the other hand, the rest of the subhalos appear, showing very high values. For massive subhalos (), most of the stars are concentrated near the average curves (Figure 2cd). Note that all of these massive subhalos have experienced NSMs.

In general, once a single NSM occurs in a given subhalo, the evolution of begins with a high value that decreases monotonically with increasing metallicity until the next NSM event, as discussed in section 3.1. As clearly seen in the average abundance ratios, the long-lived NSMs occur at lower metallicities for less massive subhalos. The stars in lower-mass subhalos have lower metallicities on average. Massive subhalos also have stars at low metallicities, but their -process elements () originate from the short-lived NSMs.
Figure 3 shows the chemical evolutions of for case 2. The enhancements of in the average values start at for all subhalos, regardless of their masses. The stochastically calculated models also show enhancements from similar metallicities. Enhancements are also visible at lower metallicities, but the number of such subhalos is small, which are polluted by the rare short-lived NSMs. At , the values are rather high for low-mass subhalos (Figures 3ab). This is due to the small ISM masses at late times of their evolutions by strong gas outflow (section 2.1).
3.3 Clustering of Subhalos
According to the hierarchical structure formation scenario, our Galactic halo has been formed from the clustering of subhalos (e.g., Prantzos, 2008). In this context, one can examine the chemical evolution of the Galactic halo as the ensemble of the subhalos discussed in section 3.2.
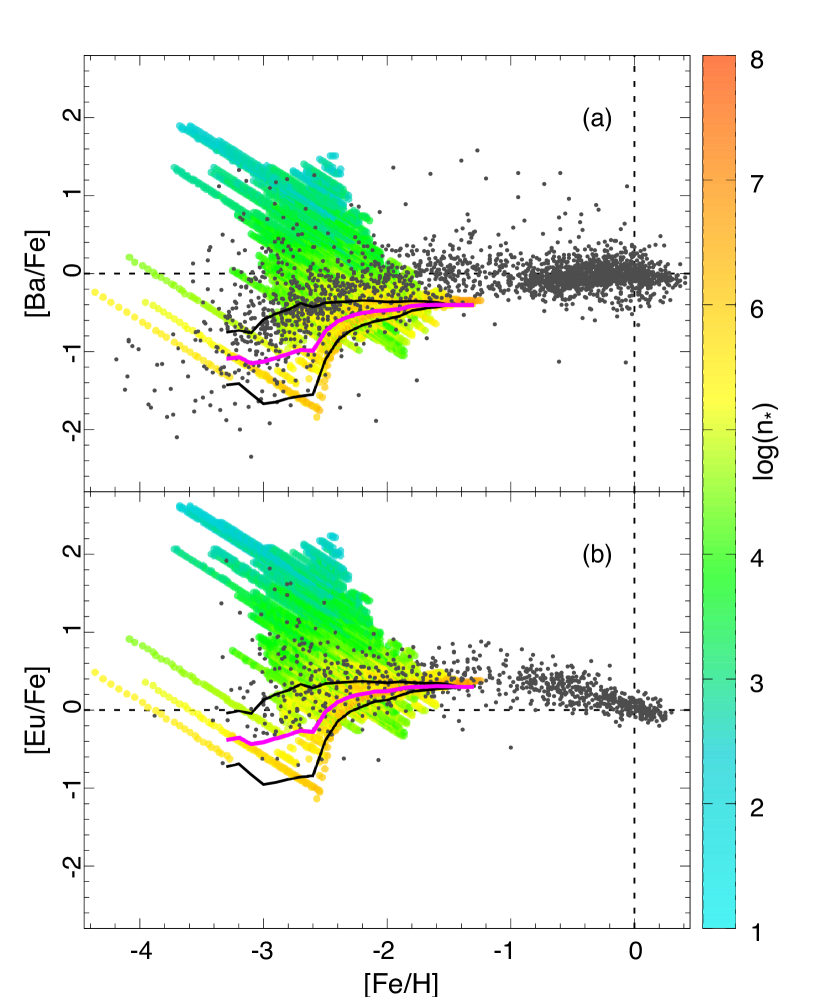
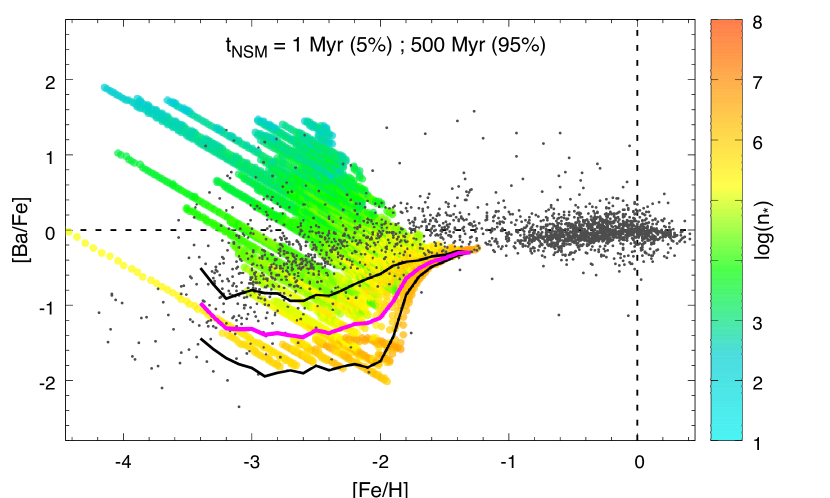
Figure 4 shows the chemical evolutions of and relative to in the Galactic halo as functions of , as the ensemble of all subhalos for case 1. Both [Ba/Fe] and [Eu/Fe] show large star-to-star dispersions of at , which converge with increasing metallicity. The mean value (taken in each 0.1 dex bin of [Fe/H]; magenta) of the abundance ratios increases with metallicity. The standard deviation (black) from the mean value is maximal at , in which the spread appears consistent with the observed dispersion of stars. All of these aspects are in good agreement with the observed trends of the Galactic halo stars ([Fe/H]). Note that the mean value of becomes smaller than that of the stellar abundance ratios at because we do not consider the contributions from the -process (e.g., Prantzos et al., 2018).
By comparing Figures 2 and 4a, it is clear that the highly -process-enhanced stars in the Galactic halo originate from the low-mass subhalos . On the other hand, the Galactic halo stars with subsolar values mostly come from the heavier subhalos with masses greater than . The presence of such a large dispersion in at [Fe/H] cannot be reproduced by the evolutions of averaged abundance ratios (red lines in Figure 2; the same as the models in IWP15), which is obviously due to a stochastic nature of NSM events in subhalos. However, the large standard deviation between [Fe/H] and (Figure 4) is mainly due to the mass-dependent star formation efficiency for case 1, , not to the stochastic occurrences of NSMs. As shown in IWP15, the subhalos evolve at different rates, reaching different metallicities at a given time (or the same metallicity at different times, thus with different NSM rates). As a consequence, the stars of a given [Ba/Fe] are distributed in different metallicity regions when all subhalos are displayed (see the red lines in Figure 2).
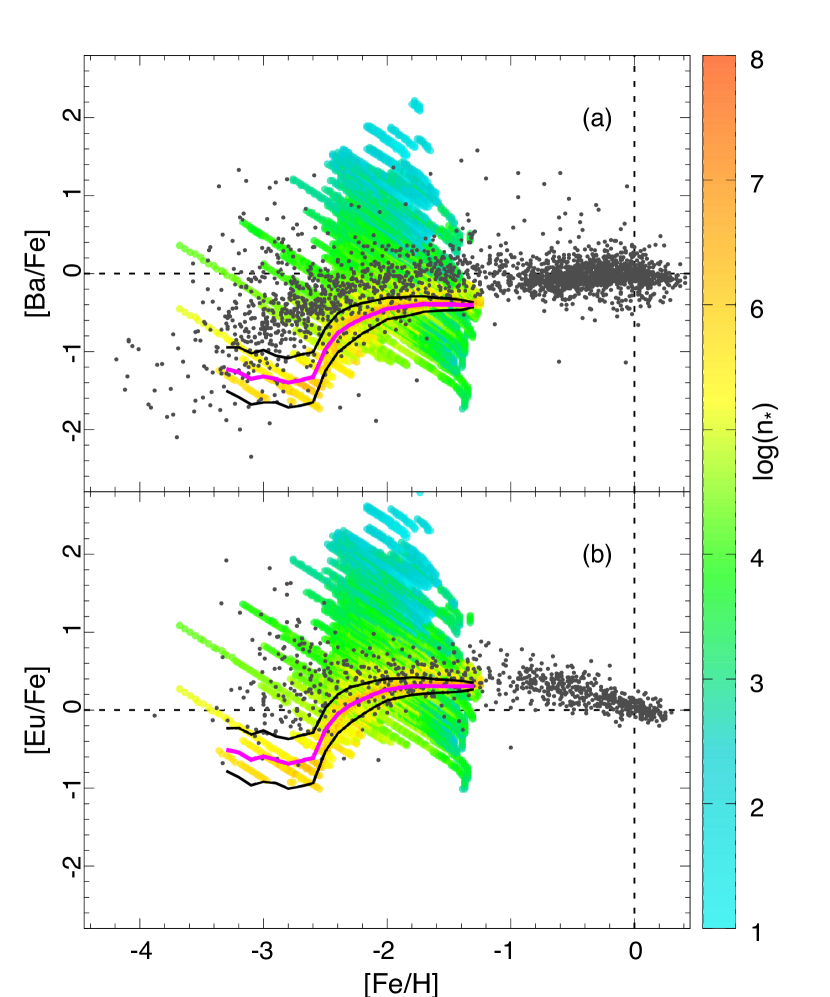
Figure 5 shows the results for case 2. The calculated stellar values with large star-to-star scatters appear at the metallicity , which is substantially higher than in the observations. The mean value of our result shows a sudden increase at [Fe/H]; however, the observed values gradually increase from to . Unlike case 1, the standard deviation overall is small despite its large star-to-star scatter. The reason is the constant star formation efficiency for case 2, , which keeps all subhalos on the same evolutionary path of (see the red lines in Figure 3), resulting in a small standard deviation.
We find that our model of case 1 is successful in explaining the observational aspects of the -process abundances in Galactic halo stars: the large dispersion with highly -process-enhanced stars at and the mean value of , which gradually increases with metallicity from . Therefore, the model of subhalos with appears suitable to describe the chemical evolution of the Galactic halo, and thus we focus on case 1 in the subsequent discussion.
3.4 NSM Coalescence Timescales
In the previous subsections, the NSM coalescence timescale was assumed as for of the NSMs and for the rest. In this subsection, we test other choices of .
In order to examine the case of little contribution from the short-lived NSMs, we first calculate a model using only the long , that is, for all NSMs. Figure 6 shows the calculated evolution in the Galactic halo for case 1. The Galactic halo has the metal-poor stars with subsolar values at metallicities less than , which cannot be explained solely with in our model.
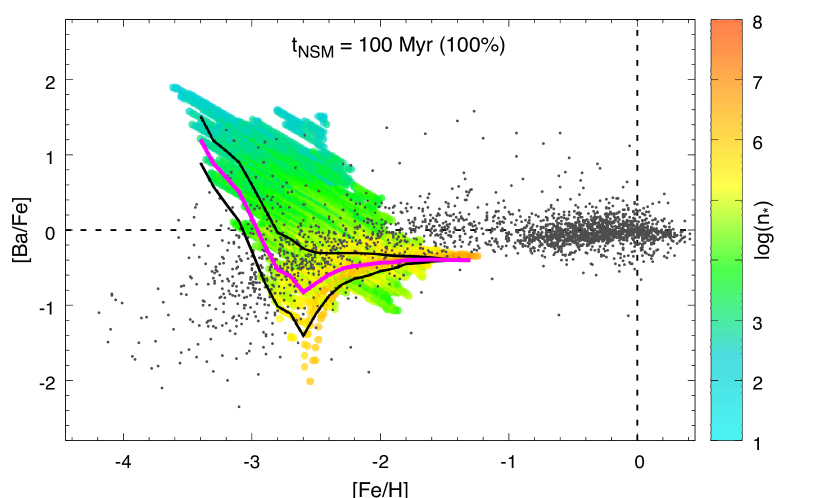
Since population synthesis studies as well as the observation of binary neutron stars infer the NSM coalescence timescales , we next test the case of a longer . Figure 7 shows the calculated evolution in the Galactic halo, where the coalescence timescale of the long-lived NSM is set to for of the NSMs and the rest with . The increase of due to the long-lived NSMs starts at higher metallicity and overproduces stars with . Also, the star-to-star scatter becomes largest at , whereas observations show its large dispersion at . This implies that a coalescence timescale appreciably greater than 100 Myr cannot represent the majority of NSMs.
3.5 vs.
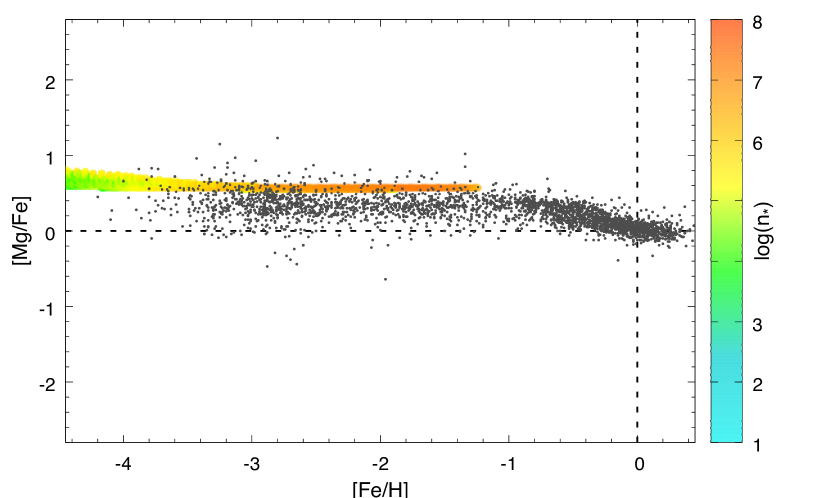
The abundance ratios of -process elements in the metal-poor halo stars show large dispersions. In contrast, the abundance ratios of -elements such as Mg show a small spread of (see the gray dots in Figure 8). Moreover, a well-selected homogeneous sample shows little intrinsic scatter in [Mg/Fe] at low metallicity (within a total range of 0.2 dex with a standard deviation of 0.06 dex for 23 stars; Arnone et al., 2005). appears uniform throughout the whole metallicity range until type Ia supernovae start to increase the abundance after . This contradicts the inhomogeneous chemical evolution models with inefficient ISM mixing, in which the variation of Mg/Fe in CCSNe yields remains at low metallicity (see, e.g., Argast et al., 2002). Recent hydrodynamical studies show that the implementation of substantial ISM mixing is fundamental to reproduce the observed little scatter in [Mg/Fe] (e.g., Shen et al., 2015; Hirai & Saitoh, 2017). Each of the one-zone homogeneous subhalos in our model can be regarded as a limiting case of such efficient ISM mixing. In this subsection, we test whether our model is also consistent with the observed behavior of -elements such as .
The calculated abundance evolution relative to as a function of for all subhalos is shown in Figure 8. Results show very small star-to-star scatters of for , being in agreement with the observational trend. The higher [Mg/Fe] values than the mean of the measured values () reflect the CCSN yields adopted in this study. Every subhalo is assumed to have a well-mixed ISM, meaning that the elements made by CCSNe from all the progenitor mass range are mixed uniformly. Therefore, every subhalo shows similar values over a wide range of metallicities. The resulting abundance ratios in the Galactic halo as an ensemble of these subhalos display little dispersion.
4 Chemical evolution of Sr
Sr is one of the light trans-iron elements666Light trans-iron elements from Zn () to Zr (), including Sr, are not necessarily made by neutron capture but in nuclear equilibrium in the neutron-rich ejecta of CCSNe (Wanajo et al., 2011, 2018)., showing a large dispersion of in the metal-poor stars of the Galactic halo (see observational data in Figure 10) similar to Ba and Eu. However, the light-to-heavy abundance ratios also show a dispersion with a large number of stars having values greater than the solar ratio (see the observational data in Figure 11). Such a trend cannot be explained from a single -process site that produces both Sr and Ba with the solar -process ratio. This fact implies the presence of a “weak” -process (Wanajo & Ishimaru, 2006) that makes Sr but little Ba, in addition to the “main” -process. HD 122563 is such a star with the signature of a possible weak -process (Honda et al., 2006), exhibiting a descending trend of abundances toward heavier neutron-capture elements (see also Aoki et al. 2017).
In this section, we examine our model (case 1) for the evolution of by taking into account the contributions from both the main and weak -processes. The assumed site of the main -process is NSMs as in the previous sections. Note that such a modification of our model does not affect the evolutions of Ba or Eu in section 3. For the weak -process we assume the stars with – , at the low-mass end of CCSN range, which are suggested as the primary sources of light trans-iron elements including Sr (Wanajo et al., 2011, 2018). The solar -process abundance of by mass is times greater than that of . Thus, we define and , the yields of from the main and weak -processes, respectively, which satisfy
| (8) |
where is the number of CCSNe from the range – . Observations show that the highly -process-enhanced stars such as CS 22892-052 and CS 31082-001 have somewhat smaller light-to-heavy -process abundance ratios than that of the solar -process abundances (Sneden et al. 2008; Siqueira Mello et al. 2014; see also Ji & Frebel 2018 for the stars in Ret II). For simplicity, we assume that half of the abundances come from the main -process and the other half from the weak -process, i.e.,
| (9) |
The yields of from the main and weak -processes are thus derived from Equations (8) and (9). The parameters related to yields are summarized in Table 4.
| Site | Progenitor Mass Range | Yield |
|---|---|---|
| () | () | |
| CCSN (weak ) | – | |
| NSM (main ) | – |
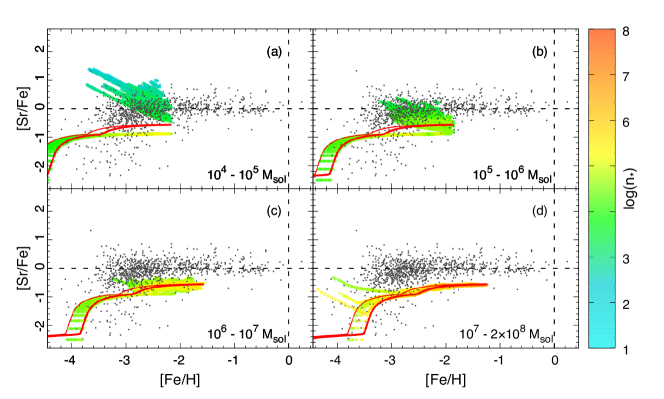
We present the chemical evolutions of relative to as functions of (case 1) for different mass subhalos in Figure 9. The average enhancement of occurs first by the short-lived NSMs up to along with an increase of metallicity to [Fe/H] . Afterward, the weak -process increases the abundance ratio up to [Sr/Fe], followed by the enrichment due to the long-lived NSMs. The weak -process (low-mass CCSNe) is responsible for the enrichment of the stars with , whereas the higher stars are entirely due to the main -process (NSMs). As discussed in sections 3.1 and 3.2, NSMs highly enhance the values, especially in a fraction of low-mass subhalos. In contrast to NSMs, low-mass CCSNe occur uniformly in all subhalos, making no star-to-star scatters or large enhancements of .
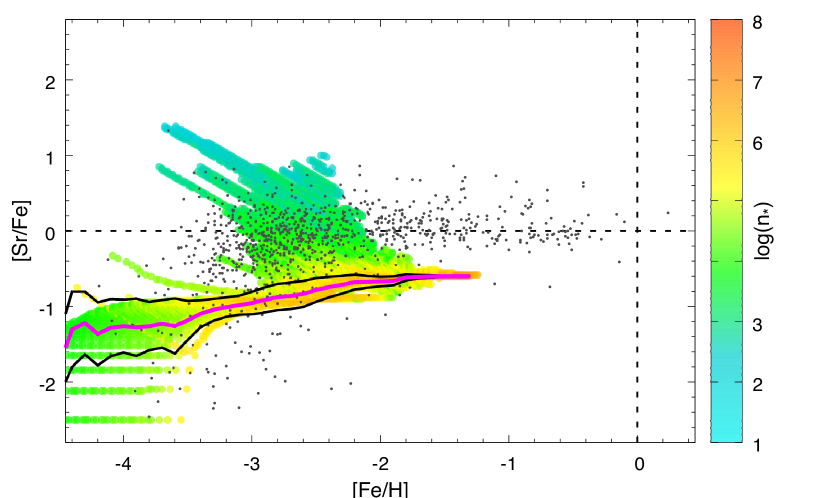
The chemical evolution of Sr as an ensemble of all subhalos is shown in Figure 10, which is compared with the abundances of Galactic halo stars. The observed trend of such as the large star-to-star scatter at with highly enhanced stars at is well reproduced as those of Ba and Eu discussed in section 3. The mean calculated value of [Sr/Fe] at [Fe/H] is lower than the solar value because we exclude the contributions from the -process.
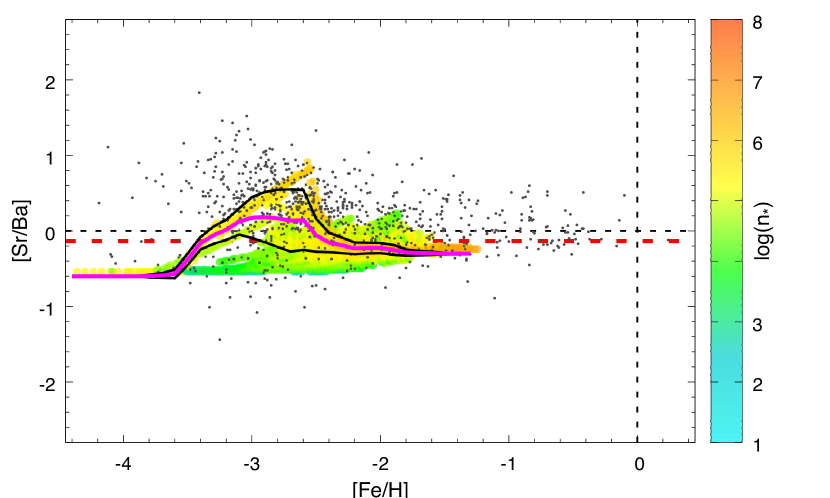
We also present the evolution of in Figure 11. As found in the evolution of , the average enhancement of to a constant value of occurs first by the short-lived NSMs. The rise of at with a large dispersion is due to the production of (without Ba) by the weak -process in low-mass CCSNe. Afterwards, the long-lived NSMs start producing both Sr and , which leads to a convergence of [Sr/Ba] values at [Fe/H] . Note that the value is constant at with our adopted yields for NSMs, meaning the higher values are purely due to the weak -process. We also find an overall agreement of our model with the observed trend of [Sr/Ba], that is, the large star-to-star scatter of the abundances at [Fe/H] with few stars below [Sr/Ba]. It is emphasized that the reasonable agreement here is due to the additional sources of Sr, low-mass CCSNe in our model, in addition to NSMs.
5 Chemical evolution of Ultra-Faint Dwarf Galaxies
Ultra-faint dwarfs (UFDs) are small galaxies in mass and size with low luminosities. Their faintness makes their discovery as well as their spectroscopic study difficult. Up to date, about 10 UFDs have been discovered around our Galaxy. They are metal-poor (e.g., Kirby et al. 2013), mostly showing very low (e.g., François et al. 2007; Koch et al. 2013; Frebel et al. 2014; François et al. 2016). However, one of the UFDs, Reticulum II (Ret II), has highly -process-enhanced stars (Ji et al., 2016a; Roederer et al., 2016; Ji et al., 2016b; Ji & Frebel, 2018). The fact that Ret II is one such peculiar galaxy out of about 10 UFDs is reminiscent of our result for low-mass subhalos discussed in section 3. This similarity motivates us to explore the chemical evolutions of UFDs by adopting our models of low-mass subhalos. In this subsection, we apply our subhalo model to the chemical evolution of Ret II.
As discussed in section 3.1 and 3.2, the relative abundance ratio in a low-mass subhalo sizably deviates from the average evolutionary curve. This is due to the small number of NSMs occurring in each subhalo. As a result, the value of maximum divided by the mean for a given mass range (see Table 1) is greater for lower-mass subhalos.
The stellar mass in a typical UFD galaxy is – . Provided that UFDs evolve the same as subhalos, we consider the lowest-mass range in our model (case 1), – , in which only 5 out of subhalos experience (only single) NSMs (Table 5).
| Model | at | fraction of | |
|---|---|---|---|
| Enhancement | Enriched Stars | ||
| SH1 | |||
| SH2 | |||
| SH3 | |||
| SH4 | |||
| SH5 |
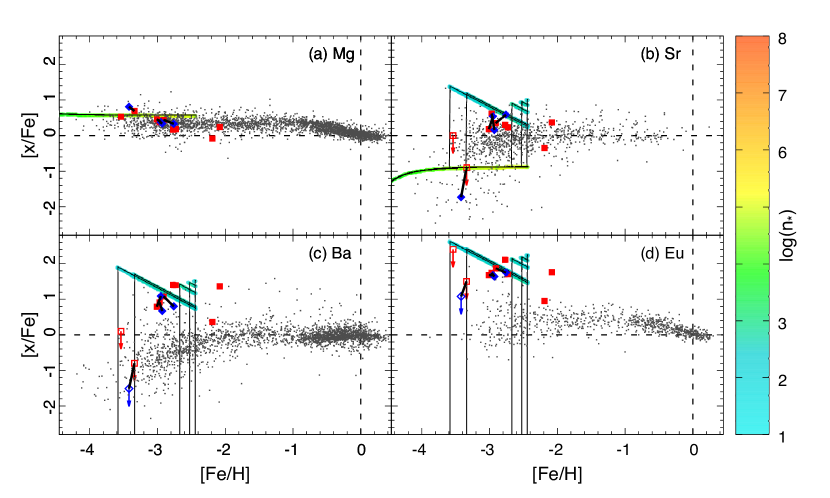
In Figure 12 we compare the chemical evolutions of these subhalos with the spectroscopic data of Ret II stars. Each band made by successive colored circles represents the evolution of a single galaxy, which is guided by a thin line. For Mg (Figure 12a), the evolutions of all 138 galaxies are overlapped because of their common origins for Mg and Fe, i.e., CCSNe, and cannot be distinguished. For Sr (Figure 12b), the early evolutions at [Fe/H] are due to the weak -process from low-mass CCSNe and thus are overlapped as well. However, at [Fe/H], five UFD models (see the first column in Table 5) exhibit the jumps of values at various metallicities owing to single NSM events. For Ba and Eu (Figures 12cd), only five UFD models appear as a result of NSMs.
We find that model SH2 that starts the enrichment of -process elements at [Fe/H] qualitatively captures the evolutionary trend of Ret II, namely, the small dispersion of [Mg/Fe] as well as the enrichment of Sr, Ba, and Eu for the seven stars at [Fe/H] (and the low-level abundances or upper limits for the other two stars at [Fe/H]). In model SH 2 the -process-deficient and -process-enhanced stars are formed before and after the (single) NSM event, respectively. The fraction of -process-enhanced stars in model SH2 is 0.750 (the fourth column in Table 5), which is in good agreement with that in Ret II (). However, the models considered here reach the end of evolution at [Fe/H] and thus do not account for the presence of two stars at [Fe/H] and .
Given that the evolutions of UFD galaxies are represented by our models of the lowest-mass subhalos, the fact that 5 out of subhalos experience NSMs implies a chance of several percent to discover Ret II-like galaxies with respect to all observed UFDs. Our result also suggests that UFDs with various fractions of -process-enhanced stars will be discovered in future observations, e.g., 2 out of 10 stars with the enrichment of -process elements (model SH3; see the fourth column in Table 5).
One should keep in mind, however, that a trial here is for a qualitative purposes only. The least massive subhalo in our model has , which corresponds to intermediate-mass UFDs. It is currently unclear if the scaling of the mass-metallicity relation extends to for the majority of UFDs (Kirby et al., 2013). It also is unknown if the chemical evolution of such a low-mass system, probably with only a few episodes of star formation, can be approximated with our simple picture of a homogeneous and continuous chemical evolution.
6 Summary and Conclusion
We have revisited the study of Galactic chemical evolution by IWP15 in order to investigate the role of NSMs as the dominant sources of -process elements in the Galaxy. Our chemical evolution model was constructed on the basis of the hierarchical structure formation scenario in IWP15, in which the different mass () subhalos that formed the Galactic halo had different star formation histories. The number of NSMs occurring in each subhalo was obtained with the Monte Carlo method. The star formation histories of the subhalos were determined from the observed mass-metallicity relation of the local dwarf galaxies, assuming the same correlation for both systems. In the framework of our simple model of galactic chemical evolution, this mass-metallicity relation leads to , where and SFR are the outflow rate and the star formation rate, respectively. We examined two extreme cases as in IWP15, in which either of the coefficients for SFR and OFR (Equations (1) and (2)) were kept constant such that and for case 1 or and for case 2.
Our result shows that the observed properties of the enrichment histories of in the Galactic halo can be explained by assuming that NSMs are the sources of -process elements. The adopted low SFR in low-mass subhalos for case 1 makes the occurrence of NSMs at low metallicities ([Fe/H]) possible as shown by IWP15. In addition, the presence of the -process-enhanced metal-poor stars in the Galactic halo is accounted for as a result of the large enhancement of by a single or a few NSMs in a small fraction of low-mass subhalos. However, our case 2 adopting a constant star formation efficiency () results in the enrichment of -process elements at higher metallicities, [Fe/H], as found in previous studies. We conclude, therefore, that the reality is closer to our case 1, i.e., star formation is less efficient in lower-mass subhalos while gas outflow only weakly depends on the subhalo masses, provided that NSMs are the dominant contributors of -process elements in the Galaxy.
The observed trend of in the Galactic halo can be mostly reproduced solely by long-lived NSMs with a coalescence timescale of . However, a small fraction of short-lived (1 Myr in our model) NSMs appear to be necessary, which are responsible for explaining the presence of stars with subsolar values at [Fe/H]. A test shows that a long coalescence timescale appreciably greater than 100 Myr, such as , has difficulty in reproducing the enhancement of -process elements at low metallicities. This implies either that in reality the distribution of coalescence timescales (for the long-lived NSMs) has a sharp peak at Myr or the NSMs with longer timescales escape from subhalos because of neutron star kicks and do not contribute to Galactic chemical evolution (Beniamini et al., 2016; Safarzadeh & Scannapieco, 2017). In the future, localizations of NSMs in galaxies by identification of electromagnetic counterparts (kilonovae) of gravitational waves will provide us with information on the distribution of coalescence timescales.
It is important to note that our model naturally reproduces a large dispersion of abundance ratios (relative to Fe) for -process elements, but a small one for intermediate-mass elements such as Mg; the latter are produced by the same sources and on the same timescales as Fe, while the former result from different sources, operating on very different timescales. This feature, which is in good agreement with spectroscopic results, is another important aspect of NSMs as sources of -process elements.
Our model is also successful in explaining the spectroscopic abundances of light neutron-capture elements such as when assuming an additional contribution (a weak -process) from low-mass CCSNe. The resulting evolution of as a function of metallicity reasonably reproduces the observed star-to-star scatters with higher [Sr/Ba] values than those predicted solely by the enrichment from NSMs. This supports the idea that there are extra sources (weak -process) of light neutron-capture elements in addition to the (main) -process.
Finally, our models of the least massive subhalos with well account for the observed nature of UFDs, namely, only 1 (Ret II) out of about 10 such galaxies shows enhancement of -process elements. Moreover, the fact that seven out of observed nine stars in Ret II show enrichment of -process elements can be reasonably reproduced by such a lowest-mass subhalo model. This supports the idea that the UFDs are the leftovers of the building blocks that made the Galaxy. Our models also predict the presence of Ret II-like UFDs with various fractions of -process-enhanced stars. This will be tested by future spectroscopic explorations of UFD galaxies. However, it is currently unclear if the mass-metallicity relation can be applied to the bulk of UFDs. It also is cautioned that we applied our homogeneous and continuous chemical evolution model to such a small system that probably had only a few episodes of star formation. Obviously, further studies of UFDs will be necessary from both observational and theoretical sides.
It should be noted that our study neglected a spatial inhomogeneity of ISM in each subhalo as well as a merging process of subhalos during the evolutionary time of the Galactic halo (2 Gyr). The contribution of -process elements also was excluded, which could be important for the evolutions of Ba and Sr at [Fe/H] . Nevertheless, our simplified approach enabled us to disentangle the different sources of dispersion: the subhalo-mass-dependent SFRs that lead to a spread in [Fe/H] for the same [/Fe] (as shown by IWP15) and the stochastic NSM events that lead to a spread in [/Fe] for the same [Fe/H]. However, our models failed to explain the moderate dispersion of the observed [/Fe] ratios at [Fe/H] (Figure 4), which may be due to the combined effects of ISM inhomogeneity and -process contribution. Such effects will be explored in our forthcoming paper.
References
- Abbott et al. (2017) Abbott, B. P., Abbott, R., Abbott, T. D., et al. 2017, PhRvL, 119, 161101
- Aoki et al. (2017) Aoki, M., Ishimaru, Y., Aoki, W., & Wanajo, S. 2017, ApJ, 837, 8
- Argast et al. (2000) Argast, D., Samland, M., Gerhard, O. E., & Thielemann, F.-K. 2000, A&A, 356, 873
- Argast et al. (2002) Argast, D., Samland, M., Thielemann, F.-K., & Gerhard, O. E. 2002, A&A, 388, 842
- Argast et al. (2004) Argast, D., Samland, M., Thielemann, F.-K., & Qian, Y.-Z. 2004, A&A, 416, 997
- Arnone et al. (2005) Arnone, E., Ryan, S. G., Argast, D., Norris, J. E., & Beers, T. C. 2005, A&A, 430, 507
- Belczynski et al. (2008) Belczynski, K., Kalogera, V., Rasio, F. A., Taam, R. E., et al. 2008, ApJS, 174, 223
- Bell et al. (2008) Bell, E., Zuker, D., Belokurov, V., et al. 2008, ApJ, 680, 295
- Beniamini & Piran (2016) Beniamini, P. & Piran, T. 2016, MNRAS, 456, 4089
- Beniamini et al. (2016) Beniamini, P., Hotokezaka, K., & Piran, T. 2016, ApJL, 829, L13
- Bliss et al. (2018) Bliss, J., Witt, M., Arcones, A., Montes, F., & Pereira, J. 2018, ApJ, 855, 135
- Burbidge et al. (1957) Burbidge, E. M., Burbidge, G. R., Fowler, W. A., & Hoyle, F. 1957, RevModPhys, 29, 547
- Burris et al. (2000) Burris, D. L., Pilachowski, C. A., Armandroff, T. E., et al. 2000, ApJ, 544, 302
- Cescutti (2008) Cescutti, G. 2008, A&A, 481, 691
- Cescutti et al. (2015) Cescutti, G., Romano, D., Matteucci, F., Chiappini, C., & Hirschi, R. 2015, A&A, 577, A139
- Côté et al. (2017) Côté, B., Belczynski, K., Fryer, C., et al. 2017, ApJ, 836, 230
- De Donder & Vanbeveren (2004) De Donder, E., & Vanbeveren, D. 2004, NewAR, 48, 861
- Diemand et al. (2007) Diemand, J., Kuhlen, M., & Madau, P. 2007, ApJ, 667, 859
- Dominik et al. (2012) Dominik, M., Belczynski, K., Fryer, C., et al. 2012, ApJ, 759, 52
- Eichler et al. (1989) Eichler, D., Livio, M., Piran, T., & Schramm, D. N. 1989, Natur, 340, 126
- François et al. (2007) François, P., Depagne, E., Hill, V., et al. 2007, A&A, 476, 935
- François et al. (2016) François, P., Monaco, L., Bonifacio, P., et al. 2016, A&A, 588, A7
- Frebel et al. (2014) Frebel, A., Simon, J. D., & Kirby, E. N. 2014, ApJ, 786, 74
- Freiburghaus et al. (1999) Freiburghaus, C., Rosswog, S., & Thielemann, F.-K. 1999, ApJ, 525, L121
- Goriely et al. (2011) Goriely, S., Bauswein, A., & Janka, H.-T. 2011, ApJL, 738, L32
- Goriely et al. (2015) Goriely, S., Bauswein, A., Just, O., Pllumbi, E., & Janka, H.-T. 2015, MNRAS, 452, 3894
- Hillebrandt et al. (1984) Hillebrandt, W., Nomoto, K., & Wolff, G. 1984, A&A, 133, 175
- Hirai et al. (2015) Hirai, Y., Ishimaru, Y., Saitoh, T. R., et al. 2015, ApJ, 814, 41
- Hirai et al. (2017) Hirai, Y., Ishimaru, Y., Saitoh, T. R., et al. 2017, MNRAS, 466, 2474
- Hirai & Saitoh (2017) Hirai, Y. & Saitoh, T. R. 2017, ApJL, 838, L23
- Honda et al. (2004) Honda, S., Aoki, W., Kajino, T., et al. 2004, ApJ, 607, 474
- Honda et al. (2006) Honda, S., Aoki, W., Ishimaru, Y., Wanajo, S., & Ryan, S. G. 2006, ApJ, 643, 1180
- Honda et al. (2007) Honda, S., Aoki, W., Ishimaru, Y., & Wanajo, S. 2007, ApJ, 666, 1189
- Ishimaru & Wanajo (1999) Ishimaru, Y., & Wanajo, S. 1999, ApJL, 511, L33
- Ishimaru et al. (2004) Ishimaru, Y., Wanajo, S., Aoki, W., & Ryan, S. G. 2004, ApJL, 600, L47
- Ishimaru et al. (2015) Ishimaru, Y., Wanajo, S., & Prantzos, N. 2015, ApJL, 804, L35
- Ji et al. (2016a) Ji, A., Frebel, A., Chiti, A., & Simon, J. D. 2016a, Natur, 531, 610
- Ji et al. (2016b) Ji, A. P., Frebel, A., Simon, J. D., & Chiti, A. 2016b, ApJ, 830, 93
- Ji & Frebel (2018) Ji, A. P. & Frebel, A.2018, ApJ, 856, 138
- Johnson & Bolte (2002) Johnson, J. A., & Bolte, M. 2002, ApJ, 579, 616
- Kirby et al. (2013) Kirby, E. N., Cohen, J. G., Guhathakurta, P., et al. 2013, ApJ, 779, 102
- Koch et al. (2013) Koch, A., Feltzing, S., Adén, D., & Matteucci, F. 2013, A&A, 554, A5
- Komiya & Shigeyama (2016) Komiya, Y., & Shigeyama, T. 2016, ApJ, 830, 76
- Komiya et al. (2014) Komiya, Y., Yamada, S., Suda, T., & Fujimoto, M. Y. 2014, ApJ, 783, 132
- Korobkin et al. (2012) Korobkin, O., Rosswog, S., Arcones, A., & Winteler, C. 2012, MNRAS, 426, 1940
- Kroupa (2002) Kroupa, P. 2002, Science, 295, 82
- Kubryk et al. (2015) Kubryk, M., Prantzos, N., & Athanassoula, E. 2015, A&A, 580, A126
- Lattimer & Schramm (1974) Lattimer, J. M., & Schramm, D. N. 1974, ApJL, 192, L145
- Li & Paczyński (1998) Li, L.-X., & Paczyński, B. 1998, ApJ, 507, L59
- Matteucci et al. (2014) Matteucci, F., Romano, D., Arcones, A., Korobkin, O., & Rosswog, S. 2014, MNRAS, 438, 2177
- McWilliam (1998) McWilliam, A. 1998, AJ, 115, 1640
- Metzger et al. (2010) Metzger, B. D., Martínez-Pinedo, G., Darbha, S., et al. 2010, MNRAS, 406, 2650
- Meyer (1989) Meyer, B. S. 1989, ApJ, 343, 254
- Mösta et al. (2017) Mösta, P., Roberts, L. F., Halevi, G., et al. 2017, ApJ, submitted; arXiv:1712.09370
- Nishimura et al. (2015) Nishimura, N., Takiwaki, T., & Thielemann, F.-K. 2015, ApJ, 810, 109
- Nishimura et al. (2017) Nishimura N., Sawai H., Takiwaki T., Yamada S., & Thielemann F.-K., 2017, ApJ, 836, L21
- Nomoto et al. (2013) Nomoto, K., Kobayashi, C., & Tominaga, N. 2013, ARA& A, 51, 457
- Pian et al. (2017) Pian, E., D’Avanzo, P., Benetti, S., et al. 2017, Natur, 551, 67
- Prantzos (2006) Prantzos, N. 2006, New A Rev., 50, 553
- Prantzos (2008) Prantzos, N. 2008, A&A, 489, 525
- Prantzos et al. (2018) Prantzos, N., Abia, C., Limongi, M., Chieffi, A., & Cristallo, S. 2018, MNRAS, 476, 3432
- Qian (2000) Qian, Y.-Z. 2000, ApJL, 534, L67
- Radice et al. (2016) Radice, D., Galeazzi, F., Lippuner, J., et al. 2016, MNRAS, 460, 3255
- Roederer et al. (2016) Roederer, I. U., Mateo, M., Bailey, III, J. I., et al. 2016, Astronomical Journal, 151, 82
- Safarzadeh & Scannapieco (2017) Safarzadeh, M., & Scannapieco, E. 2017, MNRAS, 471, 2088
- Shen et al. (2015) Shen, S., Cooke, R. J., Ramirez-Ruiz, E., et al. 2015, ApJ, 807, 115
- Schaller et al. (1992) Schaller, G., Schaerer, D., Meynet, G., & Maeder, A. 1992, A&AS, 96, 269
- Shibagaki et al. (2016) Shibagaki, S., Kajino, T., Mathews, G. J., et al. 2016, ApJ, 816, 79
- Shibata et al. (2017) Shibata, M., Fujibayashi, S., Hotokezaka, K., et al. 2017, PhRvD, 96, 123012
- Siqueira Mello et al. (2013) Siqueira Mello, C., Jr., Spite, M., Barbuy, B., et al. 2013, A&A, 550, A122
- Siqueira Mello et al. (2014) Siqueira Mello, C., Jr., Hill, V., Barbuy, B., et al. 2014, A&A, 565, A93
- Sneden et al. (2003) Sneden, C., Cowan, J. J., Lawler, J. E., et al. 2003, The Astrophysical Journal, 591, 936
- Sneden et al. (2008) Sneden, C., Cowan, J. J., & Gallino, R. 2008, ARAA, 46, 241
- Suda et al. (2008) Suda, T., Katsuta, Y., Yamada, S., et al. 2008, PASJ, 60, 1159
- Suda et al. (2011) Suda, T., Yamada, S., Katsuta, Y., et al. 2011, MNRAS, 412, 843
- Suzuki & Nagataki (2005) Suzuki, T. K., & Nagataki, S. 2005, ApJ, 628, 914
- Symbalisty & Schramm (1982) Symbalisty, E., & Schramm, D. N. 1982, ApJL, 22, 143
- Thielemann et al. (2017) Thielemann, F., -K., Eichler, M., Panov, I. V., & Wehmeyer, B. 2017, ARNPS, 67, 253
- Thompson (2003) Thompson T. A., 2003, ApJ, 585, L33
- Thompson & ud-Doula (2017) Thompson T. A. & ud-Doula, A. 2018, MNRAS, 476, 5502
- Truran (1981) Truran, J.W. 1981, A&A, 97, 391
- Tsujimoto & Shigeyama (2014) Tsujimoto, T., & Shigeyama, T. 2014, A&A, 565, L5
- Tsujimoto et al. (2000) Tsujimoto, T., Shigeyama, T., & Yoshii, Y. 2000, ApJL, L531, 33
- van de Voort et al. (2015) van de Voort, F., Quataert, E., Hopkins, P. F., Kereš, D., & Faucher-Giguère, C.-A. 2015, MNRAS, 447, 140
- Wanajo & Ishimaru (2006) Wanajo, S. & Ishimaru, I. 2006, Nucl. Phys. A, 777, 676
- Wanajo et al. (2011) Wanajo, S., Janka, H.-T., & Müller, B. 2011, ApJL, 726, L15
- Wanajo (2013) Wanajo, S. 2013, ApJL, 770, L22
- Wanajo et al. (2014) Wanajo, S., Sekiguchi, Y., Nishimura, N., et al. 2014, ApJL, 789, L39
- Wanajo et al. (2018) Wanajo, S., Müller, B., Janka, H.-T., & Heger, A. 2018, ApJ, 852, 40
- Wehmeyer et al. (2015) Wehmeyer, B., Pignatari, M., & Thielemann, F.-K. 2015, MNRAS, 452, 1970
- Winteler et al. (2012) Winteler, C., Käppeli, R., Perego, A., et al. 2012, ApJL, 750, L22
- Woosley et al. (1994) Woosley, S. E., Wilson, J. R., Mathews, G. J., Hoffman, R. D., & Meyer, B. S. 1994, ApJ, 433, 229
- Wu et al. (2016) Wu, M.-R., Fernández, R., Martínez-Pinedo, G., & Metzger, B. D. 2016, MNRAS, 463, 2323