Superconductivity in oxygen-added Zr5Pt3
Abstract
Mn5Si3-type structure has been offering an interstitial chemistry. Recent report of enhancement of superconductivity in a Nb-based Mn5Si3-type compound by addition of an interstitial atom motivated us to investigate the effect of oxygen-addition in Mn5Si3-type Zr5Pt3. The superconducting critical temperature of 6.4 K in the parent Zr5Pt3 is monotonously reduced to 3.2 K in Zr5Pt3Ox (=0.6) with increasing oxygen-content. As is further increased from 0.6 to 2.5, exceeding the full occupancy of oxygen site (=1.0), samples become multi-phases composed of Zr5Pt3O∼0.5-0.6, ZrPt and ZrO2. However, the superconducting critical temperature slightly increases to 4.8 K at =2.5. The metallographic observation has revealed a change of microstructure at 1.0. The change of microstructure and/or the composition effect would be responsible for the enhancement of superconductivity.
Keywords: Mn5Si3-type, oxygen addition, superconductivity, microstructure, composition effect
1 Introduction
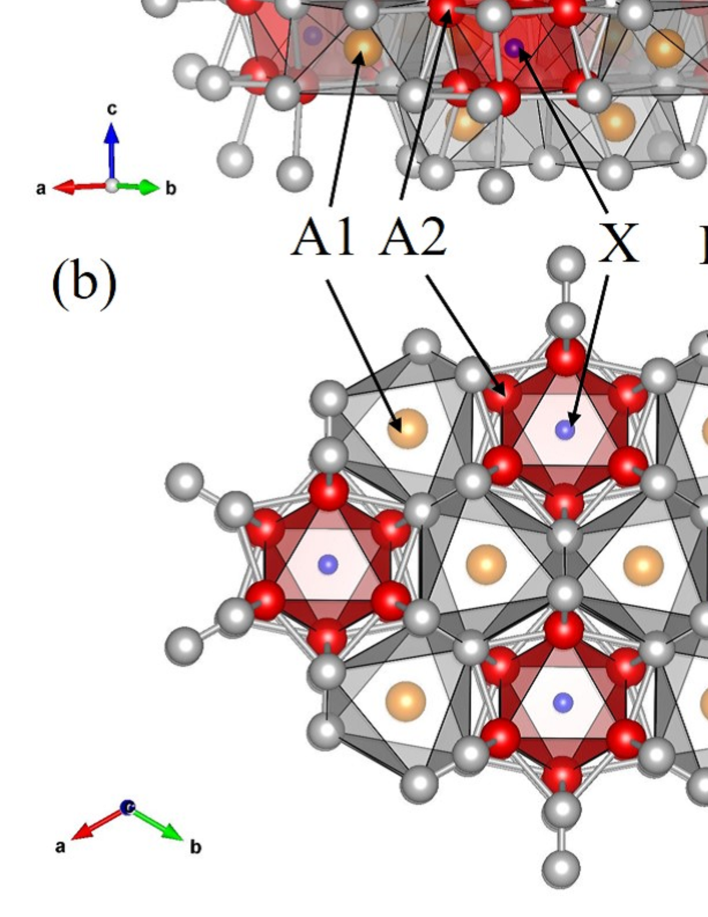
A wide variety of atoms form the hexagonal Mn5Si3-type structure[1], represented as A5B3, with the space group P63/mcm (No.193). There are three crystallographic sites in A5B3. The A atoms occupy the 4d (for A1 atom) and 6g (for A2 atom) sites and the B atom occupies another 6g site. The A atoms mainly consist of early transition metals, rare earth elements and alkaline earth elements. Metalloid elements and post-transition metals are usually responsible for B atoms. The extensive electron-number of A5B3 allows various interstitial atoms such as oxygen, boron and carbon. These interstitial atoms, denoted by X, occupy the 2b site in P63/mcm and A5B3X is called as the Ti5Ga4 or Hf5CuSn3-type structure. Figure 1 shows the crystal structure of A5B3X compound. The added X atom is surrounded by A2 atoms in the octahedral site, which forms a face-sharing A26 chain along the -axis. Another octahedral B atoms enclose the A1 atom which also forms a one-dimensional atomic chain along the -axis. Therefore an expansion of lattice parameter would enhance the one-dimensional nature of octahedral A26 and A1 atomic chains.
Although physical properties of numerous Mn5Si3 or Ti5Ga4-type compounds are investigated[2, 3, 4, 5], the superconductivity is reported only in several compounds. The Nb-based system Nb5Ir3O is attractive as a rather high superconducting critical temperature compound. In Nb5Ir3O, the parent Mn5Si3-type Nb5Ir3 exhibits superconductivity at 9.3 K. As the oxygen atoms are added, progressively increases to 10.5 K in Nb5Ir3O, which possesses two kinds of superconducting gaps revealed by the specific heat measurement[6].
As for Zr-based Mn5Si3-type compounds, Lv et al. have reported the superconducting Zr5Sb3 with of 2.3 K[7]. Zr5Sb3 allows interstitial oxygen atoms fully occupying the 2b site. Contrary to the enhancement of in Nb5Ir3O, the addition of oxygen atoms reduces and Zr5Sb3O is a normal metal down to 1.8 K[7]. Recently it has been discovered[8] that a Ru substitution into the Ge site in non-superconducting Zr5Ge3 induces a superconducting behavior at 5.7 K. About 30 years ago, Waterstrat et al. reported[9] that Zr5Pt3 is a superconductor with of 7.2 K. Furthermore, oxygen-added Zr5Pt3O is reported to crystallize in the Ti5Ga4-type structure[10], however, the physical properties of Zr5Pt3O have not been investigated. We have focused on the effect of oxygen-addition in superconducting Zr5Pt3. In this paper, we report the synthesis and metallographic characterization of Zr5Pt3Ox and the oxygen-content dependence of .
2 Materials and Methods
Polycrystalline samples were prepared using Zr pieces (or powder) (99%), Pt wire (99.9%) and ZrO2 powder (98%). Zr5Pt3 was synthesized by arc melting the Zr pieces and Pt wire with the stoichiometric composition. To synthesize oxygen-added Zr5Pt3Ox, Zr5Ox was initially prepared as follows. Zr and ZrO2 powders were mixed in an agate mortar and pressed into a pellet. The pelletized sample was arc melted and then Zr5Ox was remelted with added Pt wire to form the stoichiometric composition. The samples were remelted several times to ensure the homogeneity of the samples. The weight loss during the arc melting was negligible. Each as-cast sample was annealed in an evacuated quartz tube at 800 ∘C for 4 days. The samples were evaluated using a powder X-ray diffractometer (Shimadzu, XRD-7000L) with Cu-K radiation. The metallographic characterization was carried out by observing back-scattered electron images obtained by a field emission scanning electron microscope (FE-SEM; JEOL, JSM-7100F). The atomic composition of sample was checked by using an energy dispersive X-ray (EDX) spectrometer that was equipped with the FE-SEM.
The temperature dependence of ac magnetic susceptibility (T) in an alternating field of 5 Oe at 800 Hz, between 2.8 K and 300 K, was measured using a closed-cycle He gas cryostat. The temperature dependence of electrical resistivity (T) between 2.8 K and 300 K was measured by the conventional DC four-probe method using the cryostat.
3 Results and discussion
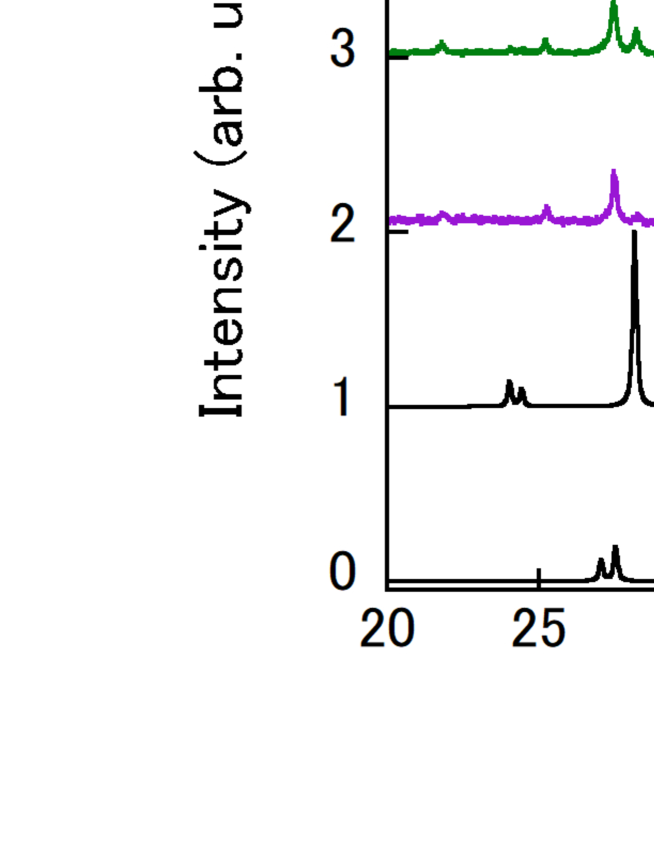
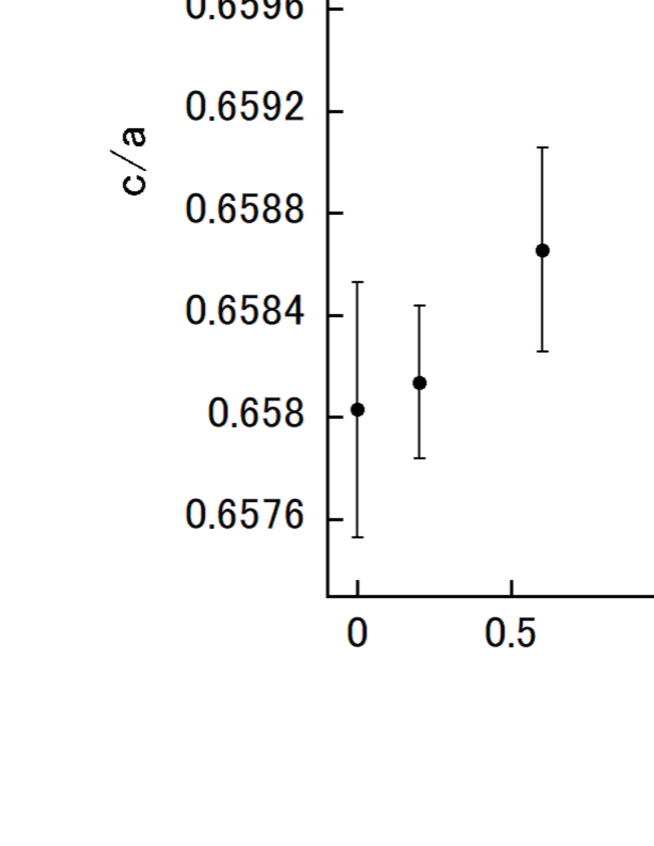
Figure 2(a) shows the X-ray diffraction (XRD) patterns of Zr5Pt3Ox (=0, 0.2, 0.6 and 1.0). The simulated patterns of Zr5Pt3 (Mn5Si3-type) and Zr5Pt3O (Ti5Ga4-type) are also presented. The diffraction peaks of parent compound Zr5Pt3 and oxygen-added Zr5Pt3Ox with =0.2 and 0.6 samples can be well indexed by the Mn5Si3-type and the Ti5Ga4-type structure, respectively. Although the XRD pattern of Ti5Ga4-type structure is contained in Zr5Pt3O, impurity phases of ZrPt (filled triangle) and ZrO2 (filled circle) appear. The ideal uppermost oxygen content is 1.0 by taking into account the full occupancy of 2b site, however, we prepared the samples with exceeding 1.0. The peak intensity of impurity phases grows with increasing from 1.0 (see Fig. 2(b)). In Zr5Pt3O2.5, the maximum peak intensity of ZrPt surpasses that of the Ti5Ga4-type structure. The lattice parameters of prepared samples were refined by the least square method using XRD data and listed in Table 1. The dependences of and , and -ratio are displayed in Figs. 3(a) and 3(b), respectively. In both figures, the nominal oxygen-content is employed as . Both and systematically decrease with increasing from 0 to 1.0. Above =1.0, steeply increases, while shows a slight increase. A monotonous increase of -ratio with increasing is confirmed in Fig. 3(b).
| Sample | (Å) | (Å) | (K) by | (K) by | |
|---|---|---|---|---|---|
| Zr5Pt3 | 8.182(3) | 5.384(2) | 0.6580(5) | 6.4 | 6.4 |
| Zr5Pt3O0.2 | 8.167(2) | 5.375(1) | 0.6581(3) | 4.1 | 4.0 |
| Zr5Pt3O0.6 | 8.156(2) | 5.372(2) | 0.6587(4) | 3.2 | 3.1 |
| Zr5Pt3O | 8.151(3) | 5.369(2) | 0.6587(5) | 3.5 | 3.2 |
| Zr5Pt3O1.5 | 8.159(3) | 5.376(2) | 0.6590(5) | 4.1 | 3.7 |
| Zr5Pt3O2.5 | 8.157(3) | 5.384(2) | 0.6601(5) | 4.8 | 4.8 |
| Zr4.9Pt3.1O0.67 | 8.159(2) | 5.379(1) | 0.6593(5) | 3.7 | 3.3 |
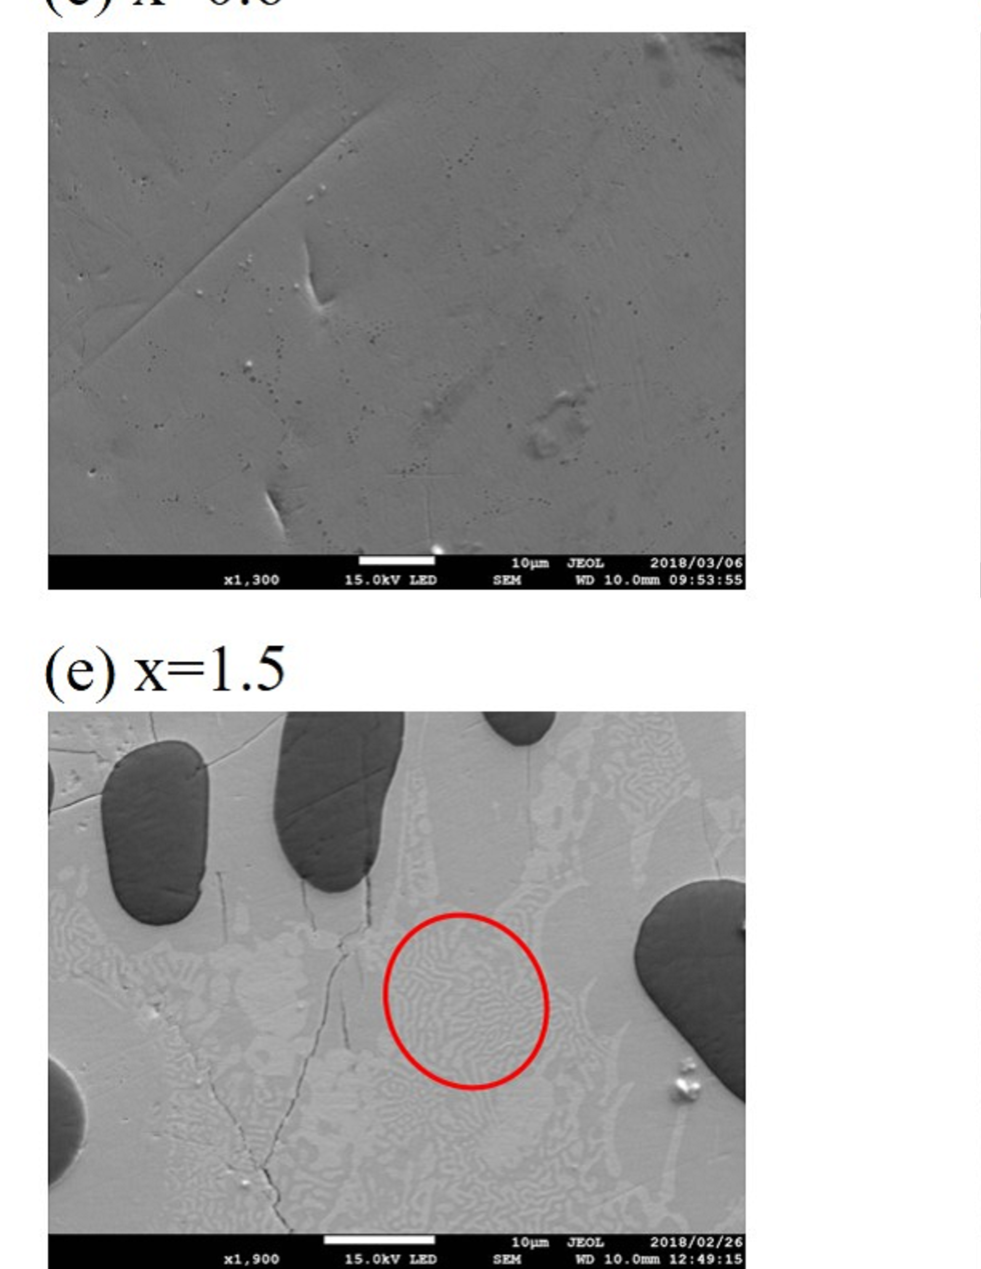
Back-scattered electron images obtained by FE-SEM with electron beams of 15 keV are shown in Fig. 4. The atomic composition obtained by EDX measurement of each sample is listed in Table 2. For each sample with 0.2, non-contrast image means almost single phase. In Zr5Pt3, Zr5Pt3O0.2 and Zr5Pt3O0.6, the respective sample shows the atomic composition being near to the starting one. As is further increased from 1.0, the sample decomposes into three phases Zr5Pt3O∼0.5-0.6, ZrPt and ZrO2. Although the composition ratios between Zr and Pt atoms in Zr5Pt3Ox ( 1.0) are close to Zr5Pt3, the oxygen-contents are far less than the nominal ones, which means a solubility limit of oxygen atoms ( 0.6) in Zr5Pt3. The dark islands observed in Zr5Pt3Ox (1.0) are ZrO2 phases, which begin to appear in Zr5Pt3O0.6 as a small amount of point-like structure. The brighter images in Figs. 4(d), 4(e) and 4(f) are ZrPt phases. It is remarkable that Zr5Pt3O∼0.5-0.6 and ZrPt partially forms a eutectic-like structure, for example, denoted by red elliptic closed-curves as in Figs. 4(d) and 4(e). On going from =1.0, 1.5 to 2.5, the area of eutectic-like structure seems to increase. We note here that it is important to investigate a phase relation, a homogeneity range and so on, for example, using a differential thermal analysis method. However, even for the binary Zr-Pt system, the phase diagrams in the vicinity of Zr5Pt3 differ from literature to literature[11, 12, 13], which indicates some difficulties in obtaining a precise phase relation or homogeneity range for Zr5Pt3Ox system. Therefore, a thermal analysis study would require a long time and careful experiment, and remains an issue.
| Sample | Atomic composition |
|---|---|
| Zr5Pt3 | Zr5.1(2)Pt2.9(2) |
| Zr5Pt3O0.2 | Zr4.9(1)Pt3.1(1)O0.20(9) |
| Zr5Pt3O0.6 | Zr5.1(1)Pt2.9(1)O0.66(9) |
| Zr5Pt3O1.0 | Zr5.2(2)Pt2.8(1)O0.45(9), Zr1.0(2)Pt1.0(2), Zr1.09(6)O1.91(6) |
| Zr5Pt3O1.5 | Zr4.7(2)Pt3.2(2)O0.55(9), Zr1.0(1)Pt1.0(1), Zr1.03(5)O1.98(5) |
| Zr5Pt3O2.5 | Zr4.9(1)Pt3.1(1)O0.67(7), Zr0.99(1)Pt1.01(1), Zr0.95(3)O2.05(3) |
| Zr4.9Pt3.1O0.67 | Zr4.9(1)Pt3.2(2)O0.41(7), Zr1.12(6)Pt0.88(6) |
Shown in Figs. 5(a) and 5(b) are (T) of Zr5Pt3Ox with 0 0.6 and those with 1.0 2.5, respectively. All Zr5Pt3Ox samples exhibit diamagnetic signals. In each sample, was determined as being the intercept of the linearly extrapolated diamagnetic slope with the normal state signal (see the broken lines in the figures), and listed in Table 1. of Zr5Pt3 is slightly lower than the literature [9] value 7.2 K. As is increased from 0 to 0.6, systematically decreases to 3.2 K. However, further increase of enhances up to 4.8 K at =2.5. As mentioned above, the samples with 1.0 contain well known insulating ZrO2 and ZrPt. In order to check whether ZrPt is a superconductor or not, of ZrPt was measured and no diamagnetic signal down to 2.8 K is observed as shown in Fig. 5(b). Therefore the observed superconductivities are intrinsic for Zr5Pt3O∼0.5-0.6 phases in Zr5Pt3Ox with 1.0.
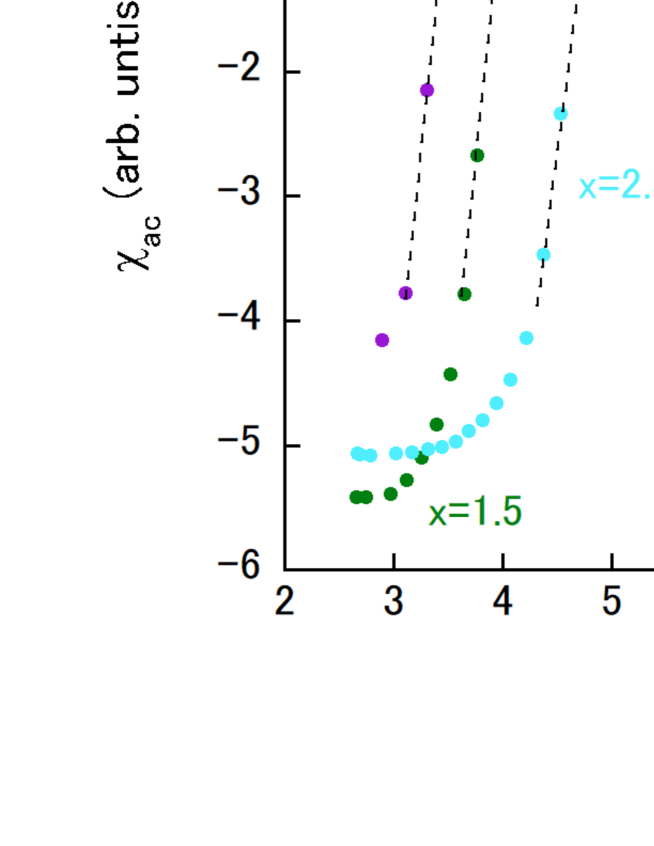
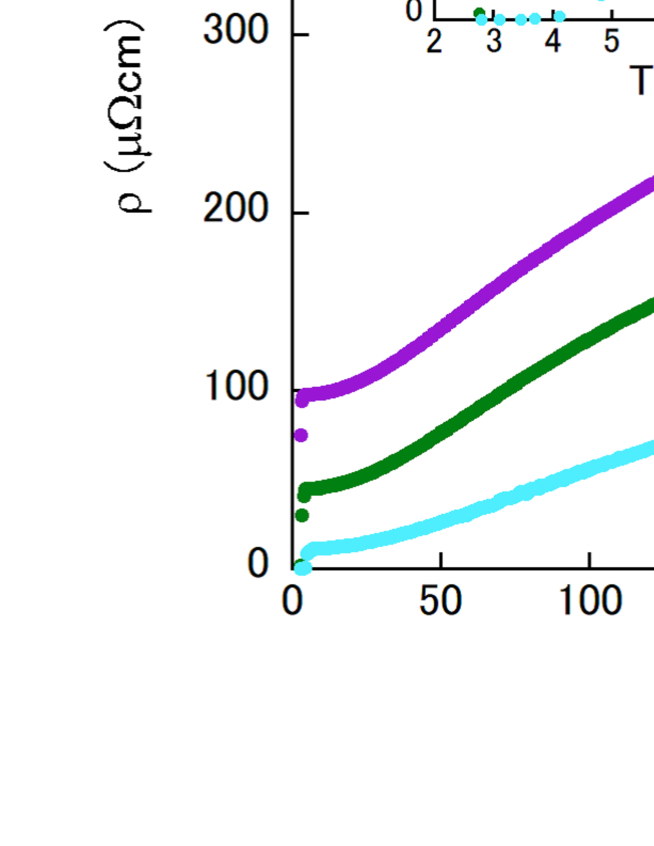
Figure 6(a) (6(b)) summarizes (T) of Zr5Pt3Ox with 0 0.6 (1.0 2.5). In a few samples with low , zero resistivity could not be observed at the lowest achievable temperature. Each determined by following the same manner as in (T) roughly corresponds to that obtained by (T) measurement (see Table 1). The sample with =0 (also with 0.2 and 0.6) shows (T) largely deviating from the linearity above . The similar deviation is observed in A15 superconductors such as Nb3Sn or a pyrochloa superconductor of KOs2O6, which is ascribed to an existence of additional scattering source[14, 15]. Although the origin of scattering source might be controversial, Woodward and Cody[14] have presented a well-known empirical formula as follows:
| (1) |
, where the first term means a residual resistivity, the second one phonon part of and the third one describes anomalous temperature dependence. In Nb3Sn and KOs2O6, the equation well reproduces respective (T). We have also fitted (T) of Zr5Pt3 using eq. (1). If the linear term is taken into account, the fitting accuracy is not satisfactory. The well reproducibility as depicted by the solid curve in Fig. 6(a) can be obtained by eliminating the linear term, which suggests a dominance of anomalous temperature dependence. The parameters were determined to be 183 cm, 234 cm and 56 K. The large deviation from the linearity is not discernible in (T) of samples with 1.0 partially due to the contamination by ZrPt.
Zr5Pt3Ox with = 0.2 and 0.6 can be regarded as the almost single-phased Ti5Ga4-type with the 2b site partially filled by oxygen atoms. The oxygen addition up to =0.6 systematically reduces . The similar systems of Nb5Ir3O and Zr5Sb3O also exhibit some interstitial-atom concentration dependences of [6, 7]. The reported dependences, combined with the variations of lattice parameters by atom additions, are summarized in Table 3. In Nb5Ir3O, enhancement occurs with the addition of oxygen atoms, which shrinks and expands . The expansion of would bring octahedral Nb26 and Nb1 atomic chains closer to a one-dimensional system, and the shrinkage of leads to a shorter Nb-Nb distance. These might cause the enhancement. On the other hand, Zr5Sb3O and Zr5Pt3Ox (0.6) show the reduction of by adding oxygen atoms. In Zr5Pt3Ox (0.6), both and decrease by oxygen addition, while the opposite trends are reported [7, 16] in Zr5Sb3O, suggesting the weak correlation between lattice parameters and . In Zr compounds with the Mn5Si3-type structure, for example, the superconductivity appears[8] by substituting Ru into the Ge site in Zr5Ge3. The substitution of atoms would be effective for the enhancement (appearance) of superconductivity in Zr based Mn5Si3 or Ti5Ga4-type structure.
| Compound | =- | =- | =- | Reference |
|---|---|---|---|---|
| Nb5Ir3O | + | - | + | [6] |
| Zr5Sb3O | + | + | - | [7, 16] |
| Zr5Pt3Ox ( 0.6) | - | - | - | this work |
| Zr5Ge3-xRux | - | - | + | [8] |
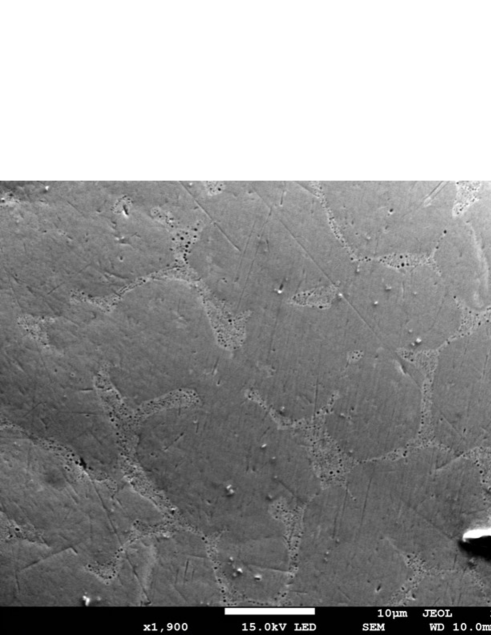
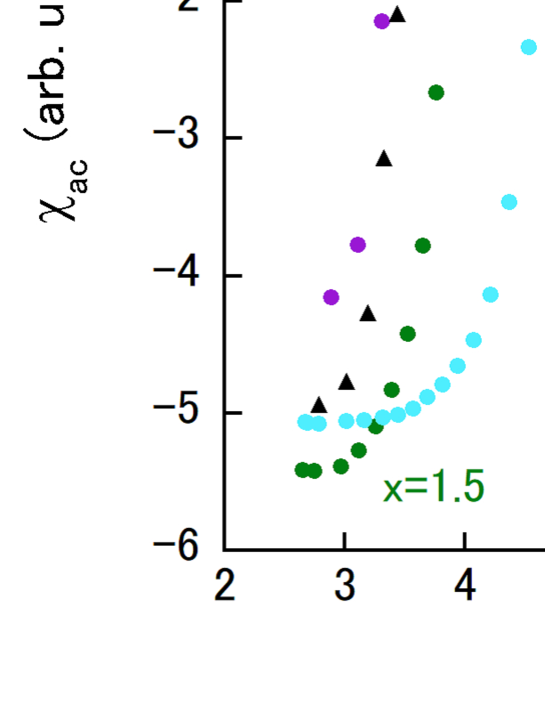
We discuss here the enhancement in Zr5Pt3Ox with 1.0, in which the superconducting Zr5Pt3O∼0.5-0.6 phase coexists with ZrO2 and ZrPt phases. Once the phase decomposition occurs at =1.0, the oxygen content is reduced to approximately 0.45. The increase of from 1.0 again gradually adds oxygen atoms. Contrary to the above mentioned results of Zr5Pt3Ox ( 0.6), the oxygen addition causes the enhancement. As shown in Figs. 3(a) and 3(b), , and might have some correlation with of samples with 1.0; the expansion of both and with increased -ratio possibly leads to the enhancement of . In order to elucidate the correlation between lattice parameters and , we prepared a sample with the starting composition of Zr4.9Pt3.1O0.67. The compound, containing ZrPt impurity phase detected as the brighter image in Fig. 7, shows , and -ratio, which are between those of the sample with =1.5 and =2.5 (see Table 1). Nonetheless of Zr4.9Pt3.1O0.67 is lower than that of the sample with =1.5 as demonstrated by Fig. 8. This result suggests that the degree of enhancement is not determined only by the lattice parameters. The important metallographic aspect is that, as is increased, the microstructure changes at 1.0, showing the enhancement (see also Figs. 4(d) to 4(f)). However, the microstructure of Zr4.9Pt3.1O0.67 as shown in Fig. 7 is largely different from those of Zr5Pt3Ox (1.0). The synthesis with the oxygen content, exceeding the solubility limit, has changed a material’s microstructure, which would play an important role for the enhancement. We note here that in Sr2RuO4 or Ir a change of microstructure also enhances [17, 18]. The eutectic Sr2RuO4 sample shows a lamellar pattern of Ru metal[17]. Although the lamellar pattern does not affect the lattice parameters of Sr2RuO4, increases from 1.5 K to 3 K. Ir with a small amount of YIr2 forms a lamellar pattern and possesses a small lattice mismatch, leading to the strain-induced lattice softening[18]. This softening contributes to the enhancement from 0.1 K to 2.7 K.
Another scenario of enhancement is a composition effect. For example, if a ternary compound possesses a certain homogeneity range in its ternary phase diagram, or magnetic ordering temperature frequently depends on the composition of compound. Such composition effect is reported for superconducting[19] CeCu2Si2 or antiferromagnetic compound[20] Nd3Pd20Ge6. In CeCu2Si2, the lattice parameters do not exhibit clear composition dependence. On the other hand, Nd3Pd20Ge6 shows lattice parameters strongly depending on the composition. Although the composition of Zr5Pt3O0.6 with 3.2 K is not so different from that of Zr5Pt3Ox phase in Zr5Pt3O2.5 with 4.8 K (see Table 2), more precise study of composition effect might be needed.
4 Conclusions
We have investigated the oxygen-content dependence of in Zr5Pt3Ox by measuring and , combined with the metallographic study. Single phase is confirmed for each sample with =0 and 0.2. A small amount of ZrO2 appear in Zr5Pt3O0.6. Thus the oxygen content is limited to approximately 0.6. With further increasing above 1.0, corresponding to the full occupancy of oxygen atoms, Zr5Pt3Ox shows the decomposition into Zr5Pt3O∼0.5-0.6, ZrPt and ZrO2. The FE-SEM observation has confirmed the change of microstructure at 1.0. The parent Zr5Pt3 shows the superconductivity at of 6.4 K, which is decreased to 3.2 K as the oxygen content is increased to 0.6. The crystallographic consideration is presented by surveying the results of Nb5Ir3O, Zr5Sb3O and Zr5Ge3-xRux. For Zr-based Mn5Si3-type compounds, oxygen addition would reduce , irrespective of the oxygen-content dependence of lattice parameters. The atom substitution like in Zr5Ge3-xRux might be effective for the enhancement of superconductivity. In Zr5Pt3Ox ( 1.0) showing the change of microstructure, slight enhancement of with increasing is observed. The fact would be correlated with the change of microstructure and/or the composition effect.
References
References
- [1] Corbett J D, Garcia E, Guloy A M, Hurng W-M, Kwon Y-U, Leon-Escamilla E A 1998 Chem. Mater. 10 2824
- [2] Zheng C, Mattausch H, Simon A 2002 J. Alloys and Compounds 347 79
- [3] Sürgers C, Gajdzik M, Fischer G, Löhneysen H v, Welter E, Attenkofer K 2003 Phys. Rev. B 68 174423
- [4] Mar A, Tougait O, Potel M, Noël H, Lopes E B 2006 Chem. Mater. 18 4533
- [5] Goruganti V, Rathnayaka K D D, Ross Jr. J H 2009 J. Appl. Phys. 105 07E118
- [6] Zhang Y, Wang B, Xiao Z, Lu Y, Kamiya T, Uwatoko Y, Kageyama H, Hosono H 2017 npj Quantum Materials 2:45 doi:10.1038/s41535-017-0053-4
- [7] Lv B, Zhu X Y, Lorenz B, Wei F Y, Xue Y Y, Yin Z P, Kotliar G, Chu C W 2013 Phys. Rev. B 88 134520
- [8] Li S, Liu X, Anand V, Lv B 2018 New J. Phys. 20 013009
- [9] Waterstrat R M, Kuentzler R, Muller J 1990 J. Less-Common Met. 167 169
- [10] Gupta S, Sordelet D J, Corbett J D 2009 J. Solid State Chem. 182 1708
- [11] Biswas T K, Schubert K 1967 Z. Metallk 58 558
- [12] Binary alloy phase diagrams, ed by Massalski et al 1990 (ASM Int., Materials Park, OH) 3 3156
- [13] Alonso P R, Arias D E, Gribaudo L M 2001 Scr. Mater. 44 429
- [14] Woodard D W, Cody G D 1964 Phys. Rev. 136 A166
- [15] Hiroi Z, Yonezawa S, Nagao Y, Yamaura J 2007 Phys. Rev. B 76 014523
- [16] Robteutscher W, Schubert K 1965 Z. Metallk 56 813
- [17] Maeno Y, Ando T, Mori Y, Ohmichi E, Ikeda S, Nishizaki S, Nakatsuji S 1998 Phys. Rev. Lett. 81 3765
- [18] Matthias B T, Stewart G R, Giorgi A L 1980 Science 208 401
- [19] Ishikawa M, Braun H F, Jorda J L 1983 Phys. Rev. B 27 3092(R)
- [20] Kitagawa J, Takeda N, Sakai F, Ishikawa M 1999 J. Phys. Soc. Jpn. 68 3413