Atom Interferometry with Top-Hat Laser Beams
Abstract
The uniformity of the intensity and phase of laser beams is crucial to high-performance atom interferometers. Inhomogeneities in the laser intensity profile cause contrast reductions and systematic effects in interferometers operated with atom sources at micro-Kelvin temperatures, and detrimental diffraction phase shifts in interferometers using large momentum transfer beam splitters. We report on the implementation of a so-called top-hat laser beam in a long-interrogation-time cold-atom interferometer to overcome the issue of the inhomogeneous laser intensity encountered when using Gaussian laser beams. We characterize the intensity and relative phase profiles of the top-hat beam and demonstrate its gain in atom-optics efficiency over a Gaussian beam, in agreement with numerical simulations. We discuss the application of top-hat beams to improve the performance of different architectures of atom interferometers.
Inertial sensors based on light-pulse atom interferometry address various applications ranging from inertial navigation Canuel et al. (2006); Geiger et al. (2011); Cheiney et al. (2018), metrology Bouchendira et al. (2011); Rosi et al. (2014); Parker et al. (2018), gravimetry Peters, Chung, and Chu (2001); Hu et al. (2013); Gillot et al. (2014); Freier et al. (2016); Wang et al. (2018); Bidel et al. (2018); Karcher et al. (2018) and gradiometry McGuirk et al. (2002); Sorrentino et al. (2012), tests of fundamental physics Dimopoulos et al. (2007); Lepoutre et al. (2012); Aguilera et al. (2014); Zhou et al. (2015); Jaffe et al. (2017); Asenbaum et al. (2017), or gravitational wave astronomy Chaibi et al. (2016); Hogan and Kasevich (2016). Light-pulse atom interferometers rely on the coherent transfer of momentum from the photons of counter-propagating laser beams to free falling atoms in order to split, deflect and recombine the matter-waves. The sensitivity and accuracy of the instruments thus crucially depend on the relative phase uniformity of the laser beams realizing these atom-optics functionalities. State-of-the-art cold-atom sensors typically use sources at few K temperatures, interrogation times of several hundreds of milliseconds, and two-photon transitions Rosi et al. (2014); Freier et al. (2016); Dutta et al. (2016). Inhomogeneities in the laser intensity across the atom cloud degrade the atom optics efficiency, which causes a decrease of interferometer contrast and hence a lower signal to noise ratio, as well as systematic effects Gauguet et al. (2009). Such detrimental effects are amplified in interferometers employing large momentum transfer (LMT) techniques (in which several momenta are transferred to the atoms) Asenbaum et al. (2017); Mazzoni et al. (2015), in particular because of diffraction phase shifts Büchner et al. (2003). The problem of intensity inhomogeneity can be mitigated by employing Gaussian beams with a size much larger than that of the atom cloud, at the cost of a reduced peak intensity.
In this work, we report on the implementation of a collimated top-hat laser beam (i.e. with a uniform intensity distribution in the central part Gori (1994)) as a solution to circumvent the problems encountered in atom interferometers employing Gaussian beams.
Beamshaping is a topic of intense development, with applications ranging from micro-lithography, optical data storage, or optical tweezers, where different approaches are followed to produce structured light patterns. For application to atom interferometry, the requirement on the relative phase homogeneity motivates a scheme where the counter-propagating beam pair is obtained by retro-reflection (the retro-distance typically lying in the ten-centimeters-to-meter scale). The interrogation laser beams are thus required to be well collimated over such distances. This requirement on the beam shaping technique amounts to achieving a flat phase profile.
The simplest form of shaping the intensity distribution of a laser beam, apodization, results in significant loss of optical power (for example, the optimal transformation of a Gaussian beam into a beam with a flat intensity profile sacrifies of the power). More efficient techniques involve diffractive optical elements, such as spatial light modulators (SLMs), in order to produce focused light patterns Pal et al. (2018), or collimated structured beams when multiple SLMs are cascaded Ma et al. (2010). However, the bulkiness of the optical setup, the potential drift of the beam-shaping performance linked to the use of an active material, and the limited incident peak intensity make such solutions cumbersome for atom interferometry experiment. Instead, passive refractive techniques based on aspheric optical elements Hoffnagle and Jefferson (2000) seem favorable, owing to their compactness, stability, and efficiency.
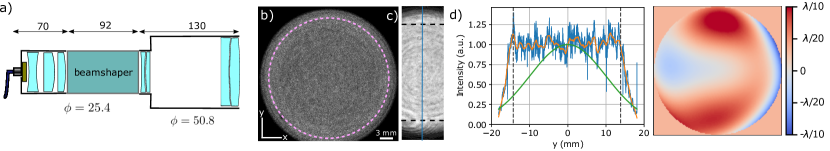
Our passive top-hat collimator solution is based on a recently released commercial beamshaper from the Asphericon company (model TSM-25-10-S-B), see Fig. 1a). The beamshaper shall receive at its input a Gaussian beam of 10 mm -diameter and produce a top-hat beam of 15 mm full width at half maximum (FWHM), with a region of about 14 mm where the intensity varies by less than (Ref. asp ). The beamshaping is done with multiple aspheric optics, based on principles similar to those of Ref. Hoffnagle and Jefferson (2000). The advertized uniformity of intensity plateau is 0.056 rms, with a phase inhomogeneity of peak-valley (PV) and rms, allowing the beam to propagate without deformation on distances of several meters asp . We inject the beamshaper with a home-made fiber collimator made of 3 simple lenses, to produce a Gaussian beam of mm diameter. At the output of the beamshaper, the top-hat beam is magnified by a factor of two with two achromatic doublets, in order to reach a useful region of 28 mm. The optical system can be mounted conveniently on an experiment. The power transmission of the input collimator plus the beamshaper is , while that of the full system is . The quality of the generated top-hat beam mainly depends on the input beam size (which must fall within the 10 mm diameter specification at the level asp ), and of its collimation.
To align the top-hat collimator, we image the beam on a paper screen, and optimize the intensity profile by moving the input fiber placed on a 5-axis mount. We target a flat circular intensity profile maintained over a propagation distance of at least 150 cm. Fig 1b) shows the beam imaged on the paper screen at the output of the expander. While this method is convenient for the alignment procedure, it is not suited for a precise measurement of the intensity uniformity of the beam because of the speckle produced on the paper screen. We use a large-area beamprofiler ( mm2) to measure the uniformity of the plateau. Fig 1c) shows the stitched images acquired by scanning the beamprofiler in front of the beam after 40 cm of propagation. The beam exhibits a qualitatively flat plateau. Large diameter rings concentric to the beam are attributed to the beamshaper. The uniformity of the plateau over a diameter of 28 mm is 0.11 rms, and the FWHM is mm. Fig 1d) shows a profile of the vertical cut through the middle of the beam (along the blue line). The orange line is a moving average over 1 mm of the profile, shown here to illustrate lower frequency inhomogeneities. For comparison, the green line shows a Gaussian beam with 40 mm diameter at (as used in Ref. Dutta et al. (2016)) and same peak intensity as the top-hat beam.
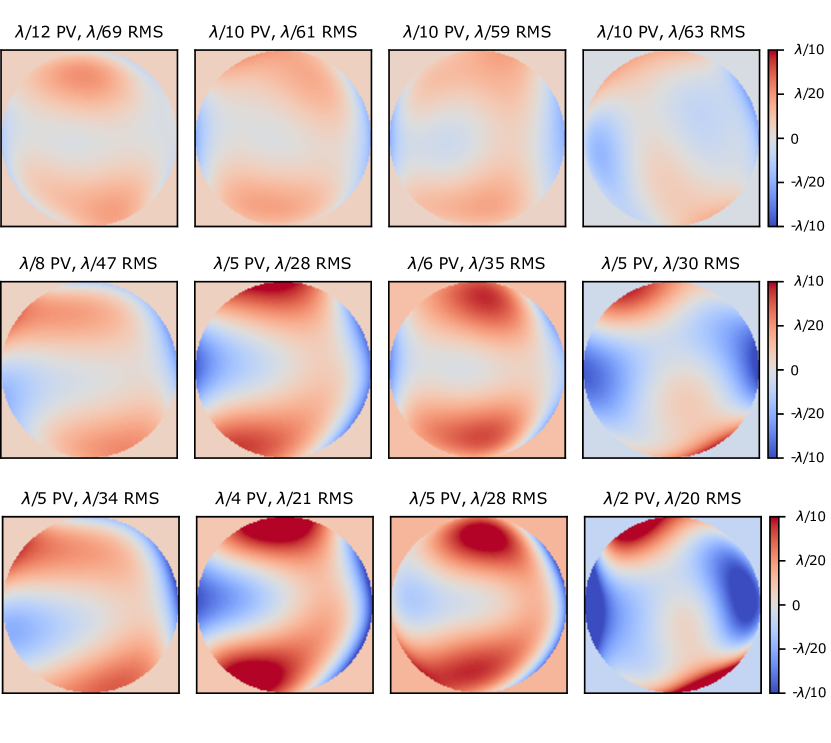
In an atom interferometer, the relative phase between two counter-propagating laser beams is imprinted on the atomic wave-function during the light pulses. This relative phase contains a term associated with the free propagation, , where the distance between the atom cloud and the retro-mirror Louchet-Chauvet et al. (2011). We measured such relative phase field for our top-hat beam using an asymmetric Michelson interferometer with the difference of its arms set to . At the output, the interference pattern carries the 2D relative phase map, which we recover using a Fourier analysis Takeda, Ina, and Kobayashi . A lower bound on the accuracy is set by the planeity of the mirrors and of the beamsplitter used in the interferometer, specified to be peak-valley (PV). The relative phase map in a pupil of 28 mm diameter corresponding to the useful part of the beam is shown Fig 1e), for a difference in propagation distance cm. We find relative phase inhomogeneities of PV and a rms. Additional phase maps for further propagation distances are given in the supplemental material. Our characterizations show that the top-hat beam is suitable for high-precision atom interferometry, where relative wavefront inhomogeneities are an issue Gauguet et al. (2009); Louchet-Chauvet et al. (2011); Schkolnik et al. (2015); Karcher et al. (2018).
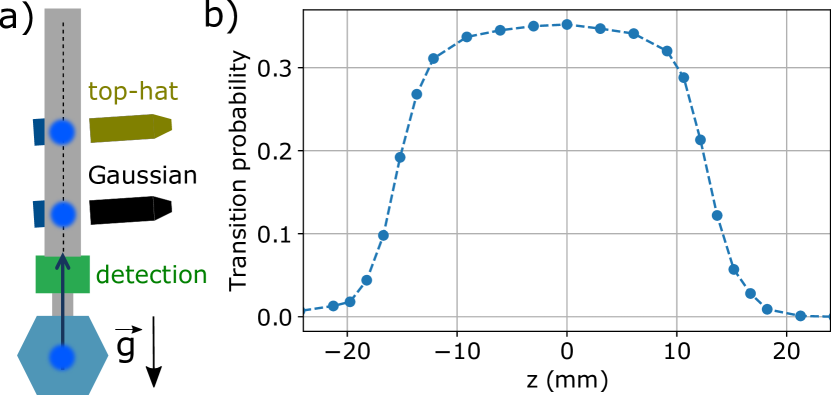
We implemented the top-hat beam on a cold-atom gyroscope-accelerometer experiment. The setup has been described in previous works Meunier et al. (2014); Dutta et al. (2016) and we recall here the main features which are relevant for this study. Laser-cooled Cesium atoms (temperature of K) are launched vertically with a velocity of up to m.s-1. After a selection step of the magnetic sublevel, we realize the atom interferometer by means of two-photon stimulated Raman transitions from counter-propagating laser beams, which couple the and clock states. The direction of the Raman beams is nearly horizontal. We use two beams separated vertically by a distance of 211 mm. The top-hat collimator was set up at the position of the top beam, while the bottom beam is a Gaussian beam of 40 mm diameter at (Fig. 2a)). The state of the atoms at the output of the interferometer is finally read out using fluorescence detection.
We first probe the intensity profile of the top-hat beam by applying a Raman pulse of fixed duration at different times as the atoms travel on their way up. The atoms are launched with velocity of 4.7 m.s-1, and their mean trajectory intersects the center of the beam after a time of flight (TOF) of 170 ms. After this relatively short TOF, the size of the cloud is still close to that of the initially launched atoms ( mm rms radius) and much smaller than the beam size. The transition probability, , is determined by the local value of the two-photon Rabi frequency, , and can thus be used as a probe of the local intensity of the beam (here denotes the direction parallel to gravity). Fig. 2b) shows the transition probability versus the relative position of the cloud inside the beam. We observe a qualitatively flat intensity profile in the center, with a width consistent with the optical characterization reported in Fig. 1.
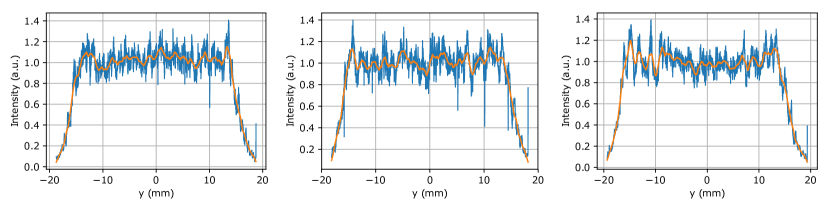
The size of a cold atom cloud increases over free propagation due to finite temperature. This results in an inhomogeneous atom-light coupling when the cloud size approaches the waist of the Gaussian beam, thereby decreasing the interferometer contrast. The intensity homogeneity of the top-hat beam allows in principle to improve on this effect. To illustrate this improvement, we operate a 3 light-pulse interferometer sequence with a pulse separation time ms, after a long TOF of 855 ms to bring forward the effect of the atom cloud expansion. For a quantitative comparison, the difference in height between the two beams (211 mm) was matched by the respective change in launch velocity, in order to obtain nearly the same TOFs when crossing the Gaussian and top-hat beams. Fig. 3 presents the comparison and shows the advantage of the top-hat beam.
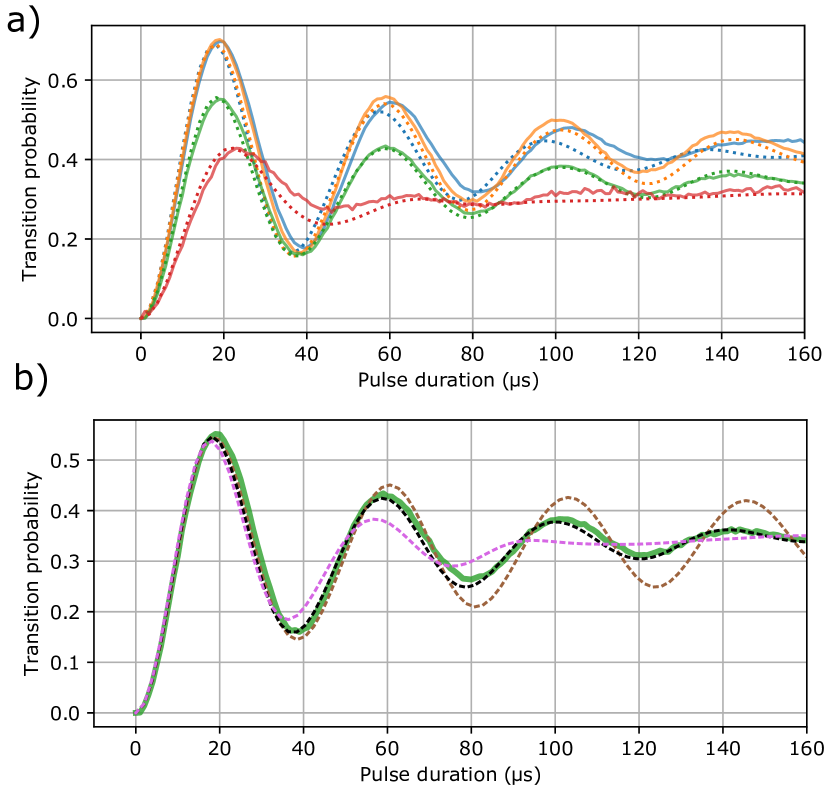
To assess the limitations to the gain in atom-optics efficiency offered by our top-hat beam over our Gaussian beam, we recorded Rabi oscillations after various TOF, when the launched atom cloud crosses the beams on its way up and on its way down. Fig 4a) shows the Rabi oscillations on the way up after a TOF of 170 ms and on the way down after TOF of 855 ms for the top-hat and Gaussian beams. On the way up, the cloud size is smaller than the beam sizes, and the Rabi oscillations have a similar shape for the Gaussian and top-hat beams, as expected. The transfer efficiency of is limited by the velocity selectivity of the two-photon transition, given by the finite Rabi frequency (i.e. laser power) and velocity spread of the atoms in the direction of the beams. On the contrary, on the way down, the Rabi oscillation in the top-hat beam (green) is significantly improved with respect to that in the Gaussian beam (red), owing to the homogeneity of the two-photon Rabi frequency from the top-hat beam. To model the Rabi oscillations, we employ a Monte-Carlo simulation where we generate an ensemble of atoms with individual velocities following the distribution measured with the Doppler-sensitive Raman transitions (corresponding to a 3D temperature of K), and propagate them in the Raman beams. The details of the model are given in the Supplementary Material. The model reproduces well the data, and allows to assess the residual intensity inhomogeneities of the top-hat beam. Fig. 4b) shows the measured Rabi oscillation confronted to a simulation where intensity noise of various levels is added on the top-hat profile not . The data match best the numerical simulation assuming an inhomogeneity of rms, consistent with the optical characterization of the intensity inhomogeneities of reported in Fig. 1.
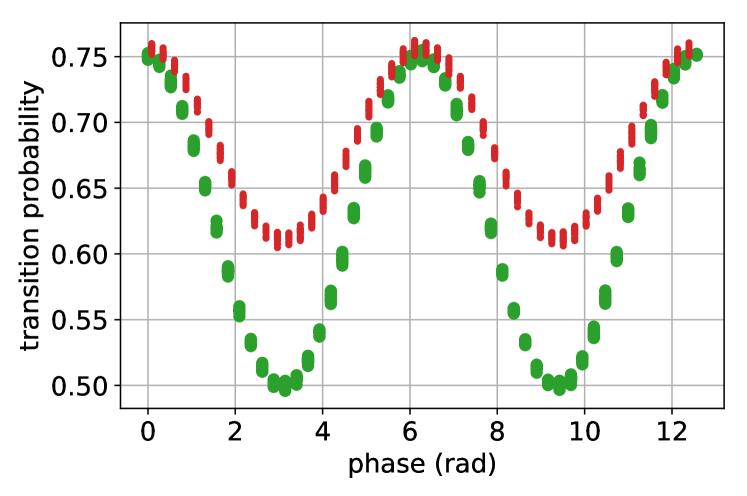
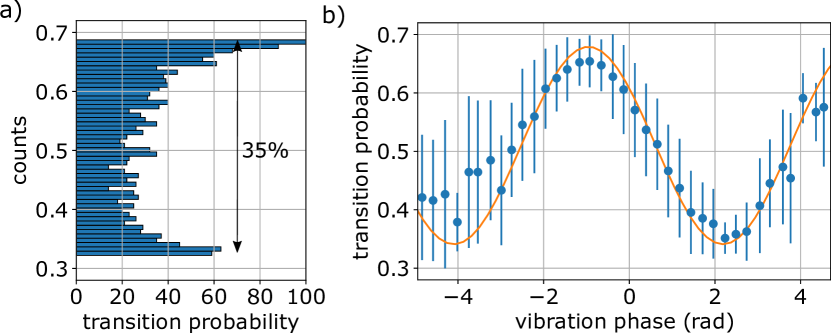
Finally, we demonstrate that the top-hat beam is suited for high-sensitivity atom interferometry, by running a 3-pulse atom interferometer sequence with a pulse separation time ms. The first pulse is realized in the Gaussian beam (on the way up, ms), while the second and third pulses are realized in the top-hat beam ( and ms). For such long interrogation time, the interferometer is highly sensitive to vibration noise producing at its output a typical rms phase shift of more than rad. Running the interferometer results in a random sampling of the fringe pattern by vibration noise, which appears blurred without additional knowledge on vibration noise at each run. To extract the contrast, we follow the method of Ref. Geiger et al. (2011) and compute the histogram of the transition probability data (Fig. 5a), from which we extract a contrast of . Furthermore, we recover the interference fringes by correlating the atom interferometer output with the phase calculated from vibration data acquired with two brodband seismometers Merlet et al. (2009); Dutta et al. (2016), see Fig. 5b). The uncertainty () on the fitted phase is 80 mrad, corresponding to an horizontal acceleration uncertainty of m.s-2. Although the measurement sensitivity is limited by residual vibration noise, this experiment shows that the top-hat beam is compatible with high-sensitivity inertial measurements based on long-interrogation-time cold-atom interferometry.
In conclusion, we have set up and characterized a collimated top-hat laser beam and reported on its implementation in a long interrogation time cold-atom interferometer. Our top-hat beam features a constant intensity over a region of mm with rms variations of about , We expect that the intensity homogeneity offered by top-hat beams compared to Gaussian beams will be beneficial to various atom interferometer geometries which we discuss below. We present additional advantages in the Supplementary Material.
The intensity homogeneity of the interrogation beams will allow reducing or canceling important systematic effects in cold-atom interferometers, such as the two photon light shift Gauguet et al. (2008). It can also be used to improve the efficiency and stability of atom launching techniques based on the coherent transfer of photon momenta, such as in Bloch oscillations Bouchendira et al. (2011); Parker et al. (2018); Asenbaum et al. (2017). Moreover, this beamshaping solution could be adapted for atom interferometers with baselines of several meters as in Ref. Asenbaum et al. (2017).
Employing a single top-hat beam can be used to build compact, yet precise, cold-atom inertial sensors. For example, a mm wide homogeneous intensity profile should allow to run a fountain interferometer with a total interferometer time ms if the atoms are launched from the bottom of the beam. Moreover, the design of gyroscopes, where the atoms travel through successive laser beams with a velocity transverse to the momentum transfers Gauguet et al. (2009); Tackmann et al. (2012); Yao et al. (2018), could be simplified with a single top-hat beam.
Homogeneity of the intensity profile should reduce the diffraction phase shifts encountered in LMT Bragg diffraction Chiow et al. (2011); Altin et al. (2013); Estey et al. (2015). For example, a variation of of laser intensity in Bragg diffraction amounts to a variation in diffraction phase of about 84 mrad Büchner et al. (2003). The rms intensity uniformity of our top-hat beam is between and over a region of mm (Fig. 1c). Keeping a rms intensity variation within a Gaussian beam requires to work within a reduced portion around the center, which translates in using only of the total power. This suggests that the efficiency and accuracy of LMT beam splitters should be significantly improved by employing top-hat beams.
Acknowledgements.
We thank Josiane Firminy and Faouzi Boussaha for their realization of engraved aspheric phase plates in an early design of beamshaper conducted in the beginning of this project. This work was supported by Ville de Paris (project HSENS-MWGRAV), FIRST-TF (ANR-10-LABX-48-01), Centre National d’Etudes Saptiales (CNES), Sorbonne Universités (project LORINVACC), Action Spécifique du CNRS Gravitation, Références, Astronomie et Métrologie (GRAM), and by the European Union’s Horizon 2020 research and innovation programme under the Marie Sklodowska-Curie grant agreement No 660081. We thank Laurence Pruvost for fruitful discussions.References
- Canuel et al. (2006) B. Canuel, F. Leduc, D. Holleville, A. Gauguet, J. Fils, A. Virdis, A. Clairon, N. Dimarcq, C. J. Bordé, A. Landragin, and P. Bouyer, Phys. Rev. Lett. 97, 010402 (2006).
- Geiger et al. (2011) R. Geiger, V. Ménoret, G. Stern, N. Zahzam, P. Cheinet, B. Battelier, A. Villing, F. Moron, M. Lours, Y. Bidel, A. Bresson, A. Landragin, and P. Bouyer, Nature Communications 2, 474 (2011).
- Cheiney et al. (2018) P. Cheiney, L. Fouché, S. Templier, F. Napolitano, B. Battelier, P. Bouyer, and B. Barrett, ArXiv e-prints (2018), arXiv:1805.06198 [physics.atom-ph] .
- Bouchendira et al. (2011) R. Bouchendira, P. Cladé, S. Guellati-Khélifa, F. Nez, and F. Biraben, Physical Review Letters 106 (2011), 10.1103/PhysRevLett.106.080801.
- Rosi et al. (2014) G. Rosi, F. Sorrentino, L. Cacciapuoti, M. Prevedelli, and G. M. Tino, Nature 510, 518 (2014).
- Parker et al. (2018) R. H. Parker, C. Yu, W. Zhong, B. Estey, and H. Müller, Science 360, 191 (2018), http://science.sciencemag.org/content/360/6385/191.full.pdf .
- Peters, Chung, and Chu (2001) A. Peters, K. Y. Chung, and S. Chu, Metrologia 38, 25 (2001).
- Hu et al. (2013) Z.-K. Hu, B.-L. Sun, X.-C. Duan, M.-K. Zhou, L.-L. Chen, S. Zhan, Q.-Z. Zhang, and J. Luo, Phys. Rev. A 88, 043610 (2013).
- Gillot et al. (2014) P. Gillot, O. Francis, A. Landragin, F. P. D. Santos, and S. Merlet, Metrologia 51, L15 (2014).
- Freier et al. (2016) C. Freier, M. Hauth, V. Schkolnik, B. Leykauf, M. Schilling, H. Wziontek, H.-G. Scherneck, J. Müller, and A. Peters, J. Phys. Conf. Ser. 723, 012050 (2016).
- Wang et al. (2018) S.-K. Wang, Y. Zhao, W. Zhuang, T.-C. Li, S.-Q. Wu, J.-Y. Feng, and C.-J. Li, Metrologia 55, 360 (2018).
- Bidel et al. (2018) Y. Bidel, N. Zahzam, C. Blanchard, A. Bonnin, M. Cadoret, A. Bresson, D. Rouxel, and M. F. Lequentrec-Lalancette, Nature Communications 9, 627 (2018).
- Karcher et al. (2018) R. Karcher, A. Imanaliev, S. Merlet, and F. Pereira dos Santos, ArXiv e-prints (2018), arXiv:1804.04909 [physics.atom-ph] .
- McGuirk et al. (2002) J. M. McGuirk, G. T. Foster, J. B. Fixler, M. J. Snadden, and M. A. Kasevich, Physical Review A 65 (2002), 10.1103/PhysRevA.65.033608.
- Sorrentino et al. (2012) F. Sorrentino, A. Bertoldi, Q. Bodart, L. Cacciapuoti, M. de Angelis, Y.-H. Lien, M. Prevedelli, G. Rosi, and G. M. Tino, Applied Physics Letters 101, 114106 (2012).
- Dimopoulos et al. (2007) S. Dimopoulos, P. W. Graham, J. M. Hogan, and M. A. Kasevich, Phys. Rev. Lett. 98, 111102 (2007).
- Lepoutre et al. (2012) S. Lepoutre, A. Gauguet, G. Trénec, M. Büchner, and J. Vigué, Phys. Rev. Lett. 109, 120404 (2012).
- Aguilera et al. (2014) D. N. Aguilera, H. Ahlers, B. Battelier, A. Bawamia, A. Bertoldi, R. Bondarescu, K. Bongs, P. Bouyer, C. Braxmaier, L. Cacciapuoti, and et al, Classical and Quantum Gravity 31, 115010 (2014).
- Zhou et al. (2015) L. Zhou, S. Long, B. Tang, X. Chen, F. Gao, W. Peng, W. Duan, J. Zhong, Z. Xiong, J. Wang, Y. Zhang, and M. Zhan, Physical Review Letters 115 (2015), 10.1103/PhysRevLett.115.013004.
- Jaffe et al. (2017) M. Jaffe, P. Haslinger, V. Xu, P. Hamilton, A. Upadhye, B. Elder, J. Khoury, and H. Müller, Nature Physics 13, 938 (2017).
- Asenbaum et al. (2017) P. Asenbaum, C. Overstreet, T. Kovachy, D. D. Brown, J. M. Hogan, and M. A. Kasevich, Physical Review Letters 118 (2017), 10.1103/PhysRevLett.118.183602.
- Chaibi et al. (2016) W. Chaibi, R. Geiger, B. Canuel, A. Bertoldi, A. Landragin, and P. Bouyer, Physical Review D 93 (2016), 10.1103/PhysRevD.93.021101.
- Hogan and Kasevich (2016) J. M. Hogan and M. A. Kasevich, Phys. Rev. A 94, 033632 (2016).
- Dutta et al. (2016) I. Dutta, D. Savoie, B. Fang, B. Venon, C. Garrido Alzar, R. Geiger, and A. Landragin, Physical Review Letters 116 (2016), 10.1103/PhysRevLett.116.183003.
- Gauguet et al. (2009) A. Gauguet, B. Canuel, T. Lévèque, W. Chaibi, and A. Landragin, Phys. Rev. A 80, 063604 (2009).
- Mazzoni et al. (2015) T. Mazzoni, X. Zhang, R. Del Aguila, L. Salvi, N. Poli, and G. M. Tino, Phys. Rev. A 92, 053619 (2015).
- Büchner et al. (2003) M. Büchner, R. Delhuille, A. Miffre, C. Robilliard, J. Vigué, and C. Champenois, Phys. Rev. A 68, 013607 (2003).
- Gori (1994) F. Gori, Optics Communications 107, 335 (1994).
- Pal et al. (2018) V. Pal, C. Tradonsky, R. Chriki, N. Kaplan, A. Brodsky, M. Attia, N. Davidson, and A. A. Friesem, Appl. Opt. 57, 4583 (2018).
- Ma et al. (2010) H. Ma, Z. Liu, P. Zhou, X. Wang, Y. Ma, and X. Xu, Journal of Optics 12, 045704 (2010).
- Hoffnagle and Jefferson (2000) J. A. Hoffnagle and C. M. Jefferson, Appl. Opt. 39, 5488 (2000).
- (32) Asphericon website, cited .
- Louchet-Chauvet et al. (2011) A. Louchet-Chauvet, T. Farah, Q. Bodart, A. Clairon, A. Landragin, S. Merlet, and F. P. D. Santos, New Journal of Physics 13, 065025 (2011).
- (34) M. Takeda, H. Ina, and S. Kobayashi, 72, 156.
- Schkolnik et al. (2015) V. Schkolnik, B. Leykauf, M. Hauth, C. Freier, and A. Peters, Applied Physics B 120, 311 (2015).
- Meunier et al. (2014) M. Meunier, I. Dutta, R. Geiger, C. Guerlin, C. L. Garrido Alzar, and A. Landragin, Physical Review A 90 (2014), 10.1103/PhysRevA.90.063633.
- (37) We varied the spatial frequencies of the added intensity noise and found no substantial difference in the simulation results as long as the spatial period was smaller than about 1/10 of the beam size. In the simulation reported in Fig. 3, the spatial period of the noise is 1/100 of the beam size.
- Merlet et al. (2009) S. Merlet, J. LeGouët, Q. Bodart, A. Clairon, A. Landragin, F. Pereira Dos Santos, and P. Rouchon, Metrologia 46, 87 (2009), arXiv:0806.0164 [physics.atom-ph] .
- Gauguet et al. (2008) A. Gauguet, T. E. Mehlstäubler, T. Lévèque, J. Le Gouët, W. Chaibi, B. Canuel, A. Clairon, F. P. Dos Santos, and A. Landragin, Phys. Rev. A 78, 043615 (2008).
- Tackmann et al. (2012) G. Tackmann, P. Berg, C. Schubert, S. Abend, M. Gilowski, W. Ertmer, and E. M. Rasel, New Journal of Physics 14, 015002 (2012).
- Yao et al. (2018) Z.-W. Yao, S.-B. Lu, R.-B. Li, J. Luo, J. Wang, and M.-S. Zhan, Physical Review A 97 (2018), 10.1103/PhysRevA.97.013620.
- Chiow et al. (2011) S.-w. Chiow, T. Kovachy, H.-C. Chien, and M. A. Kasevich, Physical Review Letters 107 (2011), 10.1103/PhysRevLett.107.130403.
- Altin et al. (2013) P. A. Altin, M. T. Johnsson, V. Negnevitsky, G. R. Dennis, R. P. Anderson, J. E. Debs, S. S. Szigeti, K. S. Hardman, S. Bennetts, G. D. McDonald, L. D. Turner, J. D. Close, and N. P. Robins, New Journal of Physics 15, 023009 (2013).
- Estey et al. (2015) B. Estey, C. Yu, H. Müller, P.-C. Kuan, and S.-Y. Lan, Phys. Rev. Lett. 115, 083002 (2015).
- Riou et al. (2017) I. Riou, N. Mielec, G. Lefèvre, M. Prevedelli, A. Landragin, P. Bouyer, A. Bertoldi, R. Geiger, and B. Canuel, Journal of Physics B: Atomic, Molecular and Optical Physics 50, 155002 (2017).
SUPPLEMENTARY MATERIAL
Intensity profile: additional data and discussion
While we did not investigate in our work the origin of the residual intensity noise, it is probable that it originates from the roughness of the optics used in the beam shaper (containing 7 (aspheric) lenses) and in the input collimator and expander, which induces scattered light that interferes with the main beam. Improved surface quality of these optical surfaces may result in a lower intensity noise. For comparison, a rms intensity noise was achieved in Ref. Hoffnagle and Jefferson (2000), were only 2 aspheric lenses were used in the beam shaper.
Relative phase: additional data and discussion
We show in Fig. 7 the relative phase maps extracted from the measurement with the asymmetric Michelson interferometer for different distances of propagation (i.e. various differences in arm length between the two arms of the interferometer). The first column shows the measurement for zero propagation distance and allows to assess the limit of the method given by the quality of the optics.
Numerical calculations show evidence that this relative phase measurement represents an upper bound on the relative phase inhomogeneities of the top-hat beam. When simulating an asymmetric Michelson interferometer injected with a perfect top-hat beam and with optics of surface flatness of PV (reflecting the value specified by the manufacturer), we recover relative phase maps with inhomogeneities of typically PV for a difference of propagation of cm, similar to the values reported in Fig. 7. Moreover, when numerically propagating a top-hat beam with an intensity noise similar to the one shown in Fig. 1c) of the main text, we find relative phase inhomogeneities lower than PV (and rms) over 1 m of propagation.
Still, we computed the impact of such relative phase inhomogeneities on the bias of a 3-light-pulse atom interferometer with pulse separation time . To this end, we numerically propagated an atom cloud with the velocity distribution used previously (see first section) in the top-hat beam, and extracted the interferometer phase. For a pulse separation time as long as s, we find a bias of typically 40 mrad.
Relative phase for an ideal top-hat beam
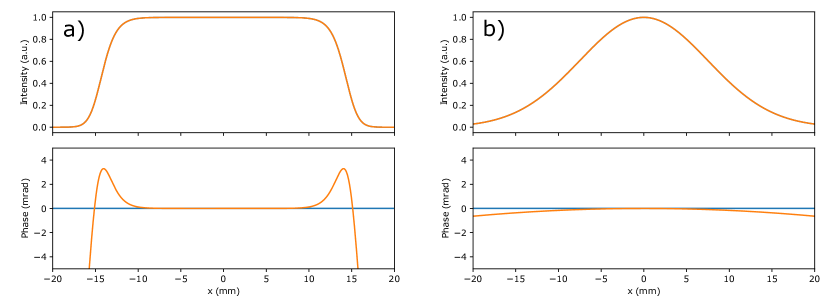
As described in, e.g. Ref. Gori (1994), a flattened Gaussian beam such as our top-hat beam can be expressed as a sum of Laguerre-Gauss modes, LGn (with mode index ), which propagation can be analytically computed. In Fig. 8, we show as an illustration the relative phase of an ideal top-hat beam (of 30 mm FWHM) for a distance of propagation of 30 cm, and compare it to the relative phase of an ideal Gaussian beam of similar size (30 mm diameter at ). The relative phase inhomogeneities are well below 1 mrad until the edge of the top-hat beam is reached.
Model for the Rabi oscillations
To model the Rabi oscillations, we employ a Monte-Carlo simulation where we generate an ensemble of atoms with individual velocities following the distribution measured with the Doppler-sensitive Raman transitions (corresponding to a 3D temperature of K). The individual transition probabilities are calculated according to
| (1) |
where is the two-photon Rabi frequency, proportional to the local intensity of the beam at the position of the atom, the pulse duration, and the two photon detuning, with the two-photon wave-vector and the velocity of the atom in the direction of the beam. Damping of the Rabi oscillations results from the average of many sinusoids with different Rabi frequencies and/or detunings. The simulation accounts for the finite detection region of the atoms (modeled as a rectangle of 30 mm by 30 mm in the plane transverse to gravity), and for spontaneous emission. The peak intensity is fitted on the upwards Rabi oscillation and fixed to this value for the downward oscillations. The model reproduces well the data, and allows to assess the intensity homogeneity of the top-hat beam.
Gain in atom inteferometer performance with the top-hat beam: numerical examples
We present here two examples of performance improvement offered by the use of top-hat beams over Gaussian beams in different atom interferometer geometries.
Gain in contrast in a 4-pulse atom interferometer.
The model for the Rabi oscillations presented in the previous section matches well the experimental data (Fig. 4 of the main text), and can thus be used to simulate the contrast of an atom interferometer in a particular geometry. We simulate a 4-pulse atom interferometer with a total interrogation time of 800 ms as in Ref. Dutta et al. (2016), using the same velocity distribution as before (Cesium atoms, temperature 1.2 K).
We take into account the finite laser power which we keep constant between the top-hat and Gaussian beams.
A compromise has to be operated: while a large beam size allows to address more atoms (after expansion), it results in a decrease of the peak intensity, which is detrimental to the transfer efficiency owing to the velocity selectivity of counter-propagating Raman transitions. Therefore, we calculate the optimal size of the beams that provides the highest contrast. We assume that the two beams have the same size and receive the same optical power. We initialize the optimization by considering a laser power corresponding to a peak two-photon Rabi frequency of 25 kHz for 20 mm waist Gaussian beams.
After optimization, we find a maximum contrast of for optimal Gaussian beams of 16 mm waist; the maximum contrast is for optimal top-hat beams of 24 mm FWHM (the FWHM of the top-hat beam presented in the main text is 31.7 mm).
Large Momentum Transfer (LMT) atom-optics. We numerically evaluated the impact of Rabi frequency inhomogeneities on the efficiency of LMT Bragg transition, using the numerical model developed in our earlier works (e.g. Ref. Riou et al. (2017)). We find that, in the quasi-Bragg regime, a variation of in the two-photon Rabi frequency (proportional to laser intensity) leads to of variation in the pulse efficiency for a Bragg transition (as used, e.g., in Ref. Mazzoni et al. (2015)). Maintaining a rms intensity variation within a Gaussian beam amounts to use only of the power corresponding to the central part.
In comparison, employing a top-hat beam with the same intensity profile as the one reported in our work (Fig. 1d)) allows to use more than of the power.